Quantcast
Channel: Severalnines
Viewing all 1262 articles
Browse latest View live

Webinar Replay & Slides: Become a MySQL DBA - Schema Changes for MySQL Replication & Galera Cluster

$
0
0

Thanks to everyone who joined us for our recent live webinar on ‘Schema Changes for MySQL Replication & Galera Cluster’ led by Krzysztof Książek, Senior Support Engineer at Severalnines. The replay and slides to the webinar are now available to watch and read online via the links below.

Watch the replay


Read the slides


AGENDA

  • Different methods to perform schema changes on MySQL Replication and Galera
    • Rolling schema change
    • Online alters
    • External tools, e.g., pt-online-schema-change
  • Differences between MySQL 5.5 and 5.6
  • Differences between MySQL Replication vs Galera
  • Example real-life scenarios with MySQL Replication and Galera setups

osc2_mysqll.png

SPEAKER

Krzysztof Książek, Senior Support Engineer at Severalnines, is a MySQL DBA with experience managing complex database environments for companies like Zendesk, Chegg, Pinterest and Flipboard. This webinar builds upon recent blog posts and related webinar series by Krzysztof on how to become a MySQL DBA.

For further blogs in this series visit: http://www.severalnines.com/blog-categories/db-ops

Blog category:


Replication Topology Changes for MySQL and MariaDB - New Live Webinar on September 29th

$
0
0

A database replication topology is never written in stone - it evolves along with your application and data. Changes are usually needed to help scale out, to distribute your database across multiple regions or data centers, or to perform software/hardware maintenance operations. The initial setup of a replication topology is simple, but as soon as you start changing it, things can quickly get complex. 

How do we fail-over our replication masters and slaves without affecting the availability and consistency of our data?

In this webinar, we will discuss how to perform replication topology changes in MySQL / MariaDB, and what the failover process may look like. We’ll also discuss some external tools you may find useful when dealing with those operations.

DATE, TIME & REGISTRATION

Europe/MEA/APAC
Tuesday, September 29th at 09:00 BST / 10:00 CEST (Germany, France, Sweden)
Register Now

North America/LatAm
Tuesday, September 29th at 09:00 Pacific Time (US) / 12:00 Eastern Time (US)
Register Now

AGENDA

  • MySQL Replication topology changes
    • using GTID
    • using regular replication
  • Failover process
  • Using MaxScale for automatic re-routing of queries
  • Other external tools useful when dealing with failover

SPEAKER

Krzysztof Książek, Senior Support Engineer at Severalnines, is a MySQL DBA with experience in managing complex database environments for companies like Zendesk, Chegg, Pinterest and Flipboard. 

This webinar builds upon recent blog posts and related webinar series by Krzysztof on how to become a MySQL DBA.

We look forward to “seeing” you there and to insightful discussions!

Blog category:

Press Release: ClusterControl enables MySQL HA for the European Broadcasting Union and its 200 million viewers

$
0
0

The home of Eurovision and Euroradio choses Severalnines to tune its MySQL databases

Stockholm, Sweden and anywhere else in the world – Severalnines, the provider of database infrastructure management software, recently announced its latest customer, European Broadcasting Union (EBU), a premium media distributor of live sports, culture, news and entertainment content. The Swedish company won the new deal in the same year as heartthrob compatriot Måns Zelmerlöw’s rendition of “Heroes” won the EBU’s flagship programme, the Eurovision Song Contest, watched by 200 million viewers.

EBU_logo-relaunch.png

The EBU is the world’s leading alliance of public service media with 73 Members in 56 countries across Europe and beyond. The EBU’s platform provides content creators in the broadcasting industry with high-quality material, its most famous production being the annual Eurovision Song Contest.

Demand for high quality web-based video and audio content from customers challenged the resources of the EBU’s small internal IT team to keep its technology infrastructure running, especially during spike viewing times. Therefore, the EBU wanted world-class technology and expertise to keep its web-based services, powered by 16 open source databases, online around the clock.

After a review process in early 2014, Severalnines was recommended to the EBU by a Swiss IT services provider. Severalnines was selected due to its in depth knowledge of managing open source databases and clustering technologies like Galera Cluster for MySQL, which form the basis of the EBU’s IT architecture. It took just under a month to conduct a thorough investigation of the automation and management capabilities of ClusterControl.

The EBU signed up for Severalnines’ 24/7 Support, enterprise-level subscription package, which offers additional peace of mind when running mission-critical database clusters. Once the decision was made, ClusterControl helped quickly configure database clusters and high availability settings according to EBU's needs.

With Severalnines, EBU’s internal IT teams now had the tools to manage and monitor all database clusters via a single dashboard providing access to real-time information to act promptly on performance issues. Severalnines helped EBU to focus on new business initiatives such as delivering mobile services to customers, as well as save on hiring one full time Database Administrator per year.

Laurent Pythoud, IT Web Manager at EBU, said: “We needed expert advice and help to optimise our database operations at a time when customers are asking for better streaming and content delivery services. Severalnines was the best fit and a lot of good reviews online gave us the confidence to work with them. Led by their CEO, Vinay Joosery, the Severalnines team offered excellent, personalised support and gave us practical advice on how to enhance our systems. Thanks to Severalnines, we can spend more time working with our customers to deliver the next generation of content services as our back end is completely protected.”

Vinay Joosery, Severalnines CEO said: “It has already been a good year for Sweden. As a Swedish company, "we don’t know if we are happier about winning the Eurovision Song Contest or hearing about how ClusterControl has helped the EBU to succeed". With our goal to help enterprises operate open source databases at the heart of their IT fabric, it is great to see our technology is the number one hit for EBU. We look forward to continue our work and make EBU’s databases sing!”

About Severalnines

Severalnines provides automation and management software for database clusters. We help companies deploy their databases in any environment, and manage all operational aspects to achieve high-scale availability.

Severalnines' products are used by developers and administrators of all skills levels to provide the full 'deploy, manage, monitor, scale' database cycle, thus freeing them from the complexity and learning curves that are typically associated with highly available database clusters. The company has enabled over 7,000 deployments to date via its popular online database configurator. Currently counting BT, Orange, Cisco, CNRS, Technicolor, AVG, Ping Identity and Paytrail as customers. Severalnines is a private company headquartered in Stockholm, Sweden with offices in Singapore and Tokyo, Japan. To see who is using Severalnines today visit, http://www.severalnines.com/company.

Press contacts

Positive Marketing
Ed Stevenson|Tom Foster
severalnines@positivemarketing.com
0203 637 0644/0646

Severalnines
Jean-Jerome Schmidt
jj@severalnines.com

Blog category:

Become a MySQL DBA blog series - Deep Dive SQL Workload Analysis using pt-query-digest

$
0
0

In our previous post, we showed you how to interpret reports generated by pt-query-digest. Today we’d like to cover some of its more advanced features, as it is a pretty extensive tool with lots of functionality. We’ll also show you what information you should be looking for, and how to derive conclusions based on that data. 

This is the eleventh installment in the ‘Become a MySQL DBA’ blog series. Our previous posts in the DBA series include Analyzing SQL Workload with pt-query-digest, Query Tuning Process, Configuration Tuning,  Live Migration using MySQL Replication, Database Upgrades, Replication Topology Changes, Schema Changes, High Availability, Backup & Restore, Monitoring & Trending.

What to look for in pt-query-digest summary section?

When you get a report generated by pt-query-digest, the summary is a good place to start. If you are familiar with your workload, this can indicate whether the workload you captured looks “normal” or whether something has changed. This is true for the test scenario we’ve prepared here - we are familiar with the sysbench workload which we used to generate this slow log. The queries are fairly quick and do not suffer from any locking. We’ve added a couple of ad hoc queries to the mix to simulate non-optimal queries that somehow slipped through a QA process and started to impact production.

# Overall: 2.54M total, 25 unique, 2.07k QPS, 1.26x concurrency __________
# Time range: 2015-08-26 07:05:51 to 07:26:17
# Attribute          total     min     max     avg     95%  stddev  median
# ============     ======= ======= ======= ======= ======= ======= =======
# Exec time          1546s     1us     44s   608us     1ms    53ms   194us
# Lock time           162s       0     12s    63us    84us    13ms    28us
# Rows sent         40.53M       0 488.90k   16.73   97.36  764.93    0.99
# Rows examine     119.91M       0   4.77M   49.51  299.03   7.58k    0.99
# Rows affecte       5.42M       0   1.90M    2.24    0.99   1.66k       0
# Bytes sent         5.24G       0  95.38M   2.16k  11.91k 145.05k  192.76
# Merge passes           0       0       0       0       0       0       0
# Tmp tables       124.03k       0       1    0.05    0.99    0.22       0
# Tmp disk tbl           0       0       0       0       0       0       0
# Tmp tbl size      15.03G       0 124.12k   6.21k 123.85k  27.00k       0
# Query size       139.75M       5     247   57.70  158.58   53.40   36.69
# InnoDB:
# IO r bytes        14.70G       0   1.02G   6.74k  15.96k   1.69M       0
# IO r ops         940.81k       0  65.51k    0.42    0.99  107.46       0
# IO r wait           267s       0      4s   116us   568us     4ms       0
# pages distin       8.24M       0  59.41k    3.78    9.83   99.56    3.89
# queue wait             0       0       0       0       0       0       0
# rec lock wai         57s       0     12s    24us       0    14ms       0
# Boolean:
# Filesort      10% yes,  89% no
# Full scan      0% yes,  99% no
# Tmp table      5% yes,  94% no

In the summary above, you can notice the max execution time of 44 seconds and max lock time of 12 seconds. This is definitely not a pattern that we are used to, it has to be a result of the new queries. Number of max bytes sent by a query is also not common in the sysbench workload. It’s fairly well indexed, so there’s not that much data being sent to the client. This tells us a couple of things - we are dealing with queries that scan lots of rows. At least some of them are DMLs as we see a significant increase in lock time. A part of the report where we see InnoDB statistics tells us that this is row lock time.

Let’s check a summary of all queries, we are mostly interested in the execution time per call column (R/Call). You may notice a lot of administrative queries like SHOW PROCESSLIST or SHOW TABLES. MySQL logs every query out there and you can see different entries in your slow log.

# Profile
# Rank Query ID           Response time  Calls   R/Call  V/M   Item
# ==== ================== ============== ======= ======= ===== ===========
#    1 0x558CAEF5F387E929 385.0075 24.9% 1269596  0.0003  0.00 SELECT sbtest?
#    2 0x737F39F04B198EF6 171.1443 11.1%  127006  0.0013  0.00 SELECT sbtest?
#    3 0x6408196D4E419490 141.9605  9.2%       6 23.6601  0.17 SELECT sbtest?
#    4 0x84D1DEE77FA8D4C3 122.1600  7.9%  127006  0.0010  0.00 SELECT sbtest?
#    5 0x813031B8BBC3B329 107.4760  7.0%  126996  0.0008  0.00 COMMIT
#    6 0x3821AE1F716D5205 106.3605  6.9%  127006  0.0008  0.00 SELECT sbtest?
#    7 0xD30AD7E3079ABCE7  89.2480  5.8%  126986  0.0007  0.46 UPDATE sbtest?
#    8 0xE96B374065B13356  80.0196  5.2%  126973  0.0006  2.71 UPDATE sbtest?
#    9 0xEAB8A8A8BEEFF705  79.4696  5.1%  126964  0.0006  2.29 DELETE sbtest?
#   10 0x89E30DDBB4B37EEB  74.9633  4.8%       5 14.9927 13.34 INSERT SELECT sbtest?
#   11 0x6EEB1BFDCCF4EBCD  72.2472  4.7%  127006  0.0006  0.00 SELECT sbtest?
#   12 0x30B616F874042DCA  52.4873  3.4%       3 17.4958 11.48 DELETE sbtest?
#   13 0xF1256A27240AEFC7  46.7403  3.0%  126968  0.0004  0.00 INSERT sbtest?
#   14 0x85FFF5AA78E5FF6A  15.9546  1.0%  126840  0.0001  0.00 BEGIN
#   15 0x43330BA654921FCF   0.4734  0.0%       2  0.2367  0.31 TRUNCATE TABLE sbtest? sbtest2
#   16 0x7EEF4A697C2710A5   0.1043  0.0%      40  0.0026  0.04 SHOW PROCESSLIST
#   17 0x86780A22FD730AC4   0.0991  0.0%       1  0.0991  0.00 CREATE TABLE sbtest? sbtest2
#   18 0x45609ADE347419D3   0.0488  0.0%      97  0.0005  0.00 SHOW PROCESSLIST
#   19 0xE3A3649C5FAC418D   0.0381  0.0%       8  0.0048  0.01 SELECT
#   20 0x35AAC71503957920   0.0319  0.0%       1  0.0319  0.00 FLUSH
#   21 0x5CBA2034458B5BC9   0.0191  0.0%       1  0.0191  0.00 SHOW DATABASES
#   22 0xFB38455BF7035609   0.0041  0.0%       1  0.0041  0.00 SELECT
#   23 0x132628303F99240D   0.0013  0.0%       1  0.0013  0.00 SHOW TABLES
#   24 0x44AE35A182869033   0.0009  0.0%       1  0.0009  0.00 ADMIN INIT DB
#   25 0xAA353644DE4C4CB4   0.0000  0.0%       8  0.0000  0.00 ADMIN QUIT

From what we can tell, there are three queries which are much slower than the rest (queries 3, 10 and 12). They did not generate the majority of the load on the system, but they are likely responsible for the performance degradation of our system. Also, keep in mind that the query which generates the largest load may not be the root of the problem. You have to check it query by query.

Another piece of interesting data is the variable to mean (V/M) column. We’ll paste here the relevant data to make it easier to see:

# Rank Query ID           Response time  Calls   R/Call  V/M   Item
# ==== ================== ============== ======= ======= ===== ===========
#    7 0xD30AD7E3079ABCE7  89.2480  5.8%  126986  0.0007  0.46 UPDATE sbtest?
#    8 0xE96B374065B13356  80.0196  5.2%  126973  0.0006  2.71 UPDATE sbtest?
#    9 0xEAB8A8A8BEEFF705  79.4696  5.1%  126964  0.0006  2.29 DELETE sbtest?

As you can see, all of those queries are fast most of the time - that’s what the R/Call column shows. Yet, from time to time, those queries take much longer to finish (as shown by V/M column).

Summary of the queries - what to check for?

We can say that by now we have some idea what might have gone wrong with new queries, we still should go query by query to confirm our suspicions.

First query, the one which is causing the largest impact on the system.

# Query 1: 1.05k QPS, 0.32x concurrency, ID 0x558CAEF5F387E929 at byte 795398174
# This item is included in the report because it matches --limit.
# Scores: V/M = 0.00
# Time range: 2015-08-26 07:06:13 to 07:26:17
# Attribute    pct   total     min     max     avg     95%  stddev  median
# ============ === ======= ======= ======= ======= ======= ======= =======
# Count         49 1269596
# Exec time     24    385s     1us   548ms   303us   839us     1ms   144us
# Lock time     31     52s       0    54ms    40us    80us   167us    25us
# Rows sent      2   1.21M       1       1       1       1       0       1
# Rows examine   1   1.21M       1       1       1       1       0       1
# Rows affecte   0       0       0       0       0       0       0       0
# Bytes sent     4 236.10M     195     195     195     195       0     195
# Merge passes   0       0       0       0       0       0       0       0
# Tmp tables     0       0       0       0       0       0       0       0
# Tmp disk tbl   0       0       0       0       0       0       0       0
# Tmp tbl size   0       0       0       0       0       0       0       0
# Query size    32  46.01M      37      38   38.00   36.69       0   36.69
# InnoDB:
# IO r bytes    21   3.12G       0  48.00k   2.57k  15.96k   5.95k       0
# IO r ops      21 199.39k       0       3    0.16    0.99    0.37       0
# IO r wait     38    102s       0   261ms    80us   445us   568us       0
# pages distin  26   2.22M       0       9    1.83    3.89    1.93       0
# queue wait     0       0       0       0       0       0       0       0
# rec lock wai   0       0       0       0       0       0       0       0
# String:
# Databases    sbtest
# Hosts        10.0.0.200
# InnoDB trxID 26307 (10/0%), 26308 (10/0%), 2630B (10/0%)... 127003 more
# Last errno   0
# Users        sbtest
# Query_time distribution
#   1us  #
#  10us  #
# 100us  ################################################################
#   1ms  ##
#  10ms  #
# 100ms  #
#    1s
#  10s+
# Tables
#    SHOW TABLE STATUS FROM `sbtest` LIKE 'sbtest1'\G
#    SHOW CREATE TABLE `sbtest`.`sbtest1`\G
# EXPLAIN /*!50100 PARTITIONS*/
SELECT c FROM sbtest1 WHERE id=2396269\G

This is a no-brainer. The query is based on a primary key or an unique key (EXPLAIN can show us exactly which index, column name is id therefore PK is more likely) as it’s scanning no more than a single row. If the query uses a covering index (all data can be accessed using index page only, no row lookup is needed), it’d be the most optimal query you can execute in MySQL. If not, it’s still very close to perfect. Sometimes queries cannot be optimized further, even if you see them at the top of the pt-query-digest reports. The only way to limit the impact caused by this query would be to add a covering index (not much gain), not to execute it (perhaps not very realistic) or execute it less often by using aggressive caching. It’s not always possible but sometimes it is a viable option.

Second query:

# Query 2: 105.49 QPS, 0.14x concurrency, ID 0x737F39F04B198EF6 at byte 409226517
# This item is included in the report because it matches --limit.
# Scores: V/M = 0.00
# Time range: 2015-08-26 07:06:13 to 07:26:17
# Attribute    pct   total     min     max     avg     95%  stddev  median
# ============ === ======= ======= ======= ======= ======= ======= =======
# Count          5  127006
# Exec time     11    171s   332us   293ms     1ms     3ms     2ms   839us
# Lock time      4      7s       0    33ms    57us   119us   235us    35us
# Rows sent     29  12.11M     100     100     100     100       0     100
# Rows examine  30  36.34M     300     300     300     300       0     300
# Rows affecte   0       0       0       0       0       0       0       0
# Bytes sent    28   1.48G  12.18k  12.18k  12.18k  12.18k       0  12.18k
# Merge passes   0       0       0       0       0       0       0       0
# Tmp tables    99 124.03k       1       1       1       1       0       1
# Tmp disk tbl   0       0       0       0       0       0       0       0
# Tmp tbl size 100  15.03G 124.12k 124.12k 124.12k 124.12k       0 124.12k
# Query size     7   9.81M      79      81   81.00   80.10    0.01   80.10
# InnoDB:
# IO r bytes     4 749.03M       0  64.00k   6.04k  31.59k  12.76k       0
# IO r ops       4  46.81k       0       4    0.38    1.96    0.79       0
# IO r wait     10     27s       0   292ms   211us     1ms     1ms       0
# pages distin   6 572.71k       4       7    4.62    5.75    0.64    4.96
# queue wait     0       0       0       0       0       0       0       0
# rec lock wai   0       0       0       0       0       0       0       0
# Boolean:
# Filesort     100% yes,   0% no
# Tmp table    100% yes,   0% no
# String:
# Databases    sbtest
# Hosts        10.0.0.200
# InnoDB trxID 26307 (1/0%), 26308 (1/0%), 2630B (1/0%)... 127003 more
# Last errno   0
# Users        sbtest
# Query_time distribution
#   1us
#  10us
# 100us  ################################################################
#   1ms  #############################################
#  10ms  #
# 100ms  #
#    1s
#  10s+
# Tables
#    SHOW TABLE STATUS FROM `sbtest` LIKE 'sbtest1'\G
#    SHOW CREATE TABLE `sbtest`.`sbtest1`\G
# EXPLAIN /*!50100 PARTITIONS*/
SELECT DISTINCT c FROM sbtest1 WHERE id BETWEEN 2835942 AND 2835942+99 ORDER BY c\G

This query is responsible for all of the temporary tables that have been created. Unfortunately, because of a range condition on the ‘id’ column, there’s no easy way to avoid creating them. What is also very important - this query is fast: average - 1ms, 95% - 3ms. It’s very unlikely that you’d be able to improve it much further. Sometimes there’s no point to try to reach perfection - you could use your time better tuning other queries, you just have to settle for ‘good enough’.

Third query, also the first of the queries we suspected:

# Query 3: 0.01 QPS, 0.22x concurrency, ID 0x6408196D4E419490 at byte 831892659
# This item is included in the report because it matches --limit.
# Scores: V/M = 0.17
# Time range: 2015-08-26 07:06:49 to 07:17:48
# Attribute    pct   total     min     max     avg     95%  stddev  median
# ============ === ======= ======= ======= ======= ======= ======= =======
# Count          0       6
# Exec time      9    142s     22s     28s     24s     27s      2s     23s
# Lock time      0     3ms    55us     3ms   493us     3ms   935us    82us
# Rows sent      7   2.86M 486.91k 488.90k 488.12k 485.50k       0 485.50k
# Rows examine  23  28.61M   4.77M   4.77M   4.77M   4.77M       0   4.77M
# Rows affecte   0       0       0       0       0       0       0       0
# Bytes sent    10 571.38M  94.99M  95.38M  95.23M  92.12M       0  92.12M
# Merge passes   0       0       0       0       0       0       0       0
# Tmp tables     0       0       0       0       0       0       0       0
# Tmp disk tbl   0       0       0       0       0       0       0       0
# Tmp tbl size   0       0       0       0       0       0       0       0
# Query size     0     246      41      41      41      41       0      41
# InnoDB:
# IO r bytes    41   6.13G   1.02G   1.02G   1.02G 1006.04M       0 1006.04M
# IO r ops      41 392.26k  65.26k  65.51k  65.38k  62.55k       0  62.55k
# IO r wait      4     13s      1s      4s      2s      4s   775ms      2s
# pages distin   4 356.46k  59.41k  59.41k  59.41k  56.74k       0  56.74k
# queue wait     0       0       0       0       0       0       0       0
# rec lock wai   0       0       0       0       0       0       0       0
# Boolean:
# Full scan    100% yes,   0% no
# String:
# Databases    sbtest
# Hosts        localhost
# InnoDB trxID 271D7 (1/16%), 27C90 (1/16%), 28AB5 (1/16%)... 3 more
# Last errno   0
# Users        root
# Query_time distribution
#   1us
#  10us
# 100us
#   1ms
#  10ms
# 100ms
#    1s
#  10s+  ################################################################
# Tables
#    SHOW TABLE STATUS FROM `sbtest` LIKE 'sbtest1'\G
#    SHOW CREATE TABLE `sbtest`.`sbtest1`\G
# EXPLAIN /*!50100 PARTITIONS*/
select * from sbtest1 where pad like '2%'\G

Ok, we can see very clearly why this query is slow. It’s making a full table scan, examining almost 5 million rows in the process. The amount of work needed to perform this task definitely can impact performance of MySQL. It’s especially true if all of this data had to be read from disk.

Now, let’s take a look at one of the ‘unstable’ DML’s:

# Query 7: 105.47 QPS, 0.07x concurrency, ID 0xD30AD7E3079ABCE7 at byte 466984796
# This item is included in the report because it matches --limit.
# Scores: V/M = 0.46
# Time range: 2015-08-26 07:06:13 to 07:26:17
# Attribute    pct   total     min     max     avg     95%  stddev  median
# ============ === ======= ======= ======= ======= ======= ======= =======
# Count          5  126986
# Exec time      5     89s     1us      6s   702us     2ms    18ms   287us
# Lock time     10     17s       0      6s   135us   131us    18ms    38us
# Rows sent      0       0       0       0       0       0       0       0
# Rows examine   0 124.01k       1       1       1       1       0       1
# Rows affecte   2 124.01k       1       1       1       1       0       1
# Bytes sent     0   6.30M      52      52      52      52       0      52
# Merge passes   0       0       0       0       0       0       0       0
# Tmp tables     0       0       0       0       0       0       0       0
# Tmp disk tbl   0       0       0       0       0       0       0       0
# Tmp tbl size   0       0       0       0       0       0       0       0
# Query size     3   4.97M      40      41   41.00   40.45    0.01   40.45
# InnoDB:
# IO r bytes     2 346.02M       0  96.00k   2.79k  15.96k   6.33k       0
# IO r ops       2  21.63k       0       6    0.17    0.99    0.39       0
# IO r wait      6     17s       0    97ms   136us   657us   804us       0
# pages distin  12   1.03M       4      25    8.47   11.95    2.22    7.70
# queue wait     0       0       0       0       0       0       0       0
# rec lock wai  16      9s       0      6s    72us       0    18ms       0
# String:
# Databases    sbtest
# Hosts        10.0.0.200
# InnoDB trxID 26307 (1/0%), 26308 (1/0%), 2630B (1/0%)... 126983 more
# Last errno   0
# Users        sbtest
# Query_time distribution
#   1us  #
#  10us  #
# 100us  ################################################################
#   1ms  #########
#  10ms  #
# 100ms  #
#    1s  #
#  10s+
# Tables
#    SHOW TABLE STATUS FROM `sbtest` LIKE 'sbtest1'\G
#    SHOW CREATE TABLE `sbtest`.`sbtest1`\G
UPDATE sbtest1 SET k=k+1 WHERE id=2274156\G
# Converted for EXPLAIN
# EXPLAIN /*!50100 PARTITIONS*/
select  k=k+1 from sbtest1 where  id=2274156\G

Please take a look at the query execution time distribution - it’s a very nice graphical presentation of a very important feature of every query - predictable and stable performance. In this case we can clearly see that the execution time of this query is not stable - most of the time it finishes in 100us - 10ms area but it can as well take 1 - 10 seconds to finish. This is clearly a sign of problem. By looking at rows examined and rows affected it’s clear that we use either PK or a unique key as it scans and updates one row only. We now need to look at the lock time and execution time - max is in both cases 6 seconds. It means that query had to wait before it could have been executed. Finally, in InnoDB section, we can confirm that it’s not an I/O but row locking on which query was waiting.

Let’s check one of the long-running DML’s:

# Query 10: 0.03 QPS, 0.38x concurrency, ID 0x89E30DDBB4B37EEB at byte 369866706
# This item is included in the report because it matches --limit.
# Scores: V/M = 13.34
# Time range: 2015-08-26 07:09:42 to 07:13:01
# Attribute    pct   total     min     max     avg     95%  stddev  median
# ============ === ======= ======= ======= ======= ======= ======= =======
# Count          0       5
# Exec time      4     75s      5s     44s     15s     42s     14s      9s
# Lock time      0    37ms   181us    14ms     7ms    14ms     4ms     7ms
# Rows sent      0       0       0       0       0       0       0       0
# Rows examine   2   2.76M 194.33k   1.71M 564.26k   1.69M 587.22k 283.86k
# Rows affecte  50   2.76M 194.33k   1.71M 564.26k   1.69M 587.22k 283.86k
# Bytes sent     0     306      61      62   61.20   59.77       0   59.77
# Merge passes   0       0       0       0       0       0       0       0
# Tmp tables     0       0       0       0       0       0       0       0
# Tmp disk tbl   0       0       0       0       0       0       0       0
# Tmp tbl size   0       0       0       0       0       0       0       0
# Query size     0     380      73      77      76   76.28    1.78   76.28
# InnoDB:
# IO r bytes     4 629.86M  39.30M 383.56M 125.97M 379.16M 129.77M  56.55M
# IO r ops       4  39.37k   2.46k  23.97k   7.87k  23.58k   8.07k   3.52k
# IO r wait      1      4s   159ms      1s   809ms      1s   470ms   992ms
# pages distin   0  59.18k   3.01k  27.79k  11.84k  27.29k   8.26k   9.33k
# queue wait     0       0       0       0       0       0       0       0
# rec lock wai   0    23ms       0    21ms     5ms    21ms     8ms       0
# String:
# Databases    sbtest
# Hosts        localhost
# InnoDB trxID 3187A (1/20%), 32D01 (1/20%), 364D8 (1/20%)... 2 more
# Last errno   0
# Users        root
# Query_time distribution
#   1us
#  10us
# 100us
#   1ms
#  10ms
# 100ms
#    1s  ################################################################
#  10s+  ##########################################
# Tables
#    SHOW TABLE STATUS FROM `sbtest` LIKE 'sbtest2'\G
#    SHOW CREATE TABLE `sbtest`.`sbtest2`\G
#    SHOW TABLE STATUS FROM `sbtest` LIKE 'sbtest1'\G
#    SHOW CREATE TABLE `sbtest`.`sbtest1`\G
insert into sbtest2 select * from sbtest1 where id > 210000 and id < 2000000\G

Here we have a INSERT INTO … SELECT query, a query that will lock all of the rows it has to copy. As you can see in the execution time row, it took up to 44 seconds. This is a significant amount of time for which those rows stayed unavailable for any other queries. It is very important to keep in mind that operations like this have to be performed on a small subset of rows at a time. Exact numbers depend on a table and your hardware but we’d say 1000 rows is a good number at the beginning. This way you will minimize the execution time for a given batch, you will also minimize the number of locked rows. Thanks to this, the whole process should be less impacting on the rest of the workload.

Ordering data in a report

As we mentioned in the previous post in the series, pt-query-digest, by default, sorts queries by their total execution time. This is a good choice most of the time but there are some cases when you’d want to change this default behavior.

For that you can use --order-by option for pt-query-digest. It’s syntax is: ‘attribute:how_to_aggregate’. Most of the time you’ll be just fine aggregating the data using ‘sum’ - i.e. total execution time or sum of a rows examined. Sometimes you may find it useful with ‘max’ and ‘min’ to sort results by the largest ‘maximal or minimal number of rows sent’. For attributes, the easiest way to find what’s available is by running:

$ head -n 50 /var/lib/mysql/slow.log | pt-query-digest --filter 'print Dumper $event' --no-report --sample 1

You shall see output like:

$VAR1 = {
  Bytes_sent => '11',
  Filesort => 'No',
  Filesort_on_disk => 'No',
  Full_join => 'No',
  Full_scan => 'No',
  Killed => '0',
  Last_errno => '0',
  Lock_time => '0.000000',
  Merge_passes => '0',
  QC_Hit => 'No',
  Query_time => '0.000080',
  Rows_affected => '0',
  Rows_examined => '0',
  Rows_sent => '0',
  Thread_id => '4',
  Tmp_disk_tables => '0',
  Tmp_table => 'No',
  Tmp_table_on_disk => 'No',
  Tmp_table_sizes => '0',
  Tmp_tables => '0',
  arg => 'BEGIN',
  bytes => 5,
  cmd => 'Query',
  db => 'sbtest',
  fingerprint => 'begin',
  host => '10.0.0.200',
  ip => '10.0.0.200',
  pos_in_log => 1793,
  timestamp => '1440572773',
  ts => '150826  7:06:13',
  user => 'sbtest'

which contains all attributes. Not every one of them makes sense to be used as a way of ordering the results but some, yes.

Let’s say that we are concerned that some of the queries are scanning rows extensively and we want to locate them. You could use the following line to sort the report accordingly:

$ pt-query-digest --limit=100% --order-by=Rows_examined:sum /var/lib/mysql/slow.log

Here’s an example from our slowlog:

# Profile
# Rank Query ID           Response time  Calls   R/Call  V/M   Item
# ==== ================== ============== ======= ======= ===== ===========
#    1 0x737F39F04B198EF6 171.1443 11.1%  127006  0.0013  0.00 SELECT sbtest?
#    2 0x6408196D4E419490 141.9605  9.2%       6 23.6601  0.17 SELECT sbtest?
#    3 0x84D1DEE77FA8D4C3 122.1600  7.9%  127006  0.0010  0.00 SELECT sbtest?
#    4 0x3821AE1F716D5205 106.3605  6.9%  127006  0.0008  0.00 SELECT sbtest?
#    5 0x6EEB1BFDCCF4EBCD  72.2472  4.7%  127006  0.0006  0.00 SELECT sbtest?
#    6 0x89E30DDBB4B37EEB  74.9633  4.8%       5 14.9927 13.34 INSERT SELECT sbtest?
#    7 0x30B616F874042DCA  52.4873  3.4%       3 17.4958 11.48 DELETE sbtest?
#    8 0x558CAEF5F387E929 385.0075 24.9% 1269596  0.0003  0.00 SELECT sbtest?
#    9 0xD30AD7E3079ABCE7  89.2480  5.8%  126986  0.0007  0.46 UPDATE sbtest?
#   10 0xE96B374065B13356  80.0196  5.2%  126973  0.0006  2.71 UPDATE sbtest?
#   11 0xEAB8A8A8BEEFF705  79.4696  5.1%  126964  0.0006  2.29 DELETE sbtest?
#   12 0x3D8C074C26D05CD7   0.0084  0.0%       3  0.0028  0.00 SELECT query_review
#   13 0x5CBA2034458B5BC9   0.0417  0.0%       5  0.0083  0.00 SHOW DATABASES
#   14 0xF4F497B76C5267E1   0.0309  0.0%       2  0.0154  0.03 SELECT query_review
#   15 0x132628303F99240D   0.0048  0.0%       7  0.0007  0.00 SHOW TABLES
#   16 0x7DD5F6760F2D2EBB   0.0108  0.0%       3  0.0036  0.01 SHOW VARIABLES
#   17 0x641B2CB5DDEE851E   0.0002  0.0%       3  0.0001  0.00 SHOW TABLES
#   18 0x9FE96489A777ECF1   0.0005  0.0%       3  0.0002  0.00 SHOW DATABASES
#   19 0x60E05F7AE7229A61   0.0002  0.0%       1  0.0002  0.00 SELECT query_review
# MISC 0xMISC             171.4946 11.1%  381154  0.0004   0.0 <40 ITEMS>

As you can see, our ‘not-optimal’ queries moved up in the report because they did a lot of table scans and, as a result, examined a lot or rows.

Let’s imagine that we want to find queries which are affecting most rows. We suspect that some of the DML’s lock large number of rows because of lack of indexing or bad design. We can use --order-by=Rows_affected:sum for that:

$ pt-query-digest --limit=100% --order-by=Rows_affected:sum /var/lib/mysql/slow.log

Here’s output for our workload:

# Profile
# Rank Query ID           Response time   Calls   R/Call  V/M   Item
# ==== ================== =============== ======= ======= ===== ==========
#    1 0x89E30DDBB4B37EEB   74.9633  4.8%       5 14.9927 13.34 INSERT SELECT sbtest?
#    2 0x30B616F874042DCA   52.4873  3.4%       3 17.4958 11.48 DELETE sbtest?
#    3 0xD30AD7E3079ABCE7   89.2480  5.8%  126986  0.0007  0.46 UPDATE sbtest?
#    4 0xF1256A27240AEFC7   46.7403  3.0%  126968  0.0004  0.00 INSERT sbtest?
#    5 0xEAB8A8A8BEEFF705   79.4696  5.1%  126964  0.0006  2.29 DELETE sbtest?
#    6 0xE96B374065B13356   80.0196  5.2%  126973  0.0006  2.71 UPDATE sbtest?
#    7 0xE3976283BBC14F4E    0.0419  0.0%      41  0.0010  0.01 INSERT UPDATE percona_schema.query_review
#    8 0xC06E8004D54640A9    0.0003  0.0%       3  0.0001  0.00 CREATE DATABASE `percona_schema`
#    9 0xA1D2DFF5912E5AD9    0.0242  0.0%       1  0.0242  0.00 DROP DATABASE percona
#   10 0x7231E892053F2CC3    0.0706  0.0%       1  0.0706  0.00 CREATE DATABASE percona
# MISC 0xMISC             1123.5224 72.6% 2031784  0.0006   0.0 <47 ITEMS>

Our “bad” DMLs took the top two places in the report. This is not unexpected given the high number of rows they scanned compared to optimal writes performed by sysbench. Having an ability to reorganize the order in the report can help us find these queries quickly. 

Collect review data for pt-query-digest

If you use pt-query-digest for regular reviews, there is a pretty neat feature that you can use. When you start it with --review option and pass the correct DSN to it, pt-query-digest will create a percona_schema.query_review table with following schema:

mysql> show create table query_review\G
*************************** 1. row ***************************
       Table: query_review
Create Table: CREATE TABLE `query_review` (
  `checksum` bigint(20) unsigned NOT NULL,
  `fingerprint` text NOT NULL,
  `sample` text NOT NULL,
  `first_seen` datetime DEFAULT NULL,
  `last_seen` datetime DEFAULT NULL,
  `reviewed_by` varchar(20) DEFAULT NULL,
  `reviewed_on` datetime DEFAULT NULL,
  `comments` text,
  PRIMARY KEY (`checksum`)
) ENGINE=InnoDB DEFAULT CHARSET=latin1
1 row in set (0.01 sec)

This table will be used to store data about queries included in a report. The data will look something like this:

*************************** 1. row ***************************
   checksum: 6164494361339357481
fingerprint: select c from sbtest? where id=?
     sample: SELECT c FROM sbtest1 WHERE id=2396269
 first_seen: 2015-08-26 07:06:13
  last_seen: 2015-08-26 07:26:17
reviewed_by: NULL
reviewed_on: NULL
   comments: NULL

We can see the checksum of the table (decimal version of a hex checksum used in pt-query-digest), fingerprint, sample and time when the query was spotted for the first time and when it was last found. Next, we have columns which can be updated manually - if you set ‘reviewed_by’ column to some value, it will be skipped in the next report. This is very handy because you don’t have to go through all of the queries - you are presented with only those queries which you haven’t reviewed yet. To be precise, the summary section will contain all of the queries but query details are printed only for queries which haven’t been marked as reviewed.

The remaining two columns can be used to store information when a query has been reviewed and any comments related to it. It is possible to add additional columns, if you want to store additional data. If you want to locate a query using it’s checksum as shown in the report, you can run the following query:

select * from query_review where checksum=0xDA69864C6215FEDB\G
*************************** 1. row ***************************
   checksum: 15738258035444154075
fingerprint: set @@sql_quote_show_create = ?/*!?, @@sql_mode=?*/
     sample: SET @@SQL_QUOTE_SHOW_CREATE = 1/*!40101, @@SQL_MODE='NO_AUTO_VALUE_ON_ZERO,NO_ENGINE_SUBSTITUTION'*/
 first_seen: 2015-08-27 14:45:41
  last_seen: 2015-08-27 14:50:02
reviewed_by: Severalnines
reviewed_on: NULL
   comments: NULL
1 row in set (0.00 sec)

Collect query performance metrics using pt-query-digest

Another feature, very similar to what we just covered, is option --history, which creates a table percona_schema.query_history. This table contains data about performance metrics collected by pt-query-digest. We are talking here about all those metrics that you see in the report. 

It’s a great way to understand how query performance changes in time. Let’s say we are interested in a particular query and it’s locking profile:

mysql> select sample, Query_time_max, Lock_time_sum, Lock_time_max, InnoDB_rec_lock_wait_max,InnoDB_IO_r_wait_max  from percona_schema.query_history where checksum=15207204461855030503\G
*************************** 1. row ***************************
                  sample: UPDATE sbtest1 SET k=k+1 WHERE id=2633533
          Query_time_max: 0.016347
           Lock_time_sum: 0.365343
           Lock_time_max: 0.007466
InnoDB_rec_lock_wait_max: 0
    InnoDB_IO_r_wait_max: 0.010521
*************************** 2. row ***************************
                  sample: UPDATE sbtest1 SET k=k+1 WHERE id=2484959
          Query_time_max: 28.7082
           Lock_time_sum: 80.6104
           Lock_time_max: 28.7007
InnoDB_rec_lock_wait_max: 28.7006
    InnoDB_IO_r_wait_max: 0.063314
2 rows in set (0.00 sec)

It shows that this query slowed down due to waits on row level locks. This table is also a good source of data for graphs and performance reports.

We’ll end here our guided tour of pt-query-digest, and hope you found it useful. Our next blog will be about indexing - what types of indexes are available, how they affect performance and how to design indexes in order to fit a query mix.

Blog category:

Plenty of 9s for highly available MySQL, MariaDB, MongoDB & Postgres databases at Percona Live Europe next week

$
0
0

Getting new t-shirts printed as give-aways for the much anticipated Percona Live Europe Conference in Amsterdam next week is not unlike creating and spinning up lots of MySQL instances. Some might prefer to do so themselves, manually, while others will look at automating most of the required steps (as it takes quite a bit of time to produce 100s of t-shirts by hand …). 

Given the database automation & management folks that we are at Severalnines, we went for automation ;-)

First you need to design the schema: 

Then build your first instance: 

Once you have your first stable instance, you can start to replicate and spin up more: 

Of course, the Severalnines Team will be at the Percona Live conference in Amsterdam to talk about open source databases clustering (in addition to handing out hot off the press s9s t-shirts). So do come by our booth and say hello! It’ll be the booth with all the … 9s ;-)

We also have two colleagues who will speak at the conference as part of the talk schedule as follows.

Severalnines Talks at Percona Live Amsterdam

Talk: Leveraging AWS tools to manage and optimize Galera Cluster on Amazon Cloud
Speaker: Krzysztof Książek, Senior Support Engineer
Time & location: 22 September 12:10PM - 1:10PM @ Matterhorn 3

Krzysztof Książek, Senior Support Engineer at Severalnines, is a MySQL DBA with experience in managing complex database environments for companies like Zendesk, Chegg, Pinterest and Flipboard. 

Talk: MySQL (NDB) Cluster - Best Practices
Speaker: Johan Andersson, CTO
Time & location: 23 September 12:10PM - 1:10PM @ Matterhorn 1

Johan Andersson, CTO at Severalnines and is well-known in the open source database community for his work at MySQL/Sun/Oracle, where he was the Principal Consultant and lead of the MySQL Clustering and High Availability consulting group, where he designed and implemented large-scale MySQL systems at key customers.

We look forward to seeing you next week! There’s still time to register if you haven’t done so yet!

With thanks to Vinny and his team at The T-Shirt Company

Blog category:

High Availability Galera Clusters for Indonesia’s leading eCommerce Payment Gateway

$
0
0

Indonesia, the fourth most populous country in the world, is emerging as an economic powerhouse in Asia Pacific. With 60% of a population of 250 million being under 30 years of age, growing internet penetration and greater spending power by the middle-class have catalyzed the eCommerce sector. The vast majority of Indonesians don’t own credit cards, so local eCommerce players have developed innovative payment solutions.

veritrans.jpg

Veritrans was established in October 2012, and in under 3 years, has grown into one of the largest payment gateways in the country. The company processes payments (credit/debit card, internet and mobile banking) for over 1000 merchants, including businesses such as Garuda Indonesia (the national airline of Indonesia), Groupon Indonesia (Disdus) and Rakuten Indonesia. The company has a staff of 85 employees. Competitors include the likes of Doku, iPayMu, Pay88 and a dozen others. Doku alone processed $520 million worth of transactions in 2014, so there’s some serious money flowing through these gateways. 

A Payment Gateway is a secure online link between a merchant and an acquiring bank. It protects payment details (e.g. credit card details) by encrypting the information and passing it securely between the customer and the merchant, and between the merchant and the payment processor. 

All merchants accepting credit card payments online are required to comply with PCI DSS. Veritrans is a Level 1 service provider, which is the highest level of PCI DSS compliance. 

pci-dss-compliant.jpg

“Our database is mission critical for our business, it is where we store masked and encrypted credit card data, transaction data, merchant and end customer information. With the amount of transactions flowing through our systems, we cannot afford any downtime, performance problems or security glitches. Our databases are fully replicated to a separate DR site. Having a management tool like ClusterControl has helped us achieve our goals.“, says Idris Khanafi, Head of Infrastructure at Veritrans. 

Closely monitoring and managing the infrastructure is an integral part of Veritrans’ production deployments, and ClusterControl offers a rich set of features to help. ClusterControl collects detailed statistics on system, network, storage and database operations, and helps visualize data so the ops team can take quick and effective action. It also manages everything from anomaly detection, remediation of failures, rolling restarts, mix of full and incremental backups and more long term capacity planning. The ops team is now able to manage their entire infrastructure from one tool, instead of having to develop different scripts to manage their databases.

Paytrail, the leading ePayment provider in Finland, also uses ClusterControl to manage MariaDB Cluster across multiple datacenters.

Blog category:

Wordpress Application Clustering using Kubernetes with HAProxy and Keepalived

$
0
0

In a previous blog post, we showed you how to install Kubernetes on CentOS 7. Since then, there’s been a number of changes and we’ve seen the first production-ready release. The “minion” term has been changed to “node” and thousands of bug fixes and new features introduced.

In this blog post, we’re going to play with Kubernetes application clustering and pods. We’ll use Wordpress as the application, with a single MySQL server. We will also have HAProxy and Keepalived to provide simple packet forwarding (for external network) with high availability capability. We assume a Kubernetes master and three Kubernetes nodes are already deployed on CentOS 7 using instructions described in our previous blog post.

Setting up Persistent Disk

In order to achieve application clustering, we have to setup a persistent disk. This to ensure that all respective pods (which could be running on different minions) can access the same data. For bare-metal and on-premises deployment, we have several choices: NFS, GlusterFS or iSCSI. In this example, we are going to setup a simple NFS mount for the Kubernetes volume.

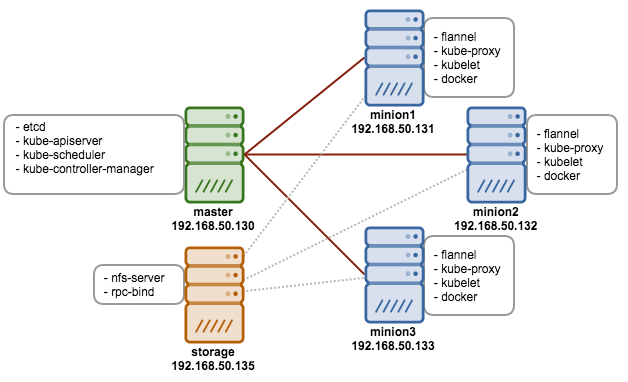
Our Kubernetes cluster architecture is illustrated below:

Note that we are running on Kubernetes v1.0.0-290-gb2dafdaef5acea, so the instructions described in this blog are applicable to that version. 

Setting up NFS Server

Steps in this section should be performed on storage server.

1. Install NFS utilities and create a shared path:

$ yum install nfs-utils
$ mkdir -p /shared/kubernetes/web
$ mkdir -p /shared/kubernetes/db

2. Add following line into /etc/exports:

/shared 192.168.50.0/24(rw,sync,no_root_squash,no_all_squash)

3. Restart NFS related services:

$ systemctl enable rpcbind
$ systemctl enable nfs-server
$ systemctl restart rpcbind
$ systemctl restart nfs-server

Setting up NFS Client

Steps in this section should be performed on all Kubernetes nodes (master and minions).

1. install NFS client so Kubernetes can mount it for persistent disk:

$ yum install nfs-utils

2. Ensure you can see the NFS share on the storage server:

$ showmount -e 192.168.50.135
Export list for 192.168.50.135:
/shared 192.168.50.0/24

Create Persistent Volumes

Steps in this section should be performed on Kubernetes master (or Kubernete client via kubectl).

1. Create a persistent volume for Wordpress. Create a definition file called nfs-web.yaml and add the following lines:

apiVersion: v1
kind: PersistentVolume
metadata:
  name: pv5gweb
spec:
  capacity:
    storage: 5Gi
  accessModes:
    - ReadWriteMany
  persistentVolumeReclaimPolicy: Recycle
  nfs:
    path: /shared/kubernetes/web
    server: 192.168.50.135

2. Create the object:

$ kubectl create -f nfs-web.yaml

3. Create a persistent volume for MySQL data. Create a definition file called nfs-db.yaml and add the following lines:

apiVersion: v1
kind: PersistentVolume
metadata:
  name: pv5gdb
spec:
  capacity:
    storage: 5Gi
  accessModes:
    - ReadWriteMany
  persistentVolumeReclaimPolicy: Recycle
  nfs:
    path: /shared/kubernetes/db
    server: 192.168.50.135

4. Create the object:

$ kubectl create -f nfs-db.yaml

5. List the persistent volumes to verify their existence:

$ kubectl get pv
NAME        LABELS    CAPACITY     ACCESSMODES   STATUS      CLAIM     REASON
pv5gweb     <none>    5368709120   RWO           Available
pv5gdb      <none>    5368709120   RWO           Available

Create Persistent Volume Claims

The steps in this section should be performed on the Kubernetes master (or Kubernete client via kubectl).

1. Create a persistent volume claim for Wordpress. We are going to use 3GB of storage for Wordpress data. Create a definition file called claim-web.yaml and add following lines:

kind: PersistentVolumeClaim
apiVersion: v1
metadata:
  name: myclaim-web
spec:
  accessModes:
    - ReadWriteMany
  resources:
    requests:
      storage: 3Gi

2. Create the object:

$ kubectl create -f claim-web.yaml

3. Create a persistent volume claim for MySQL data. Create a definition file called claim-db.yaml and add the following lines:

kind: PersistentVolumeClaim
apiVersion: v1
metadata:
  name: myclaim-db
spec:
  accessModes:
    - ReadWriteMany
  resources:
    requests:
      storage: 5Gi

4. Create the object:

$ kubectl create -f claim-db.yaml

5. List the persistent volumes and claims to verify their existence:

$ kubectl get pv,pvc
NAME      LABELS    CAPACITY     ACCESSMODES   STATUS    CLAIM                 REASON
pv5gweb   <none>    5368709120   RWX           Bound     default/myclaim-web
pv5gdb    <none>    5368709120   RWX           Bound     default/myclaim-db
NAME          LABELS    STATUS    VOLUME
myclaim-web   map[]     Bound     pv5gweb
myclaim-db    map[]     Bound     pv5gdb

Now we are ready to deploy our application cluster.

Deploying MySQL Pod

Steps in this section should be performed on Kubernetes master (or Kubernete client via kubectl).

1. MySQL is required to be the backend for the Wordpress. Create a definition file called mysql-pod.yaml and add the following lines:

apiVersion: v1
kind: Pod
metadata:
  name: mysql
  labels:
    name: mysql
spec:
  containers:
      image: mysql
      name: mysql
      env:
        - name: MYSQL_ROOT_PASSWORD
          # change this
          value: yourpassword
      ports:
        - containerPort: 3306
          name: mysql
      volumeMounts:
          # name must match the volume name below
        - name: mysql-persistent-storage
          # mount path within the container
          mountPath: /var/lib/mysql
  volumes:
    - name: mysql-persistent-storage
      persistentVolumeClaim:
       claimName: myclaim-db

2. Create the object:

$ kubectl create -f mysql-pod.yaml

3. We are going to assign a dedicated MySQL service IP address (clusterIP) so all Wordpress pods are connected to this one single MySQL database. Create mysql-service.yaml and add following lines:

apiVersion: v1
kind: Service
metadata:
  labels:
    name: mysql
  name: mysql
spec:
  clusterIP: 10.254.10.20
  ports:
    - port: 3306
  selector:
    name: mysql

4. Create the object:

$ kubectl create -f mysql-service.yaml

5. Verify that the pod and service are created:

$ kubectl get pods,services
NAME             READY     STATUS    RESTARTS   AGE
mysql            1/1       Running   1          4d
NAME         LABELS                                    SELECTOR        IP(S)          PORT(S)
kubernetes   component=apiserver,provider=kubernetes   <none>          10.254.0.1     443/TCP
mysql        name=mysql                                name=mysql      10.254.10.20   3306/TCP

The IP address for the mysql service must match the clusterIP defined inside mysql-service.yaml. We are going to use that IP address as MySQL host for the Wordpress pods as described in the next section.

Deploying Wordpress Replication Controller

Steps in this section should be performed on Kubernetes master (or Kubernete client via kubectl).

1. Create a Wordpress replication controller (instead of single pod) by adding the following lines in wordpress-rc.yaml:

apiVersion: v1
kind: ReplicationController
metadata:
  name: frontend
  labels:
    name: frontend
spec:
  replicas: 3
  selector:
    name: frontend
  template:
    metadata:
      labels:
        name: frontend
    spec:
      containers:
      - name: wordpress
        image: wordpress
        ports:
        - containerPort: 80
          name: wordpress
        env:
          - name: WORDPRESS_DB_PASSWORD
            # change this - must match mysql.yaml password
            value: yourpassword
          - name: WORDPRESS_DB_HOST
            value: 10.254.10.20
        volumeMounts:
            # name must match the volume name below
          - name: wordpress-persistent-storage
            # mount path within the container
            mountPath: /var/www/html
      volumes:
        - name: wordpress-persistent-storage
          persistentVolumeClaim:
           claimName: myclaim-web

2. Create the object:

$ kubectl create -f wordpress-rc.yaml

Here is what you would see in the /var/log/messages:

Sep  1 18:17:21 kube-master kube-scheduler: I0901 18:17:21.302311     888 event.go:203] Event(api.ObjectReference{Kind:"Pod", Namespace:"default", Name:"frontend-y2b96", UID:"a1b1b125-5092-11e5-9f33-000c29cf0af4", APIVersion:"v1", ResourceVersion:"31950", FieldPath:""}): reason: 'scheduled' Successfully assigned frontend-y2b96 to 192.168.50.131
Sep  1 18:17:21 kube-master kube-scheduler: I0901 18:17:21.307555     888 event.go:203] Event(api.ObjectReference{Kind:"Pod", Namespace:"default", Name:"frontend-oe7eh", UID:"a1b1bfc6-5092-11e5-9f33-000c29cf0af4", APIVersion:"v1", ResourceVersion:"31951", FieldPath:""}): reason: 'scheduled' Successfully assigned frontend-oe7eh to 192.168.50.132
Sep  1 18:17:21 kube-master kube-scheduler: I0901 18:17:21.315716     888 event.go:203] Event(api.ObjectReference{Kind:"Pod", Namespace:"default", Name:"frontend-xrk64", UID:"a1b1ce2a-5092-11e5-9f33-000c29cf0af4", APIVersion:"v1", ResourceVersion:"31952", FieldPath:""}): reason: 'scheduled' Successfully assigned frontend-xrk64 to 192.168.50.133

3. Create the service for Wordpress replication controller in a definition file called wordpress-service.yaml by adding the following lines:

apiVersion: v1
kind: Service
metadata:
  labels:
    name: frontend
  name: frontend
spec:
  clusterIP: 10.254.10.10
  ports:
    # the port that this service should serve on
    - port: 80
  # label keys and values that must match in order to receive traffic for this service
  selector:
    name: frontend

4. Create the object:

$ kubectl create -f wordpress-service.yaml

5. Verify the created pods and services:

$ kubectl get pods,services
NAME             READY     STATUS    RESTARTS   AGE
frontend-y2b96   1/1       Running   0          3h
frontend-oe7eh   1/1       Running   0          3h
frontend-xrk64   1/1       Running   0          3h
mysql            1/1       Running   1          4d
NAME         LABELS                                    SELECTOR        IP(S)          PORT(S)
frontend     name=frontend                             name=frontend   10.254.10.10   80/TCP
kubernetes   component=apiserver,provider=kubernetes   <none>          10.254.0.1     443/TCP
mysql        name=mysql                                name=mysql      10.254.10.20   3306/TCP

At this moment, you can actually access the Wordpress site locally inside any of the minions via a frontend service IP address. Run the following command on any minions and you should get a 200 OK in the HTTP return code:

$ curl -I http://10.254.10.10/
HTTP/1.1 200 OK
Date: Wed, 02 Sep 2015 05:33:50 GMT
Server: Apache/2.4.10 (Debian) PHP/5.6.12
X-Powered-By: PHP/5.6.12
X-Pingback: http://192.168.50.131/xmlrpc.php
Content-Type: text/html; charset=UTF-8

This service IP address is not routable outside of the Kubernetes cluster. So, our next step is to setup an HAProxy on some of the Kubernetes nodes (in this case, we chose minion1 and minion3) for simple packet forwarding to Kubernetes service IP address.

Deploying HAProxy for packet forwarding

Steps in this section should be performed on Kubernetes minion1 and minion3.

1. Install HAProxy via package manager:

$ yum -y install haproxy

2. Add the following lines into /etc/haproxy/haproxy.cfg:

global
    log 127.0.0.1   local0
    log 127.0.0.1   local1 notice
    user haproxy
    group haproxy

defaults
    log     global
    mode    http
    option  httplog
    option  dontlognull
    option forwardfor
    option http-server-close
    contimeout 5000
    clitimeout 50000
    srvtimeout 50000
    errorfile 400 /usr/share/haproxy/400.http
    errorfile 403 /usr/share/haproxy/403.http
    errorfile 408 /usr/share/haproxy/408.http
    errorfile 500 /usr/share/haproxy/500.http
    errorfile 502 /usr/share/haproxy/502.http
    errorfile 503 /usr/share/haproxy/503.http
    errorfile 504 /usr/share/haproxy/504.http
    stats enable
    stats auth admin:password
    stats uri /stats

frontend all
    bind *:80
    use_backend wordpress_80

backend wordpress_80
    option httpclose
    option forwardfor
    option httpchk HEAD /readme.html HTTP/1.0
    server kube-service-web 10.254.10.10:80 check

3. Enable HAproxy on boot and start it up:

$ sysctemctl enable haproxy
$ sysctemctl start haproxy

4. You should see HAproxy is listening on port 80:

$ netstat -tulpn | grep haproxy
tcp        0      0 0.0.0.0:80              0.0.0.0:*               LISTEN      61024/haproxy

Now go to http://192.168.50.131/stats or http://192.168.50.133/stats and login with admin/password:

Load balancing to the pods will be done internally by Kubernetes via services, not via HAProxy since we just defined a single backend host, which is the Kubernetes service IP address. HAProxy is just a reverse proxy to access Kubernetes service network which is not routable outside.

Deploying Keepalived for Virtual IP address

The last part would be setting up virtual IP address, 192.168.50.100 for high availability so it floats between two load balancers and eliminates any single point of failure if one of the load balancers (also a minion in this setup) goes down. The following steps should be performed on minion1 and minion3 unless specified otherwise.

1. Install Keepalived via package manager:

$ yum install -y keepalived

2. Clear the existing configuration lines and add the following lines on the respective nodes:
minion1 (aka lb1):

vrrp_script chk_haproxy {
        script "killall -0 haproxy"
        interval 2
        weight 2
}
 
vrrp_instance VI_1 {
        interface eth0
        state MASTER
        virtual_router_id 51
        priority 101                    # 101 on master, 100 on backup
        virtual_ipaddress {
            192.168.50.100        # the virtual IP
        }
        track_script {
            chk_haproxy
        }
}

minion3 (aka lb3):

vrrp_script chk_haproxy {
        script "killall -0 haproxy"
        interval 2
        weight 2
}
 
vrrp_instance VI_1 {
        interface eth0
        state MASTER
        virtual_router_id 51
        priority 100                    # 101 on master, 100 on backup
        virtual_ipaddress {
            192.168.50.100        # the virtual IP
        }
        track_script {
            chk_haproxy
        }
}

3. Enable the service on boot and start it up:

$ systemctl enable keepalived
$ systemctl start keepalived

4. Verify that minion1 is promoted to MASTER while minion3 is demoted to BACKUP state:
minion1 (aka lb1):

Sep  2 18:38:16 kube-node3 Keepalived_healthcheckers[46245]: Opening file '/etc/keepalived/keepalived.conf'.
Sep  2 18:38:16 kube-node3 Keepalived_healthcheckers[46245]: Configuration is using : 5556 Bytes
Sep  2 18:38:16 kube-node3 Keepalived_healthcheckers[46245]: Using LinkWatch kernel netlink reflector...
Sep  2 18:38:16 kube-node3 Keepalived_vrrp[46246]: VRRP_Script(chk_haproxy) succeeded
Sep  2 18:38:17 kube-node3 Keepalived_vrrp[46246]: VRRP_Instance(VI_1) Transition to MASTER STATE
Sep  2 18:38:18 kube-node3 Keepalived_vrrp[46246]: VRRP_Instance(VI_1) Entering MASTER STATE
Sep  2 18:38:18 kube-node3 Keepalived_vrrp[46246]: VRRP_Instance(VI_1) setting protocol VIPs.
Sep  2 18:38:18 kube-node3 Keepalived_vrrp[46246]: VRRP_Instance(VI_1) Sending gratuitous ARPs on eth0 for 192.168.50.100
Sep  2 18:38:18 kube-node3 Keepalived_healthcheckers[46245]: Netlink reflector reports IP 192.168.55.100 added

minion3 (aka lb3):

Sep  2 18:39:18 kube-node1 Keepalived_vrrp[24672]: Opening file '/etc/keepalived/keepalived.conf'.
Sep  2 18:39:18 kube-node1 Keepalived_vrrp[24672]: Configuration is using : 61953 Bytes
Sep  2 18:39:18 kube-node1 Keepalived_vrrp[24672]: Using LinkWatch kernel netlink reflector...
Sep  2 18:39:18 kube-node1 Keepalived_vrrp[24672]: VRRP sockpool: [ifindex(2), proto(112), unicast(0), fd(10,11)]
Sep  2 18:39:18 kube-node1 Keepalived_vrrp[24672]: VRRP_Instance(VI_1) Transition to MASTER STATE
Sep  2 18:39:18 kube-node1 Keepalived_vrrp[24672]: VRRP_Instance(VI_1) Received higher prio advert
Sep  2 18:39:18 kube-node1 Keepalived_vrrp[24672]: VRRP_Instance(VI_1) Entering BACKUP STATE

Now we are all set. We can setup the Wordpress application and access it via virtual IP address, http://192.168.50.100/ .

Testing

Access the Wordpress via virtual IP address at http://192.168.50.100/ and you should see the Wordpress setup page:

Follow the installation wizard until the end and you’ll have Wordpress ready and running in high availability setup. If one of the minions goes down, Kubernetes will automatically fire up a new container to match the replication controller definition. In this case, we defined our Wordpress application to run in three replicas.

Notes

  • The pod (container) allocation is dynamic and automatically provisioned by Kubernetes. User can access the pod via Kubernetes service address transparently, without knowing the actual location of the pod.
  • In this example, MySQL pod is still a single-point-of-failure. We can eliminate this by using Galera Cluster or MySQL replication outside of Kubernetes and exclusively use Kubernetes to host our application clusters, or
  • Deploy a Galera Cluster inside Kubernetes as the MySQL backend, as mentioned in this blog post.

Blog category:

High Availability MySQL on cPanel with Galera Cluster

$
0
0

cPanel is a very popular Linux hosting control panel, used not only by hosting providers but also enterprise and goverment bodies. For large scale hosting environments hosting mission critical databases, how do you integrate cPanel with a high availability database? 

In this blog post, we will show you how to integrate Percona XtraDB Cluster into cPanel to provide a high availability database hosting solution. By default, cPanel uses localhost to host the MySQL databases created by cPanel users. It is not uncommon to find MySQL to be the culprit when it comes to overloading the server. By having a remote MySQL server or cluster, we can offload some of the burden and increase the availability of other important services on the server.

Setting up a Galera cluster to integrate with cPanel requires you to meet the following requirements:

  • skip-name-resolve must be turned OFF, as some cPanel services authenticate through hostname. Setting up correct host definitions in /etc/hosts is vital.
  • MySQL tables should only use InnoDB. Some application installers like cpAddons (Site Software) and Softaculous create MyISAM tables in MySQL. These features should be used with extra precaution.
  • The network infrastructure must support multicast or unicast to allow floating virtual IP address. This provides a single access point that can failover between load balancers.
  • Before you set up a remote MySQL server, ensure that the remote server is able to resolve your local server's hostname to its IP address. To confirm this, log into the remote server via SSH and use the host command.
  • MySQL and Perl must already be installed on the remote server.
  • You must be able to connect via SSH from this server’s IP address to the remote server.
  • You must ensure the MySQL users create databases with the following criteria:
    • Storage engine must be InnoDB only. Otherwise, the cluster might crash.
    • All tables must have a primary key defined.
    • Comply to Galera cluster limitations as described here.
  • It’s preferable to let load balancers redirect queries to a single node, to reduce the chance of deadlocks and make it more predictable.

Take note that if you can’t meet the mentioned requirements, then this would be a risky attempt.

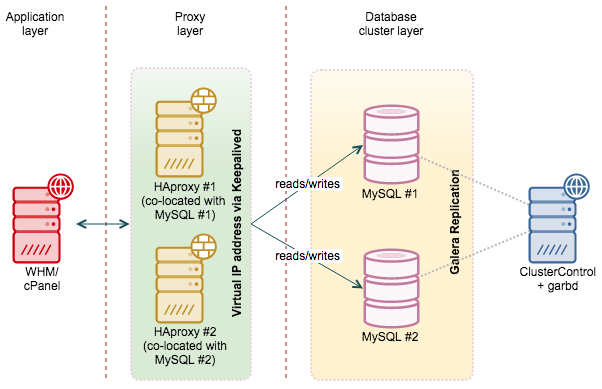
Our architecture is illustrated in the following diagram:

We assume you already have WHM installed. We will use the total of 4 nodes as per below:

  • WHM - cpanel.domain.local - 192.168.1.200
  • MySQL Galera Cluster #1 + HAproxy #1 + Keepalived - g1.domain.local - 192.168.1.211
  • MySQL Galera Cluster #2 + HAproxy #2 + Keepalived - g2.domain.local - 192.168.1.212
  • ClusterControl + Garbd - cc.domain.local -192.168.1.215

WHM will then connect through a virtual IP address floating on galera1 and galera2. This provides failover in case one of the DB nodes goes down. This setup allows only one node to be down at one particular time.

Prerequisites

1. Ensure all hosts have the following host definition inside /etc/hosts:

192.168.1.200     cpanel.domain.local cpanel
192.168.1.210     mysql.domain.local  mysql
192.168.1.211     mysql1.domain.local mysql1    lb1
192.168.1.212     mysql2.domain.local mysql2    lb2
192.168.1.215     cc.domain.local     cc        garbd

2. Ensure each host has proper FQDN set up as per host definition above. For example on cpanel server:

$ hostname -f
cpanel.domain.local

Deploying Galera Cluster for MySQL

1. To set up Galera Cluster, go to the Galera Configurator to generate a deployment package. In the wizard, we used the following values when configuring our database cluster (note that we specified one of the DB nodes twice under Database Servers’ text field) :

Vendor                 : Percona XtraDB Cluster
Infrastructure         : on-premise
Operating System       : RHEL6/CentOS6
Skip DNS Resolve       : No
Number of Galera Servers : 3 + 1
Max connections        : 200 
OS user                : root 
ClusterControl Server  : 192.168.1.215
Galera Servers         : 192.168.1.211 192.168.1.212 192.168.1.212

Follow the wizard, a deployment package will be generated and emailed to you.

2. Download and extract the deployment package:

$ wget http://www.severalnines.com/galera-configurator3/tmp/wb06357009915302877/s9s-galera-codership-3.5.0.tar.gz
$ tar -xzf s9s-galera-percona-3.5.0.tar.gz

3. Before we proceed with the deployment, we need to perform some customization when deploying a two-node Galera cluster. Go to ~/s9s-galera-percona-3.5.0/mysql/config/cmon.cnf.controller and remove the repeated node IP address next to mysql_server_addresses so it becomes as below:

mysql_server_addresses=192.168.1.211,192.168.1.212

4. Now we are ready to start the deployment:

$ cd ~/s9s-galera-percona-3.5.0/mysql/scripts/install/ 
$ bash ./deploy.sh 2>&1 | tee cc.log

5. The database cluster deployment will take about 15 minutes, and once completed, the ClusterControl UI is accessible at https://192.168.1.215/clustercontrol. Enter the default admin email address and password on the welcome page and you should be redirected to the ClusterControl UI dashboard.

6. It is recommended to run Galera on at least three nodes. So, install garbd, a lightweight arbitrator daemon for Galera on the ClusterControl node from the ClusterControl UI. Go to Manage > Load Balancer > Install Garbd > choose the ClusterControl node IP address from the dropdown > Install Garbd.

You will now see Galera Cluster with garbd installed as per below:

Deploying HAProxy and Keepalived

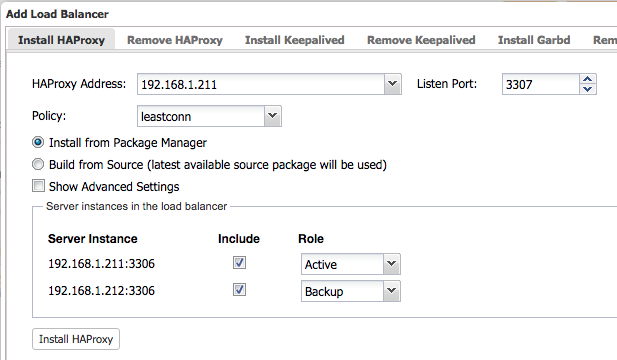
1. Deploy HAProxy on mysql1, 192.168.1.211. Go to ClusterControl > Manage > Load Balancer > Install HAProxy and include both MySQL nodes into the load balancing set with Active/Backup role.

2. Deploy another HAProxy on mysql2, 192.168.1.212 with similar setup:

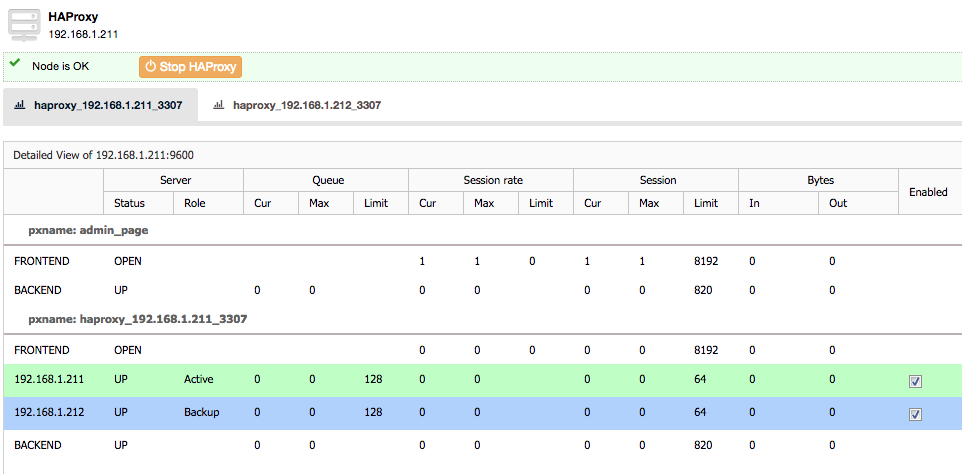
3. Once deployed, you should see the following statistics page if you go to ClusterControl > Nodes > select the HAProxy node:

The green line indicates the MySQL server is up and active. All database requests through this HAProxy instance, port 3307 will be forwarded to mysql1 (192.168.1.211) unless it’s down, where mysql2 (192.168.1.212) will take over the active role. This means, we are not implementing multi-master writes in this setup.

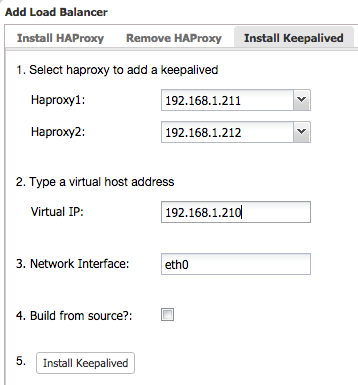
4. We can now deploy Keepalived which requires 2 HAproxy instances. Go to ClusterControl > Manage > Load Balancer > Install Keepalived and specify the virtual IP address as per below:

Now we are ready to integrate Galera Cluster into WHM/cPanel under Setup Remote MySQL Server feature. We will use the virtual IP address specified above as the remote MySQL endpoint for WHM/cPanel.

Integrating Galera Cluster with cPanel

1. cPanel requires a MySQL options file for user root located at /root/.my.cnf which defines the credentials of the remote MySQL server that we are going to use. On all nodes (Galera and cPanel nodes), create a file /root/.my.cnf and add the following lines:

[client]
username=root
password=[mysql root password]
host=192.168.1.210
port=3307

**Replace [mysql root password] with the respective value.

Verify that you can login to MySQL server just by typing the ‘mysql’ command as user root:

root@cpanel [~]$ mysql
Welcome to the MySQL monitor.  Commands end with ; or \g.
Your MySQL connection id is 372
Server version: 5.6.24-72.2-56 Percona XtraDB Cluster (GPL), Release rel72.2, Revision 1, WSREP version 25.11, wsrep_25.11

Copyright (c) 2000, 2015, Oracle and/or its affiliates. All rights reserved.

Oracle is a registered trademark of Oracle Corporation and/or its
affiliates. Other names may be trademarks of their respective
owners.

Type 'help;' or '\h' for help. Type '\c' to clear the current input statement.
mysql>

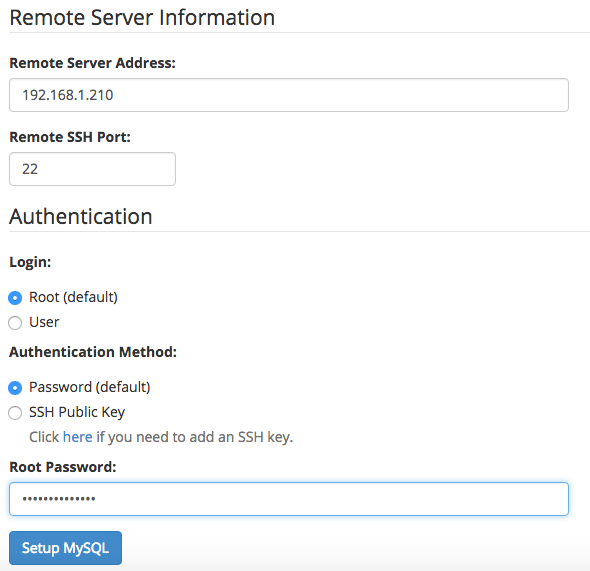
2. From WHM, go to WHM > SQL Services > Setup Remote MySQL Server and specify the virtual IP address of your MySQL Galera Cluster:

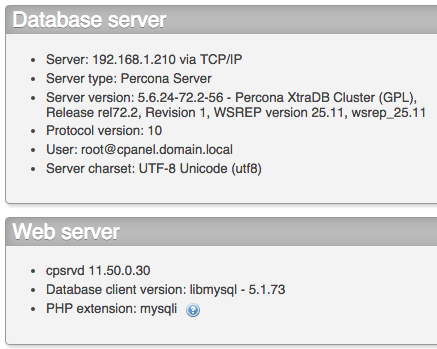
3. Once added, verify if WHM/cPanel connects to the correct database server by going to WHM > SQL Services > PHPmyAdmin and look into the information under Database Server section. You should see something similar to the screenshot below:

4. Now it’s safe to shutdown the local MySQL. Go to WHM > Service Configuration > Service Manager and uncheck the ‘Enabled’ and ‘Monitor’ tickboxes for MySQL Server. From this point, MySQL databases will be hosted on a high availability Galera Cluster with auto failover.

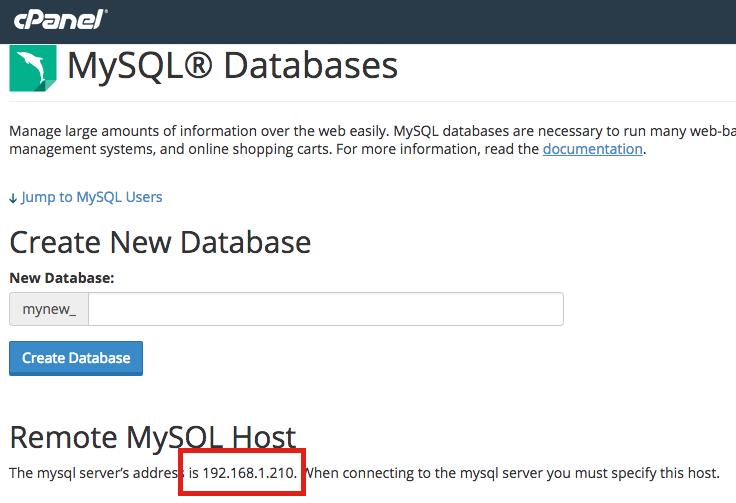
From cPanel, when you are trying to create a new database, it will display the MySQL server address under “Remote MySQL Host” section:

So, make sure you specify the highlighted host when connecting to the MySQL server from the application/client side. The setup is now complete.

Making cPanel fit into Galera

As a hoster, it is likely you will enable cPaddons or some third-party application installer like Fantastico or Softaculous to automate the installation of web applications from cPanel. Some of the applications still explicitly define MyISAM as the storage engine in the SQL files. MyISAM support in Galera is experimental, we would not recommend you run MyISAM tables in your production Galera Cluster.

In order to avoid this, we have to find and replace SQL files which contain MyISAM in the ENGINE statement. Run the following commands to achieve this for the cPaddons installer:

$ cd /usr/local/cpanel/cpaddons
$ sed -i 's|ENGINE=MyISAM|ENGINE=InnoDB|g' $(grep -lir "engine=MyISAM" *)

You can also use the mentioned command for other application installer. In case you upgrade cPanel or the installers, please make sure the engine has not been reverted back to MyISAM. That’s all folks!

Blog category:


Press Release: Severalnines’ ClusterControl helps BT Expedite global expansion for its retail customers

$
0
0

BT’s retail arm Expedite uses ClusterControl platform to scale MySQL and achieve agility on BT Cloud
 
Stockholm, Sweden and anywhere else in the world - 30 September 2015 - Severalnines, the provider of database automation and management software, today announced its latest customer, BT Expedite, BT’s specialist retail arm hosting its customers’ eCommerce applications and omni-channel marketing operations.

Expedite helps 100 leading retailers in 170 countries worldwide, including some of the largest UK retail chains such as Primark, WHSmith, Warehouse and Jigsaw deliver effective customer service online by offering end-to-end IT managed services. As customers are going online first to search, select and purchase goods, the modern day retail store needs an IT system which can manage traffic spikes on eCommerce platforms, especially during big retail events like Cyber Monday and Christmas in the UK. 

The challenge was to find a flexible, cloud-based solution for Expedite customers to cope with increased traffic to web, content and blog sites for when shoppers review blogs and forums during the buying process. Traditional approaches to MySQL high availability could not manage data transactions at a large scale enough for the Expedite IT team, so they decided to set up an online review process for a new solution.

Expedite found Severalnines’ ClusterControl platform offering both scalability and high availability (HA) for cloud-based database applications, with favourable user reviews. During the ClusterControl trial, Expedite's IT team with access rights could set up a database cluster within 15 minutes. It also helped quickly optimise its eCommerce platform, which in turn showed an increase in conversion rates in a highly competitive retail industry.

Based on customer feedback, Expedite wanted to increase online security and resilience as online shopping becomes more popular. Severalnines provided Expedite with auto-recovery for data along with repair and database failure detection alerts.

ClusterControl currently helps Expedite to manage six MySQL database clusters. A year since deployment, ClusterControl has given Expedite’s IT team a transparent overview of database performance on one platform. Using ClusterControl has also led to greater productivity for the Expedite IT team thanks to the automation of previously manual operations which now take minutes rather than days. 

Dominic Day, Head of Managed Hosting at BT Expedite, stated: “ClusterControl has surpassed our expectations. It was a perfect fix to time-consuming issues, especially the scalability and availability of the blog section of our customers’ websites. We are confident with big retail events around the corner that our systems can withstand the growth of traffic fuelled by consumer decisions. Vinay Joosery and his Severalnines team were superb on giving us advice on how to maximise the potential of ClusterControl and our database platforms. My team can now spend more time on creating and delivering innovative customer services.”

Vinay Joosery, Severalnines CEO, said: “Providing the right omni-channel experience through social, mobile, online and offline is where retailers are heading to, and an agile infrastructure that is cost-efficient is a key part of that. We have enjoyed working with the innovative team at BT to put in place a fully automated and cross data-centre database infrastructure on BT Cloud.”
          
 
About Severalnines
Severalnines provides automation and management software for database clusters. We help companies deploy their databases in any environment, and manage all operational aspects to achieve high-scale availability.

Severalnines' products are used by developers and administrators of all skills levels to provide the full 'deploy, manage, monitor, scale' database cycle, thus freeing them from the complexity and learning curves that are typically associated with highly available database clusters. The company has enabled over 7,000 deployments to date via its popular online database configurator. Currently counting BT, Orange, Cisco, CNRS, Technicolour, AVG, Ping Identity and Paytrail as customers. Severalnines is a private company headquartered in Stockholm, Sweden with offices in Singapore and Tokyo, Japan. To see who is using Severalnines today visit, http://www.severalnines.com/company

About BT Expedite
BT Expedite is the retail specialist division within BT. Its mission is to make it easy for retailers to serve their customers. BT Expedite’s solutions enable customer engagement and operational efficiency to enable retailers to thrive in today’s competitive UK environment and grow operations internationally. BT Expedite’s services span every area of multi-channel retailing: eCommerce, store, planning, sourcing, merchandising, CRM; and these are underpinned by BT’s world-class hosting and network infrastructure. It offers fully managed solutions so retailers can focus on what they do best.

BT Expedite currently works with some of the UK’s top retailers, including: WHSmith, Primark, Supergroup, Pets at Home and Mothercare.

For more information, visit www.btexpedite.com.

Blog category:

Become a MySQL DBA blog series - Database Indexing

$
0
0

An index is a data structure that sorts a number of records on one or more fields, and speeds up data retrieval. This is to avoid scanning through the disk blocks that a table spans, when searching through the database. So, what kind of indexes are available in MySQL and how do we use them to get the most performance? This will be the topic for this blog. 

This is the twelfth installment in the ‘Become a MySQL DBA’ blog series. Our previous posts in the DBA series include Deep Dive pt-query-digest, Analyzing SQL Workload with pt-query-digest, Query Tuning Process, Configuration Tuning,  Live Migration using MySQL Replication, Database Upgrades, Replication Topology Changes, Schema Changes, High Availability, Backup & Restore, Monitoring & Trending.

A little bit of theory

MySQL allows for different types of indexes to be used. Most common is a B-Tree index, although this name is also used for other types of indexes: T-Tree in MySQL Cluster and B+Tree in InnoDB. This is the index type you’ll be working the most with, therefore we’ll cover it in some detail. Other types are full text index designed to handle text search in MyISAM and InnoDB. We have also spatial index based on R-Tree design, which is meant to help in spatial data (geometric data) lookups. It is available in MyISAM only, for now - starting from MySQL 5.7.5, spatial indexes can also be created for InnoDB tables - this will eliminate yet another reason for keeping MyISAM in your database. Last but not least, we have hash indexes used in MEMORY engine. They are designed to handle equality comparisons and cannot be used for range searches. They are (usually) much faster than B-Tree indexes, though. MEMORY engine supports B-Tree indexes too.

B-Tree index

Let’s look at how a B-Tree index is designed.

In the diagram above, we have a root node and four leaf nodes. Each entry in a leaf node has a pointer to a row related to this index entry. Leaf nodes are also connected together - each leaf node has a pointer to the beginning of another leaf node (brown square) - this allows for a quick range scan of the index. Index lookup is also pretty efficient. Let’s say we want to find data for entry ‘9’. Instead of scanning the whole table, we can use an index. A quick check in the root node and it’s clear we need to go to a leaf node which covers entries 5<= x < 11. So, we go to the second leaf node and we have the entry for ‘9’.

In the presented example, some of the nodes are not full yet. If we’d insert a row with indexed value of, let’s say 20, it can be inserted into the empty space in the third leaf node.

But what about a row with indexed value of ‘50’? Things are going to be a bit more complex as we do not have enough space in the fourth leaf node. It has to be split.

So, it wasn’t just a single write, i.e., adding an entry to a leaf node. Instead, a couple of additional write operations have to be performed. Please bear in mind that we are still on two levels of a B-Tree index, we have a full root node though. Another split will require adding an additional level of nodes which leads to more write operations. As you may have noticed, indexes make write operations much more expensive than they normally are - a lot of additional work goes into managing indexes. This is very important concept to keep in mind - more indexes is not always better as you are trading quicker selects for slower inserts.

InnoDB vs. MyISAM - differences

Before we discuss different query types, we need to cover some additional basics. We have two index types: primary index and secondary index. Primary index is always unique. Secondary index may or may not be unique. Below you can find definitions for those types of index.

PRIMARY KEY (`rental_id`)
UNIQUE KEY `rental_date` (`rental_date`,`inventory_id`,`customer_id`)
KEY `idx_fk_inventory_id` (`inventory_id`)

How they work internally differs between MyISAM and InnoDB, therefore it’s important to understand what those differences are. In MyISAM things are simple - all of the indexes in their leaf pages contain pointers to rows. There’s not really much of a difference between PRIMARY KEY and UNIQUE KEY. Also, a regular index is structured in the same way as the primary index, only it’s not unique. Each lookup in the index, primary or secondary, points you to the data.

InnoDB is different - it uses clustered PRIMARY KEY. Each InnoDB table has it’s own PK defined - if you haven’t added an explicit PRIMARY KEY, one of the UNIQUE KEYs will be used. If there are no PK nor unique indexes, a hidden PK will be created.

Such primary index’s leaf pages contain all of the data for a given row. This has significant impact on the performance - if you access data through a primary key, there’s no need for any additional data lookup - all of the data you need can be found in the primary key’s leaf pages. On the other hand, secondary indexes, instead of storing a pointer to the data, store the primary key value. Data covered by leaf pages of a key is defined as:

KEY `idx_fk_inventory_id` (`inventory_id`)

is closer to the following definition:

KEY `idx_fk_inventory_id` (`inventory_id`, `rental_id`)

where rental_id is a PK column. This means that every secondary index lookup in InnoDB requires an additional PK lookup to get the actual data. It also means that the longer the PRIMARY KEY is (if you use multiple columns in it or maybe a long VARCHAR column), the longer secondary indexes are. This is not ideal for performance.

Indexes - what queries they can speed up

Now, let’s look at the most popular indexes that can be created in MySQL. We’ll give some examples to help you understand how indexing works in practice.

B-Tree indexes

B-Tree indexes can be used for a large variety of queries. They can speed up queries which match a full value. Let’s take a look at the ‘rental’ table in the ‘Sakila’ sample database:

*************************** 1. row ***************************
       Table: rental
Create Table: CREATE TABLE `rental` (
  `rental_id` int(11) NOT NULL AUTO_INCREMENT,
  `rental_date` datetime NOT NULL,
  `inventory_id` mediumint(8) unsigned NOT NULL,
  `customer_id` smallint(5) unsigned NOT NULL,
  `return_date` datetime DEFAULT NULL,
  `staff_id` tinyint(3) unsigned NOT NULL,
  `last_update` timestamp NOT NULL DEFAULT CURRENT_TIMESTAMP ON UPDATE CURRENT_TIMESTAMP,
  PRIMARY KEY (`rental_id`),
  UNIQUE KEY `rental_date` (`rental_date`,`inventory_id`,`customer_id`),
  KEY `idx_fk_inventory_id` (`inventory_id`),
  KEY `idx_fk_customer_id` (`customer_id`),
  KEY `idx_fk_staff_id` (`staff_id`),
  CONSTRAINT `fk_rental_customer` FOREIGN KEY (`customer_id`) REFERENCES `customer` (`customer_id`) ON UPDATE CASCADE,
  CONSTRAINT `fk_rental_inventory` FOREIGN KEY (`inventory_id`) REFERENCES `inventory` (`inventory_id`) ON UPDATE CASCADE,
  CONSTRAINT `fk_rental_staff` FOREIGN KEY (`staff_id`) REFERENCES `staff` (`staff_id`) ON UPDATE CASCADE
) ENGINE=InnoDB AUTO_INCREMENT=16050 DEFAULT CHARSET=utf8

Key ‘idx_fk_customer_id’ can be used for queries like:

SELECT * FROM rental WHERE customer_id = 1;

As you may have noticed, we can have keys covering single column or multiple columns - such index is called ‘composite index’. ‘rental_date’ is an example of a composite index. It can be used by queries with matching leftmost prefix. Queries like:

SELECT * FROM rental WHERE rental_date = '2015-01-01 22:53:30' AND inventory_id=4;

Please note we didn’t use all the columns that this index covers - just a leftmost prefix of two columns.

Indexes can also work with leftmost prefix of a column. Let’s say we want to look for titles which start with letter ‘L’. Here’s a table we’ll be querying - please note we’re going to use the index ‘idx_title’.

*************************** 1. row ***************************
       Table: film
Create Table: CREATE TABLE `film` (
  `film_id` smallint(5) unsigned NOT NULL AUTO_INCREMENT,
  `title` varchar(255) NOT NULL,
  `description` text,
  `release_year` year(4) DEFAULT NULL,
  `language_id` tinyint(3) unsigned NOT NULL,
  `original_language_id` tinyint(3) unsigned DEFAULT NULL,
  `rental_duration` tinyint(3) unsigned NOT NULL DEFAULT '3',
  `rental_rate` decimal(4,2) NOT NULL DEFAULT '4.99',
  `length` smallint(5) unsigned DEFAULT NULL,
  `replacement_cost` decimal(5,2) NOT NULL DEFAULT '19.99',
  `rating` enum('G','PG','PG-13','R','NC-17') DEFAULT 'G',
  `special_features` set('Trailers','Commentaries','Deleted Scenes','Behind the Scenes') DEFAULT NULL,
  `last_update` timestamp NOT NULL DEFAULT CURRENT_TIMESTAMP ON UPDATE CURRENT_TIMESTAMP,
  PRIMARY KEY (`film_id`),
  KEY `idx_title` (`title`),
  KEY `idx_fk_language_id` (`language_id`),
  KEY `idx_fk_original_language_id` (`original_language_id`),
  CONSTRAINT `fk_film_language` FOREIGN KEY (`language_id`) REFERENCES `language` (`language_id`) ON UPDATE CASCADE,
  CONSTRAINT `fk_film_language_original` FOREIGN KEY (`original_language_id`) REFERENCES `language` (`language_id`) ON UPDATE CASCADE
) ENGINE=InnoDB AUTO_INCREMENT=1001 DEFAULT CHARSET=utf8
1 row in set (0.00 sec)

Here's the query:

SELECT * FROM film WHERE title like 'L%';

Another type of query which can benefit from a B-Tree index is range queries. Let’s say we want to look for films with titles in a range of L - M. We can write a query:

SELECT * FROM film WHERE title > 'L%' AND title < 'N%'\G

and it will use the index on ‘title’ column.

Leaf nodes in a B-Tree index contain pointers to the rows but they also contain the data for the indexed column itself. This makes it possible to build covering indexes - indexes which will remove the need for additional lookup to the tablespace.

Let’s say we want to run the following query against the ‘rental’ table:

SELECT inventory_id, customer_id FROM rental WHERE rental_date='2005-05-24 22:53:30'\G

Please keep in mind the definition of the index we’ll be using:

  UNIQUE KEY `rental_date` (`rental_date`,`inventory_id`,`customer_id`),

Therefore each leaf page will contain data for ‘rental_date’, ‘inventory_id’ and ‘customer_id’ columns. Our query asks only for data which is available in the index page therefore it’s not needed to perform any further lookup. This is especially important given how InnoDB handles secondary indexes - if a query is covered by a secondary index, no additional PK lookup is needed.

B-Tree indexes have also some limitations. For starters, a query has to use the leftmost prefix of the index. We can’t use the ‘rental_date’ key to look only for `inventory_id` and `customer_id` columns. You cannot use it to look for ‘rental_date’ and ‘customer_id’ columns either - they do not form a continuous prefix. The index will be used only for ‘rental_date’ condition.

FULLTEXT Indexes

This is a type of index that can be used for text lookups - they do not work by comparing values, it’s more like a keyword searching. We will not go into details here, what’s important is that FULLTEXT indexes are (since MySQL 5.6) available in InnoDB (and in MyISAM, as it used to be) and can’t be used for WHERE conditions - you should be using the MATCH AGAINST operator. You can have both B-Tree and FULLTEXT index on the same column, sometimes there are reasons to do that.

HASH Indexes

Hash indexes (user controlled) are used only in MEMORY engine and can be used for exact lookups. For each column a hash is calculated and then it’s used for lookups. Let’s say that a hash for value ‘mylongstring’ is ‘1234’. MySQL will store a hash value along with a pointer to the row. If you execute query like:

SELECT * FROM table WHERE my_indexed_column = 'mylongstring';

The WHERE condition will be hashed and as result will be ‘1234’, the index will point to the correct row. Main advantage of HASH index is the fact that hashes can be much smaller than the indexed value itself. Main problem, though, is that this index type can’t be used to anything else than a simple lookup. You cannot use index on (column1, column2) to cover query with only ‘column1’ in the WHERE clause. Hashes are not unique - collisions can happen and they will slow down the lookup as MySQL will have to check more than a single row per index lookup.

We mentioned that MEMORY engine use ‘user controlled’ hash indexes - this is because InnoDB can use hash indexes too. For the most frequently queried data InnoDB builds an internal hash index on top of the B-Tree indexes. This allows for quicker lookups in some cases. This mechanism is called ‘Adaptive Hash Index’ and is an internal, not user-configurable feature. Historically, under some workloads, it was a point of contention. Right now, in MySQL 5.6, we can either disable it completely or we can manage how many ‘partitions’ this index will have. The user cannot control what kind of data InnoDB is going to index in this way, though.

Indexing gotchas

Functions

Let’s look at some of the most known issues regarding indexing.

SELECT column1 FROM table WHERE LOWER(column2) = 'some value';

or the example from the Sakila database:

SELECT * FROM film WHERE LOWER(title)='academy dinosaur';

This query cannot use an index on the ‘title’ column. It’s because we have a function that does something with the column. In such case, MySQL cannot perform an index lookup and, as a result, it has to perform a table scan. We can see it in the EXPLAIN output (we’ll cover EXPLAIN in our next blog in the DBA series):

mysql> EXPLAIN select * from film where LOWER(title)='academy dinosaur'\G
*************************** 1. row ***************************
           id: 1
  select_type: SIMPLE
        table: film
         type: ALL
possible_keys: NULL
          key: NULL
      key_len: NULL
          ref: NULL
         rows: 1000
        Extra: Using where
1 row in set (0.00 sec)

As you can see, keys: NULL and possible_keys: NULL indicate that the MySQL optimizer did not find a suitable index for this query.

Let’s try another example:

mysql> EXPLAIN SELECT * FROM film WHERE title=UPPER('academy dinosaur')\G
*************************** 1. row ***************************
           id: 1
  select_type: SIMPLE
        table: film
         type: ref
possible_keys: idx_title
          key: idx_title
      key_len: 767
          ref: const
         rows: 1
        Extra: Using index condition
1 row in set (0.00 sec)

In this case, an index was used because the function has been used on the right side of the condition. As expected, idx_title was chosen for this query.

Different column types

MySQL may have problems in comparing different types of data and you need to be precise sometimes about what kind of data you are using in the query.

Let’s check another query in the film table:

mysql> EXPLAIN SELECT * FROM film WHERE title=12345\G
*************************** 1. row ***************************
           id: 1
  select_type: SIMPLE
        table: film
         type: ALL
possible_keys: idx_title
          key: NULL
      key_len: NULL
          ref: NULL
         rows: 1000
        Extra: Using where
1 row in set (0.00 sec)

As you can see, it’s doing a full table scan. This happened because we’re comparing VARCHAR column to the integer (12345). If we convert integer to string, an index will be used:

mysql> EXPLAIN SELECT * FROM film WHERE title='12345'\G
*************************** 1. row ***************************
           id: 1
  select_type: SIMPLE
        table: film
         type: ref
possible_keys: idx_title
          key: idx_title
      key_len: 767
          ref: const
         rows: 1
        Extra: Using index condition
1 row in set (0.00 sec)

Missing quotes may result in a heavy, not optimal query.

This was a brief introduction into how indexes work in MySQL. In the next post we are going to cover EXPLAIN - an important tool in dealing with query performance issues.

Blog category:

Webinar Replay & Slides: Become a MySQL DBA - Replication Topology Changes for MySQL and MariaDB

$
0
0

Thanks to everyone who joined us for our recent live webinar on ‘Replication Topology Changes for MySQL and MariaDB’ led by Krzysztof Książek, Senior Support Engineer at Severalnines. The replay and slides to the webinar are now available to watch and read online via the links below.

Watch the replay

Read the slides

TOPICS COVERED

  • MySQL Replication topology changes
    • using GTID
    • using regular replication
  • Failover process
  • Using MaxScale for automatic re-routing of queries
  • Other external tools useful when dealing with failover

SPEAKER

Krzysztof Książek, Senior Support Engineer at Severalnines, is a MySQL DBA with experience managing complex database environments for companies like Zendesk, Chegg, Pinterest and Flipboard. This webinar builds upon recent blog posts and related webinar series by Krzysztof on how to become a MySQL DBA.

For further blogs in this series visit: http://www.severalnines.com/blog-categories/db-ops

Blog category:

ClusterControl 1.2.11 Released

$
0
0

The Severalnines team is pleased to announce the release of ClusterControl 1.2.11

This release contains key new features, such as support for MariaDB’s MaxScale, along with performance improvements and bug fixes. This is also our best release yet for Postgres users, as outlined below.  

Join us for a release webinar on Tuesday, October 27th 2015, during which we will discuss the new features of this release as well as demonstrate them live.

Highlights of ClusterControl 1.2.11 include:

  • New for PostgreSQL
    • Deployment and Management of Postgres Replicated Setups
    • Customisable dashboards
    • Database performance charts for nodes
    • Enablement of ClusterControl DevStudio
  • Support for MaxScale
    • Deployment and management of MaxScale load balancer
  • New for MySQL
    • Add Existing HAProxy and Keepalived
    • Deployment of MySQL Replication setups
    • Improvements in charting of metrics
    • Revamped Configuration Management
    • New Database Logs Page
    • Revamped MySQL User Management

For additional details about the release:

Deployment and Management of Postgres Replication setups: It is now possible to create new Postgres replication clusters from ClusterControl, and view replication status from the Overview page.

Read the ClusterControl Changelog for all details on enhancements for PostgreSQL. 

Once a master is deployed, it is possible to add a replication slave.

Users can also create their own dashboards with statistics to chart. 

Support for MaxScale load balancer: We are excited to announce support for MaxScale, an open-source, SQL aware load balancer. Its ability to customize read/write splitting of SQL traffic can help address certain scaling issues in distributed database environments. It is now possible to deploy MaxScale instances from ClusterControl, and customize configurations - e.g. read/write split for a master-slave MySQL or MariaDB Replication setup. You can also send commands to ‘maxadmin’ directly from ClusterControl. 

Add existing HAProxy and Keepalived: ClusterControl can now manage and monitor existing running HAProxy and Keepalived instances that have been installed manually by the administrator. 

Deployment of MySQL Replication setups: It is now possible to deploy entire master-slave MySQL Replication setup from ClusterControl. One would start by creating a master:

Add then add a replication slave to the setup:

Realtime Replication status can be viewed from the dashboard. Master failover and slave promotion (for GTID based setups) can be handled from ClusterControl. 

Improvements in charting of metrics: The limit of being able to chart 8 DB stats has been removed. It is now possible to chart up to 20 stats, and arrange the charts in a layout with 2 or 3 columns.

Revamped configuration management: The configuration management module in ClusterControl has been rewritten. It helps you track and control the configuration of your cluster nodes, whether they be database nodes or load balancers. 

ClusterControl detects ongoing changes and stores them in its local repository. Changes can be persisted to database variables across one node or a group of nodes at once, dynamic variables are changed directly without a restart.

New Database Logs page: Browsing through the appropriate error logs is key element of the troubleshooting process. Users can now view a tree list of the DB nodes so it is possible to simply pick the nodes and view the corresponding MySQL error log.

Revamped MySQL User Management: We have removed the old implementation where users created from ClusterControl wre maintained separately. Users and privileges are now set directly and retrieved from the cluster so ClusterControl is always in sync with the managed databases. Users can be created across more than one cluster at once.  

There are a bunch of other improvements that we have not mentioned, including backups of individual schemas in MySQL/MariaDB based systems. All details can be found in the ChangeLog

Join us for a release webinar on Tuesday, October 27th 2015, during which we will discuss the new features of this release as well as demonstrate them live.

We encourage you to provide feedback and testing. If you’d like a demo, feel free to request one

With over 7,000 users to date, ClusterControl is the leading, platform independent automation and management solution for MySQL, MariaDB, MongoDB and PostgreSQL. 

Thank you for your ongoing support, and happy clustering!

For additional tips & tricks, follow our blog: http://www.severalnines.com/blog/

Blog category:

How to Deploy and Manage MaxScale using ClusterControl

$
0
0

We were delighted to announce that ClusterControl now supports MaxScale, the intelligent database gateway from the MariaDB team. In this blog, we will show you how to deploy and manage MaxScale from ClusterControl. We previously blogged about MaxScale, read it if you’d like a quick overview and introduction. We also published a quick benchmark of HAProxy vs MaxScale.

How to install MaxScale from ClusterControl

Assume you have a Galera Cluster currently managed by ClusterControl. As next step you want to install MaxScale as load balancer. From the ClusterControl UI, go to Manage > Load Balancer > Install MaxScale. You’ll be presented with following dialog box. 

Please make sure you have chosen ‘Create MaxScale Instance’. We’ll discuss the “MariaDB Repository URL” further down in this blog. The remaining options are pretty clear: 

  • choose or type in the IP address of the node where MaxScale will be installed. ClusterControl has to be able to ssh in a passwordless fashion to this host. 
  • username and password  - it will be used to access MaxScale’s administration interface.
  • next is another username/password - this time, it is a MariaDB/MySQL user that will be used by MaxScale to access and monitor the MariaDB/MySQL nodes in your infrastructure.

Below that you can set couple of configuration settings for MaxScale:

  • how many threads it is allowed to use 
  • which ports should be used for different services. Currently, MaxScale deployed by ClusterControl comes with a CLI service and Debug service - those are standard services available for MaxScale. We also create two ‘production’ services - ‘RW’, which implements a read-write split and ‘RR’ which implements round-robin access to all of the nodes in the cluster. Each of those services have a port assigned to it - you can change it at the deploy stage.

At the bottom of the dialog box, you’ll see your nodes with checkboxes - you can pick those that will be included in the proxy’s configuration.

Let’s get back to the repository URL. Once you click on the tooltip, you’ll see the following screen:

MariaDB introduced individual links to the repository where MaxScale is stored. To get your link, you should log into the MariaDB Enterprise Portal and generate one for yourself. Once you have it, you can paste it in the MariaDB Repository URL box. This concludes the preparations for deployment, you can now click on the ‘Install MaxScale’ button and wait for the process to complete.

You can monitor the progress in ClusterControl > Logs > Jobs. When it finishes, it prints some examples covering how you can connect to your MaxScale instance. For better security you should delete this job by clicking the ‘Delete’ button above it.

How to add an existing MaxScale instance to ClusterControl?

If you already have MaxScale installed in your setup, you can easily add it to ClusterControl to benefit from health monitoring and access to MaxAdmin - MaxScale’s CLI from the same interface you use to manage the database nodes. 
The only requirement is to have passwordless SSH configured between ClusterControl node and host where MaxScale is running. Once you have SSH set up, you can go to Manage > Load Balancer > Install MaxScale. Once you are there, ensure you have chosen ‘Add Existing MaxScale’. You’ll be then presented with a following screen:

The only data you need to pass here is IP of the MaxScale server and port for the MaxScale CLI. After clicking ‘Install MaxScale’, it will be added to the list of processes monitored by ClusterControl.

How to uninstall MaxScale from ClusterControl?

If, for some reason, you would like to uninstall MaxScale, go to the ‘Nodes’ tab and then click on the ‘-’ icon next to the MaxScale node. You’ll be asked if you want to remove the node. If you click yes, MaxScale will be uninstalled from the node you’ve just chosen.

How to access MaxScale MaxAdmin commands?

MaxAdmin is a command line interface available with MaxScale that allows extensive health checks, user management, status and control of MaxScale operations. ClusterControl gives you direct access to the MaxAdmin commands. You can reach it by going to ‘Nodes’ tab and then clicking on your MaxScale node. Once you do that, you’ll be presented with the following screenshot:

You can see the status of the node, and stop the instance if needed. In the user/password boxes, you need to enter MaxScale’s administrative user credentials - this is what you put in the Admin username/password fields where installing MaxScale. If you added an existing MaxScale installation, please use here any administrative user that you created. By default (if you do not provide any input) ClusterControl will try to use the default username and password created during the MaxScale installation (admin/mariadb).

The drop down box contains a predefined set of commands that you can execute by just picking them from the list and then clicking on the ‘Execute’ button. For a full list of commands, you can execute the ‘help’ command.

Results are presented in a console window:

You can clear it at any time by using ‘Reset Console’ button.

Please keep in mind that some of the commands require additional parameters. For example, the ‘show server’ command requires you to pass a server name as a parameter. You can do so by just editing the dropdown box and typing in the parameter:

As we mentioned before, you are not limited to the predefined commands - you can type anything you like in the command box. For example, we can stop and then start one of the services:

CLI access from ClusterControl talks directly to the MaxAdmin, therefore you can use ClusterControl to execute everything that you are able to run using the MaxAdmin CLI client.

Have fun with MaxScale!

Blog category:

Live webinar on ClusterControl 1.2.11: features support for MariaDB’s MaxScale and is our best PostgreSQL release yet!

$
0
0

Join us for this live webinar on Tuesday, October 27th, led by our colleague Art van Scheppingen, Senior Support Engineer at Severalnines. Art recently joined us from Spil Games in Amsterdam, where he was Head of Database Engineering. He’ll be discussing and demonstrating the new release of ClusterControl and will be available for questions on its new features.

Register here for Asia PAC / Europe MEA timezones

Register here for Latin AMER / North AMER timezones

This is our best release yet for Postgres users and we’re also introducing key new features for our MySQL / MariaDB users, such as support for MaxScale, an open-source, database-centric proxy that works with MariaDB Enterprise, MariaDB Enterprise Cluster, MariaDB 5.5, MariaDB 10 and Oracle MySQL. The release further includes a range of performance improvements and bug fixes. 

Some of the highlights of ClusterControl 1.2.11 include: 

  • For PostgreSQL
    • Deployment and Management of Postgres Replicated Setups
    • Customisable dashboards
    • Database performance charts for nodes
    • Enablement of ClusterControl DevStudio
  • Support for MaxScale
    • Deployment and management of MaxScale load balancer
  • For MySQL
    • Add Existing HAProxy and Keepalived
    • Deployment of MySQL Replication setups
    • Improvements in charting of metrics
    • Revamped Configuration Management
    • New Database Logs Page
    • Revamped MySQL User Management


Full details of the release:

We encourage you to provide feedback on your testing. And if you’d like a demo, feel free to request one.

Thank you for your ongoing support, and we look forward to seeing you at the webinar!

Blog category:

Become a MySQL DBA blog series - Using Explain to improve SQL Queries

$
0
0

When it comes to the query tuning, EXPLAIN is one the most important tool in the DBA’s arsenal. Why is a given query slow, what does the execution plan look like, how will JOINs be processed, is the query using the correct indexes, or is it creating a temporary table? In this blog post, we’ll look at the EXPLAIN command and see how it can help us answer these questions.

This is the thirteenth installment in the ‘Become a MySQL DBA’ blog series. Our previous posts in the DBA series include Database Indexing, Deep Dive pt-query-digest, Analyzing SQL Workload with pt-query-digest, Query Tuning Process, Configuration Tuning, Live Migration using MySQL Replication, Database Upgrades, Replication Topology Changes, Schema Changes, High Availability, Backup & Restore, Monitoring & Trending.

Simple query EXPLAINed

We’d like to start with a simple example of EXPLAIN statement to get an understanding of the kind of data it provides us with. Let’s take a look at this simple query to the ‘Sakila’ database:

mysql> EXPLAIN SELECT inventory_id, customer_id FROM rental WHERE rental_date='2005-05-24 22:53:30'\G
*************************** 1. row ***************************
           id: 1
  select_type: SIMPLE
        table: rental
         type: ref
possible_keys: rental_date
          key: rental_date
      key_len: 5
          ref: const
         rows: 1
        Extra: Using index
1 row in set (0.00 sec)

We have a simple query to the ‘rental’ table which should return some information about rentals that happened at a given point in time. ‘select_type’ is SIMPLE which means this is not a UNION nor subquery. Next bit of the information is the table which is queried - ‘rental’ table, as expected. Next column, ‘type’, this is an information about join type. It’s more like an info about how rows will be accessed. In our case it’s ‘ref’, which means that it can be multiple matching rows and access will be done through an index.

There are multiple join types and you can find detailed information about them in the MySQL documentation, we’d still like to mention some of the most popular ones.

eq_ref- rows will be accessed using an index, one row is read from the table for each combination of rows from the previous tables. This basically means that we are talking about UNIQUE or PRIMARY keys.

ref- as discussed, multiple rows can be accessed for a given value so we are using standard, non-unique index to retrieve them.

index_merge - rows are accessed through the index merge algorithm. Multiple indexes are used to locate matching rows. This is actually the only case where MySQL can utilize multiple indexes per query.

range - only rows from a given range are being accessed, index is used to select them.

index - full index scan is performed. It can be either a result of the use of a covering index or an index can be used to retrieve rows in a sorted order.

ALL - full table scan is performed

The next two columns in the EXPLAIN output, ‘possible_keys’ and ‘key’ tells us about indexes which could be used for the particular query and the index chosen by the optimizer as the most efficient one.

‘key_len’ tells about the length of the index (or a prefix of an index) that was chosen to be used in the query.

‘ref’ column tells us which columns or constants are compared to the index picked by the optimizer. In our case this is ‘const’ as we are using a constant in the WHERE clause. This can be another column, for example in the case of a join. You can also see ‘func’ when we are comparing a result of some function.

‘rows’ gives us an estimate of how many rows the query will scan, this estimate is based on the index statistics from the storage engine therefore it may not be precise. Most of the time, though, it’s good enough to give a DBA some insight into how heavy the query is.

Final column, ‘Extra’, prints additional information relevant to how the query is going to be executed. You can see here information about different optimizations that will be applied to the query (using MRR, or index for group by or many others), information if a temporary table is going to be created and lots of other data. More information in the MySQL documentation so we encourage you to have this page somewhere near and refer to it when you’ll see something not clear in the EXPLAIN output.

In our case we can see ‘Using index’ which means that a covering index has been used for this query. It was possible because ‘rental_date’ index definition covers all the columns involved in our query:

  UNIQUE KEY `rental_date` (`rental_date`,`inventory_id`,`customer_id`),


JOINs

Let’s see what the EXPLAIN output of more complex query looks like. We’ll try to find all films released in the year of 2006 where the actor with a last name of ‘MIRINDA’ starred.

mysql> EXPLAIN SELECT title, description FROM film AS f JOIN film_actor AS fa ON f.film_id = fa.film_id JOIN actor AS a ON fa.actor_id = a.actor_id WHERE a.last_name = 'MIRANDA' AND f.release_year = 2006\G
*************************** 1. row ***************************
           id: 1
  select_type: SIMPLE
        table: a
         type: ref
possible_keys: PRIMARY,idx_actor_last_name
          key: idx_actor_last_name
      key_len: 137
          ref: const
         rows: 1
        Extra: Using where; Using index
*************************** 2. row ***************************
           id: 1
  select_type: SIMPLE
        table: fa
         type: ref
possible_keys: PRIMARY,idx_fk_film_id
          key: PRIMARY
      key_len: 2
          ref: sakila.a.actor_id
         rows: 13
        Extra: Using index
*************************** 3. row ***************************
           id: 1
  select_type: SIMPLE
        table: f
         type: eq_ref
possible_keys: PRIMARY
          key: PRIMARY
      key_len: 2
          ref: sakila.fa.film_id
         rows: 1
        Extra: Using where
3 rows in set (0.00 sec)

Output is longer, we can see that three tables are involved in the query. As you can see, EXPLAIN refers to them using aliases defined in a query.

By looking at the output we can see that the optimizer decided to start with the ‘actor’ table, using ‘idx_actor_last_name’ index to search for the correct last name. As a next step, ‘film_actor’ table was joined. PK was used to identify rows and as a reference sakila.a.actor_id column was used. Finally, ‘film’ table was joined, again using primary key. As you can see, join type was ‘eq_ref’ which means that for every row in the ‘film_actor’ table, only a single row in the ‘film’ table was queried.

By looking at this query execution plan, we can tell it is pretty optimal. Lot’s of PK are involved, not that many rows are estimated to be accessed. Please keep in mind that, in joins, we need to multiply rows accessed on every step to get the total number of combinations - here we have 1 x 13 x 1 = 13 rows. This is pretty important as, when joining multiple tables, you can easily end up scanning billions of rows if your joins are not indexed properly. Obviously, an unoptimized join query will not work as expected and it may cause significant impact on the system.

Partitions

Partitions are great tool to manage large amounts of data. If we partition our table using temporal columns, we can easily rotate old data away and keep the recent data close together for better performance and lower fragmentation. Partitions can also be used to speed up queries - this process is called partition pruning. As long as we have in a WHERE clause the column which is used to partition a table, it may be possible to use that condition to access only relevant partitions. Let’s look at an example to illustrate this.

This time we are going to use an ‘employees’ database. We want to find first and last name of employees who had a title of ‘Technique Leader’ between ‘1994-10-31’ and ‘1996-03-31’.

Definition of table ‘title’ looks as follows.

mysql> SHOW CREATE TABLE titles\G
*************************** 1. row ***************************
       Table: titles
Create Table: CREATE TABLE `titles` (
  `emp_no` int(11) NOT NULL,
  `title` varchar(50) NOT NULL,
  `from_date` date NOT NULL,
  `to_date` date DEFAULT NULL,
  PRIMARY KEY (`emp_no`,`title`,`from_date`)
) ENGINE=InnoDB DEFAULT CHARSET=latin1
/*!50500 PARTITION BY RANGE  COLUMNS(from_date)
(PARTITION p01 VALUES LESS THAN ('1985-12-31') ENGINE = InnoDB,
 PARTITION p02 VALUES LESS THAN ('1986-12-31') ENGINE = InnoDB,
 PARTITION p03 VALUES LESS THAN ('1987-12-31') ENGINE = InnoDB,
 PARTITION p04 VALUES LESS THAN ('1988-12-31') ENGINE = InnoDB,
 PARTITION p05 VALUES LESS THAN ('1989-12-31') ENGINE = InnoDB,
 PARTITION p06 VALUES LESS THAN ('1990-12-31') ENGINE = InnoDB,
 PARTITION p07 VALUES LESS THAN ('1991-12-31') ENGINE = InnoDB,
 PARTITION p08 VALUES LESS THAN ('1992-12-31') ENGINE = InnoDB,
 PARTITION p09 VALUES LESS THAN ('1993-12-31') ENGINE = InnoDB,
 PARTITION p10 VALUES LESS THAN ('1994-12-31') ENGINE = InnoDB,
 PARTITION p11 VALUES LESS THAN ('1995-12-31') ENGINE = InnoDB,
 PARTITION p12 VALUES LESS THAN ('1996-12-31') ENGINE = InnoDB,
 PARTITION p13 VALUES LESS THAN ('1997-12-31') ENGINE = InnoDB,
 PARTITION p14 VALUES LESS THAN ('1998-12-31') ENGINE = InnoDB,
 PARTITION p15 VALUES LESS THAN ('1999-12-31') ENGINE = InnoDB,
 PARTITION p16 VALUES LESS THAN ('2000-12-31') ENGINE = InnoDB,
 PARTITION p17 VALUES LESS THAN ('2001-12-31') ENGINE = InnoDB,
 PARTITION p18 VALUES LESS THAN ('2002-12-31') ENGINE = InnoDB,
 PARTITION p19 VALUES LESS THAN (MAXVALUE) ENGINE = InnoDB) */
1 row in set (0.00 sec)

Please note that we have a lot of partitions created using ‘from_date’ column. To see how we can leverage partitioning to speed up queries, we can use ‘PARTITIONS’ clause in EXPLAIN:

mysql> EXPLAIN PARTITIONS SELECT e.first_name, e.last_name FROM employees AS e JOIN titles AS t ON e.emp_no = t.emp_no WHERE from_date > '1994-10-31' AND from_date < '1996-03-31' AND t.title='Technique Leader'\G
*************************** 1. row ***************************
           id: 1
  select_type: SIMPLE
        table: t
   partitions: p10,p11,p12
         type: index
possible_keys: PRIMARY
          key: PRIMARY
      key_len: 59
          ref: NULL
         rows: 99697
        Extra: Using where; Using index
*************************** 2. row ***************************
           id: 1
  select_type: SIMPLE
        table: e
   partitions: NULL
         type: eq_ref
possible_keys: PRIMARY
          key: PRIMARY
      key_len: 4
          ref: employees.t.emp_no
         rows: 1
        Extra: NULL
2 rows in set (0.00 sec)

As you can see, one new column (‘partitions’) was added. It contains values ‘p10,p11,p12’. This means that optimizer, based on the WHERE condition, decided that relevant data is located only in those partitions. Others won’t be accessed. Given the ‘type: index’, the table will be scanned using PRIMARY key to locate matching rows. As a next step, WHERE condition will be applied to locate rows with title='Technique Leader'. Finally, ‘employees’ table will be joined using it’s PK.


EXPLAIN EXTENDED

A query, before being executed, is parsed by the optimizer. This can involve some optimizations and query rewriting. To see what exactly will be executed we can use EXPLAIN EXTENDED followed by ‘SHOW WARNINGS’. Let’s take a look at a couple of examples. First, a simple one:

mysql> EXPLAIN EXTENDED SELECT hire_date FROM employees AS e JOIN salaries AS t USING(emp_no) WHERE salary < 1000+20*100\G
*************************** 1. row ***************************
           id: 1
  select_type: SIMPLE
        table: e
         type: ALL
possible_keys: PRIMARY
          key: NULL
      key_len: NULL
          ref: NULL
         rows: 299423
     filtered: 100.00
        Extra: NULL
*************************** 2. row ***************************
           id: 1
  select_type: SIMPLE
        table: t
         type: ref
possible_keys: PRIMARY
          key: PRIMARY
      key_len: 4
          ref: employees.e.emp_no
         rows: 1
     filtered: 100.00
        Extra: Using where
2 rows in set, 1 warning (0.00 sec)

mysql> SHOW WARNINGS\G
*************************** 1. row ***************************
  Level: Note
   Code: 1003
Message: /* select#1 */ select `employees`.`e`.`hire_date` AS `hire_date` from `employees`.`employees` `e` join `employees`.`salaries` `t` where ((`employees`.`t`.`emp_no` = `employees`.`e`.`emp_no`) and (`employees`.`t`.`salary` < <cache>((1000 + (20 * 100)))))

The most important part here is the fact that MySQL does not calculate our salary value all the time - it’s a constant so it can be cached. Additionally, as you may have noticed, we used USING(emp_no) in our JOIN, it was rewritten to WHERE condition which will give us the same result.

Another, more complex example. Please disregard the query itself as it doesn’t have much sense, we want here a query which will show us some additional data in the ‘Warnings’ part:

mysql> EXPLAIN EXTENDED SELECT e.first_name, e.last_name, gender IN (SELECT gender FROM employees e1 WHERE e1.emp_no = 10012 ) FROM employees AS e JOIN titles AS t ON e.emp_no = t.emp_no WHERE from_date > '1994-10-31' AND from_date < '1996-03-31' AND t.title='Technique Leader'\G
*************************** 1. row ***************************
           id: 1
  select_type: PRIMARY
        table: t
         type: index
possible_keys: PRIMARY
          key: PRIMARY
      key_len: 59
          ref: NULL
         rows: 99697
     filtered: 75.00
        Extra: Using where; Using index
*************************** 2. row ***************************
           id: 1
  select_type: PRIMARY
        table: e
         type: eq_ref
possible_keys: PRIMARY
          key: PRIMARY
      key_len: 4
          ref: employees.t.emp_no
         rows: 1
     filtered: 100.00
        Extra: NULL
*************************** 3. row ***************************
           id: 2
  select_type: SUBQUERY
        table: e1
         type: const
possible_keys: PRIMARY
          key: PRIMARY
      key_len: 4
          ref: const
         rows: 1
     filtered: 100.00
        Extra: NULL
3 rows in set, 1 warning (0.00 sec)

mysql> SHOW WARNINGS\G
*************************** 1. row ***************************
  Level: Note
   Code: 1003
Message: /* select#1 */ select `employees`.`e`.`first_name` AS `first_name`,`employees`.`e`.`last_name` AS `last_name`,<in_optimizer>(`employees`.`e`.`gender`,`employees`.`e`.`gender` in ( <materialize> (/* select#2 */ select 'M' from `employees`.`employees` `e1` where 1 ), <primary_index_lookup>(`employees`.`e`.`gender` in <temporary table> on <auto_key> where ((`employees`.`e`.`gender` = `materialized-subquery`.`gender`))))) AS `gender IN (SELECT gender FROM employees e1 WHERE e1.emp_no = 10012 )` from `employees`.`employees` `e` join `employees`.`titles` `t` where ((`employees`.`e`.`emp_no` = `employees`.`t`.`emp_no`) and (`employees`.`t`.`title` = 'Technique Leader') and (`employees`.`t`.`from_date` > '1994-10-31') and (`employees`.`t`.`from_date` < '1996-03-31'))
1 row in set (0.00 sec)

Here, the most interesting part is the one regarding subquery:

<in_optimizer>(`employees`.`e`.`gender`,`employees`.`e`.`gender` in ( <materialize> (/* select#2 */ select 'M' from `employees`.`employees` `e1` where 1 ), <primary_index_lookup>(`employees`.`e`.`gender` in <temporary table> on <auto_key> where ((`employees`.`e`.`gender` = `materialized-subquery`.`gender`))))) AS `gender

As can be seen, optimizer detected IN() subquery and ‘in_optimizer’ kicked in. SELECT gender FROM employees e1 WHERE e1.emp_no = 10012 is an independent subquery therefore an obvious step was to make it a constant - but this is not exactly how the optimizer intends to execute this query. Instead it plans to materialize it (create a temporary table) and then join it to the rest of the tables using an automatically created index.


EXPLAIN FORMAT=JSON

Last but not least, EXPLAIN in MySQL 5.6 gives you the nice ability to print the query execution time in JSON format. This is great for any developer who wants to build some tools that will generate a visual representation of the execution plan. It’s also nice for DBA’s as it gives us some additional information about the plan. For example, please note that in the last example in the previous chapter, you didn’t see any information about subquery materialization in the EXPLAIN output - we had to check the additional output from SHOW WARNINGS. Let’s see what we can get if we run EXPLAIN in JSON format:

mysql> EXPLAIN FORMAT=JSON SELECT e.first_name, e.last_name, gender IN (SELECT gender FROM employees e1 WHERE e1.emp_no = 10012 ) FROM employees AS e JOIN titles AS t ON e.emp_no = t.emp_no WHERE from_date > '1994-10-31' AND from_date < '1996-03-31' AND t.title='Technique Leader'\G
*************************** 1. row ***************************
EXPLAIN: {
  "query_block": {
    "select_id": 1,
    "nested_loop": [
      {
        "table": {
          "table_name": "t",
          "partitions": [
            "p10",
            "p11",
            "p12"
          ],
          "access_type": "index",
          "possible_keys": [
            "PRIMARY"
          ],
          "key": "PRIMARY",
          "used_key_parts": [
            "emp_no",
            "title",
            "from_date"
          ],
          "key_length": "59",
          "rows": 99697,
          "filtered": 75,
          "using_index": true,
          "attached_condition": "((`employees`.`t`.`title` = 'Technique Leader') and (`employees`.`t`.`from_date` > '1994-10-31') and (`employees`.`t`.`from_date` < '1996-03-31'))"
        }
      },
      {
        "table": {
          "table_name": "e",
          "access_type": "eq_ref",
          "possible_keys": [
            "PRIMARY"
          ],
          "key": "PRIMARY",
          "used_key_parts": [
            "emp_no"
          ],
          "key_length": "4",
          "ref": [
            "employees.t.emp_no"
          ],
          "rows": 1,
          "filtered": 100
        }
      }
    ],
    "select_list_subqueries": [
      {
        "table": {
          "table_name": "<materialized_subquery>",
          "access_type": "eq_ref",
          "key": "<auto_key>",
          "key_length": "1",
          "rows": 1,
          "materialized_from_subquery": {
            "using_temporary_table": true,
            "dependent": true,
            "cacheable": false,
            "query_block": {
              "select_id": 2,
              "table": {
                "table_name": "e1",
                "access_type": "const",
                "possible_keys": [
                  "PRIMARY"
                ],
                "key": "PRIMARY",
                "used_key_parts": [
                  "emp_no"
                ],
                "key_length": "4",
                "ref": [
                  "const"
                ],
                "rows": 1,
                "filtered": 100
              }
            }
          }
        }
      }
    ]
  }
}
1 row in set, 1 warning (0.00 sec)

There’s a lot of new data. For starters, we can see useful information in ‘used_key_parts’ section. Instead of guessing which parts of the composite index were used in the query, we have a nice list presented in the explain’s output. We have also precise information about what’s going on with the subquery in SELECT’s list. Let’s go over it step by step.

"select_list_subqueries": [
      {
        "table": {
          "table_name": "<materialized_subquery>",
          "access_type": "eq_ref",
          "key": "<auto_key>",
          "key_length": "1",
          "rows": 1,

We see it’s a materialized subquery and a single row will be accessed from it for every row in the outer query. We see that an index was automatically created and the table will contain a single row.

"materialized_from_subquery": {
            "using_temporary_table": true,
            "dependent": true,
            "cacheable": false,

This is the interesting part - a subquery was materialized using temporary table and the optimizer decided it’s a dependent subquery - something which is not exactly true. If a query is dependent on the outer query, it can’t be cached as a constant and a materialized table needs to be joined to the outer query. It’s much better than executing the subquery every time but it does not look ideal. On the other hand, it can be as optimal as using a constant, it depends on how MySQL handles constant values - it could as well put them into temp tables which basically would be exactly the same what it does now. The answer to this question would require checking source code.

"query_block": {
              "select_id": 2,
              "table": {
                "table_name": "e1",
                "access_type": "const",
                "possible_keys": [
                  "PRIMARY"
                ],
                "key": "PRIMARY",
                "used_key_parts": [
                  "emp_no"
                ],
                "key_length": "4",
                "ref": [
                  "const"
                ],
                "rows": 1,
                "filtered": 100

The rest of the data contains information about how the materialized subquery was created - e1 table (employees) was queried using PK lookup, a single row was returned.

We need to comment on the ‘filtered’ column which can be seen across this blog post - for now, please disregard it. It will tell us about the number of rows that should be filtered by a given table condition. This will be an estimate only and it is available in MySQL 5.7. In 5.6, the data is not really reliable.

EXPLAIN is really a great tool which can help you to understand your queries. It may look complex (and it is definitely not easy to master), but the time you spend trying to solve its mysteries will be of great benefit for you. In the end, faster, better optimized queries means happier MySQL :-) 

In the next post in the series we are going to look into how we can impact optimizer’s decisions and generate more efficient query execution plans.

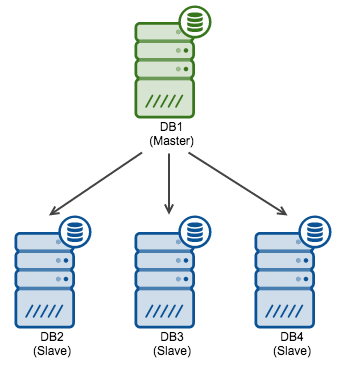
Blog category:


Severalnines’ Vinay Joosery named UK top 50 data leader & influencer

$
0
0

Information Age today unveiled the inaugural list of the UK’s top 50 data leaders and influencers

“Very strong on product and technical development of open-source databases, Vinay has helped global and UK businesses like BT, AutoTrader Group and Ping Identity to scale, manage and develop (data) cloud operations.” - as just announced by Information Age.

Congratulations to all the nominees and thanks to the selection committee at Information Age for this distinction!

Vinay is a passionate advocate of open source databases for mission-critical business. Prior to co-founding Severalnines, Vinay served as VP EMEA at Pentaho Corporation and held senior management roles at MySQL / Sun Microsystems / Oracle and Ericsson.

As our CEO, Vinay steers all aspects of the company from product development, support, marketing and sales through to ensuring that everyone has a seat at the table when we’re out for a company get together. 

vinay_new.png

First and foremost though, Vinay is a customer champion at Severalnines and they’re happy to say so: 

“Vinay Joosery and his Severalnines team were superb on giving us advice on how to maximise the potential of ClusterControl and our database platforms. My team can now spend more time on creating and delivering innovative customer services.” said our UK customer BT Expedite in a recent interview.

As a company, our aim is to help companies build smart database infrastructure for mission-critical business, while benefiting from open source economics. We’re excited to see our accomplishments recognised by industry experts and peers via Vinay’s nomination as a data leader and influencer in the UK. 

Here’s to further success and content customers! Happy Severalnines clustering to all!

Blog category:

Become a MySQL DBA blog series - Optimizer Hints for faster query execution

$
0
0

MySQL uses a cost-based optimizer to determine the best way to execute a query. It usually does a great job, but not all the time. There are different reasons for that. In some cases, it might not have enough information about the data and plan queries in a non-optimal way.  

The optimizer makes decisions based on statistics and some fixed costs per operation, but it does not understand the differences in hardware. For instance, disk access may have different costs depending on the type of storage used - SSD drives will have quicker access times than spindles, and can perform more operations in a given time. 

However, it is possible to impact how a query will be executed, and this is the topic of today’s blog. 

(Note that in MySQL 5.7, a lot of work has been done in order to improve this - users can modify the cost of different types of operations.)

This is the fourteenth installment in the ‘Become a MySQL DBA’ blog series. Our previous posts in the DBA series include Using EXPLAIN to improve SQL Queries, Database Indexing, Deep Dive pt-query-digest, Analyzing SQL Workload with pt-query-digest, Query Tuning Process, Configuration Tuning,  Live Migration using MySQL Replication, Database Upgrades, Replication Topology Changes, Schema Changes, High Availability, Backup & Restore, Monitoring & Trending.

Index statistics

One of the ways we can influence the way a query is going to be executed is by using index hints. The optimizer makes decisions about the best index for a query, and this is based on index statistics provided to it by the InnoDB engine. Let’s first see how InnoDB statistics work and how we can change it.

Historically index statistics were recalculated from time to time. It happened when someone explicitly executed ANALYZE TABLE or at the first time table was opened. But it also happened when SHOW TABLE STATUS, SHOW TABLES or SHOW INDEX were executed. In addition to this, table statistics were updated when either 1/16th or 2 billion rows were modified in a table. This introduced a bit of instability. To calculate statistics, InnoDB performs a lookup into 8 (yes, eight!) index pages. This is 128k of data to calculate stats for, let’s say, 100G index. In one way, this makes sense - the more index lookups you make, the longer it takes to update index statistics and more I/O is needed for this - not something you’d like to see. On the other hand, it’s rather obvious that such a small sample may introduce large variations in the final result. Changes in InnoDB statistics, though, impact query execution plans. It is possible to change this setting by changing innodb_stats_sample_pages to get a bit more stable and ‘closer to reality’ statistics - but it comes at the price of more I/O.
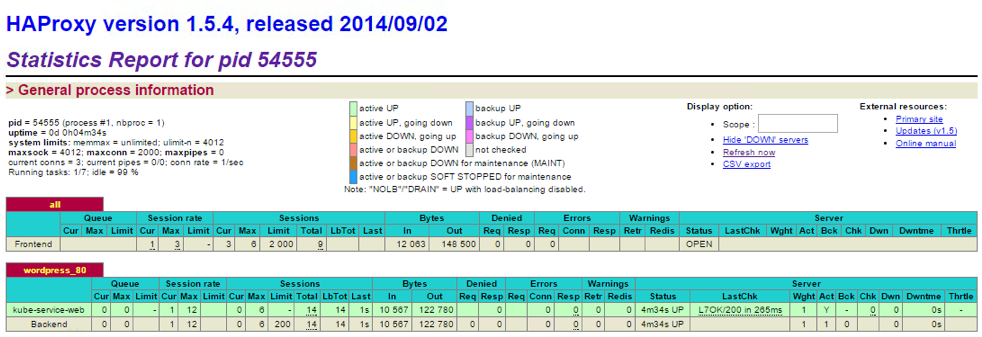
Since MySQL 5.6.6, InnoDB statistics can be (and this is a default setting) persistent. Statistics are not recalculated for every SHOW TABLE STATUS and similar commands. They are updated when an explicit ANALYZE TABLE is run on the table or more than 10% of rows in the table were modified. This threshold can be modified using innodb_stats_auto_recalc variable.

When persistent statistics are enabled, InnoDB performs a lookup on 20 index pages to calculate them. It’s a bit more than what we had before. Stats are not calculated that often, though and the impact of additional I/O when collecting them is not that high. Query plans should also be more stable because the underlying stats are more stable than before. Again, it is possible to alter this default setting by changing the innodb_stats_persistent_sample_pages variable.

It is possible to disable persistent stats and revert back to the old behavior by disabling innodb_stats_persistent - in some corner cases, this may be the best option.

Index hints

As we now know, index statistics are just an estimate. It may happen that a query execution plan is not optimal or (even worse) it’s flapping between several versions. This is serious as it causes unstable performance.

Luckily, MySQL gives us the ability to amend query execution plans when we find them not suitable for our queries. Let’s see how we can do it.
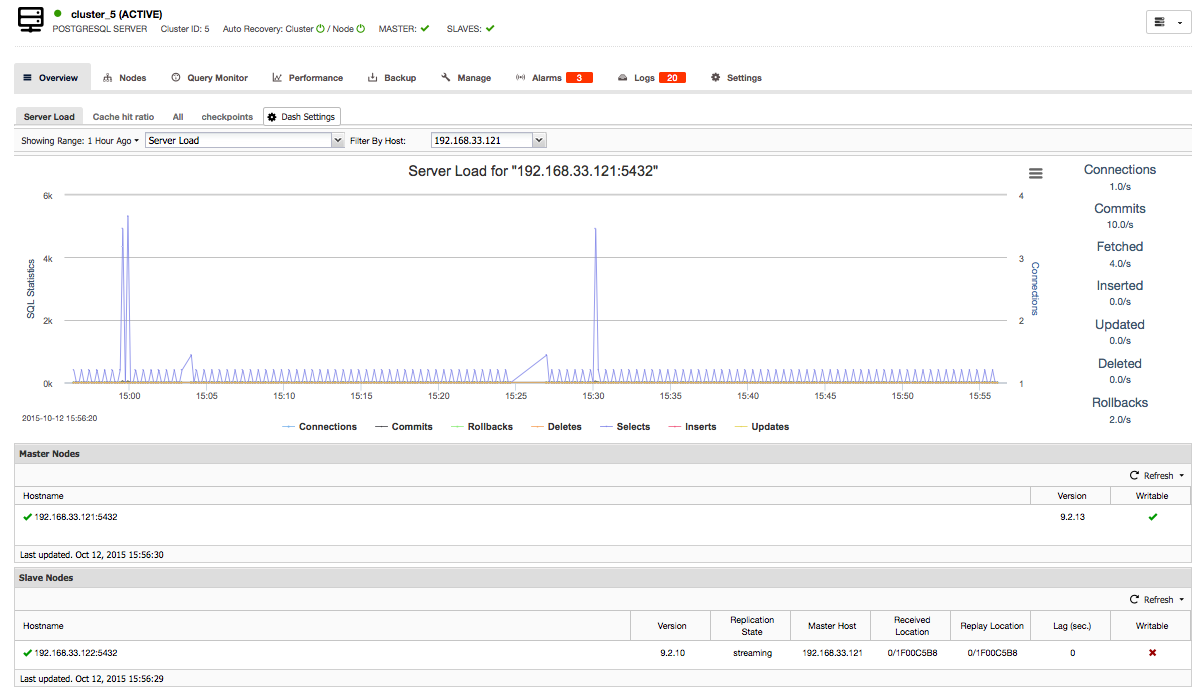
In this example we’ll be using ‘sakila’ schema. Assume the following query execution plan:

mysql> EXPLAIN SELECT inventory_id FROM rental WHERE rental_date > '2005-05-24 00:00:00' AND rental_date < '2005-05-28 00:00:00' AND customer_id IN (234, 123, 412, 23)\G
*************************** 1. row ***************************
           id: 1
  select_type: SIMPLE
        table: rental
         type: range
possible_keys: rental_date,idx_fk_customer_id
          key: rental_date
      key_len: 5
          ref: NULL
         rows: 483
        Extra: Using where; Using index
1 row in set (0.00 sec)

Here, we want to find the inventory_id of rentals done by some customers in some time period. The optimizer has two options when it comes to indexes - it can use rental_date key or idx_fk_customer_id. It has chosen rental_date to perform a range scan on it. Very likely it was motivated by the fact that it’s also covering index in this particular case. 

Let’s say we don’t really want to do more I/O than we have to and we want to use index on ‘customer_id’ column to perform index lookups. Please keep in mind this change will also change the access pattern for I/O operations - instead of index scan + covering index (this is a sequential access) we’ll be performing random reads. Such change may not be ideal for spindles. SSD’s won’t notice it, though. We can enforce our choice on the optimizer by executing one of following queries:

mysql> EXPLAIN SELECT inventory_id FROM rental FORCE INDEX(idx_fk_customer_id) WHERE rental_date > '2005-05-24 00:00:00' AND rental_date < '2005-05-28 00:00:00' AND customer_id IN (234, 123, 412, 23)\G
*************************** 1. row ***************************
           id: 1
  select_type: SIMPLE
        table: rental
         type: range
possible_keys: idx_fk_customer_id
          key: idx_fk_customer_id
      key_len: 2
          ref: NULL
         rows: 101
        Extra: Using index condition; Using where
1 row in set (0.00 sec)

mysql> EXPLAIN SELECT inventory_id FROM rental USE INDEX(idx_fk_customer_id) WHERE rental_date > '2005-05-24 00:00:00' AND rental_date < '2005-05-28 00:00:00' AND customer_id IN (234, 123, 412, 23)\G
*************************** 1. row ***************************
           id: 1
  select_type: SIMPLE
        table: rental
         type: range
possible_keys: idx_fk_customer_id
          key: idx_fk_customer_id
      key_len: 2
          ref: NULL
         rows: 101
        Extra: Using index condition; Using where
1 row in set (0.00 sec)

mysql> EXPLAIN SELECT inventory_id FROM rental IGNORE INDEX(rental_date) WHERE rental_date > '2005-05-24 00:00:00' AND rental_date < '2005-05-28 00:00:00' AND customer_id IN (234, 123, 412, 23)\G
*************************** 1. row ***************************
           id: 1
  select_type: SIMPLE
        table: rental
         type: range
possible_keys: idx_fk_customer_id
          key: idx_fk_customer_id
      key_len: 2
          ref: NULL
         rows: 101
        Extra: Using index condition; Using where
1 row in set (0.00 sec)

What we have done is to use ‘USE INDEX’, FORCE INDEX’ and ‘IGNORE INDEX’ hints.

‘USE INDEX’ tells the optimizer that it should use one of the listed indexes. In our case we listed only one and therefore it was used.

‘FORCE INDEX’ is basically the same behavior as ‘USE INDEX’, with the exception that with ‘USE INDEX’, the optimizer may still choose to use full table scan for our query. With ‘FORCE INDEX’, a full table scan is marked as extremely expensive operation and therefore won’t be used by the optimizer - as long as any of the listed indexes could be used for our particular query.

‘IGNORE INDEX’ tells the optimizer which indexes we don’t want. In our case we listed ‘rental_date’ as the index we want to avoid. Therefore it decided to choose another option in the query execution plan.

In another example we’ll use the ‘sakila’ schema again with one additional change:

ALTER TABLE actor ADD KEY idx_actor_first_name (first_name);

Let’s assume the following query:

mysql> EXPLAIN SELECT title, description FROM film AS f JOIN film_actor AS fa ON f.film_id = fa.film_id JOIN actor AS a ON fa.actor_id = a.actor_id WHERE a.last_name = 'MIRANDA' AND f.release_year = 2006 ORDER BY a.first_name\G
*************************** 1. row ***************************
           id: 1
  select_type: SIMPLE
        table: a
         type: ref
possible_keys: PRIMARY,idx_actor_last_name
          key: idx_actor_last_name
      key_len: 137
          ref: const
         rows: 1
        Extra: Using index condition; Using where; Using filesort
*************************** 2. row ***************************
           id: 1
  select_type: SIMPLE
        table: fa
         type: ref
possible_keys: PRIMARY,idx_fk_film_id
          key: PRIMARY
      key_len: 2
          ref: sakila.a.actor_id
         rows: 1
        Extra: Using index
*************************** 3. row ***************************
           id: 1
  select_type: SIMPLE
        table: f
         type: eq_ref
possible_keys: PRIMARY
          key: PRIMARY
      key_len: 2
          ref: sakila.fa.film_id
         rows: 1
        Extra: Using where
3 rows in set (0.00 sec)

Assume now that we want to use an index for sorting the result set, not for lookups on the ‘last_name’ column in ‘actor’ table, as the optimizer decided. Let’s put aside any discussions on whether such change makes any sense here (because it doesn’t).

What we can do is to ensure ‘idx_actor_last_name’ index is not used for JOIN and that we’ll use ‘idx_actor_first_name’ index for ORDER BY. We can do it like this:

mysql> EXPLAIN SELECT title, description FROM film AS f JOIN film_actor AS fa ON f.film_id = fa.film_id JOIN actor AS a IGNORE INDEX FOR JOIN (idx_actor_last_name) FORCE INDEX FOR ORDER BY(idx_actor_first_name) ON fa.actor_id = a.actor_id WHERE a.last_name LIKE 'B%' AND f.release_year = 2006 ORDER BY a.first_name\G
*************************** 1. row ***************************
           id: 1
  select_type: SIMPLE
        table: a
         type: index
possible_keys: PRIMARY
          key: idx_actor_first_name
      key_len: 137
          ref: NULL
         rows: 200
        Extra: Using where
*************************** 2. row ***************************
           id: 1
  select_type: SIMPLE
        table: fa
         type: ref
possible_keys: PRIMARY,idx_fk_film_id
          key: PRIMARY
      key_len: 2
          ref: sakila.a.actor_id
         rows: 1
        Extra: Using index
*************************** 3. row ***************************
           id: 1
  select_type: SIMPLE
        table: f
         type: eq_ref
possible_keys: PRIMARY
          key: PRIMARY
      key_len: 2
          ref: sakila.fa.film_id
         rows: 1
        Extra: Using where
3 rows in set (0.00 sec)

Please note the position of the hints - they are located after the relevant table and its alias:

JOIN actor AS a IGNORE INDEX FOR JOIN (idx_actor_last_name) FORCE INDEX FOR ORDER BY(idx_actor_first_name)

Thanks to this, the optimizer can link the hints to the correct table.
Aside of … FOR JOIN and … FOR ORDER BY there’s one more hint: … FOR GROUP BY which is applied to use an index for aggregating data.

When you use USE INDEX, FORCE INDEX or IGNORE INDEX, it is the equivalent of combining all of the previously mentioned hints. For example:

FORCE INDEX (idx_myindex):

FORCE INDEX FOR JOIN (idx_myindex)
FORCE INDEX FOR ORDER BY (idx_myindex) 
FORCE INDEX FOR GROUP BY (idx_myindex)

JOIN order modification

When you are executing any query with JOINs, the MySQL optimizer has to decide the order in which those tables should be joined. You might not be happy with the order it comes up with.

Let’s look at this query.

mysql> EXPLAIN SELECT actor_id, title FROM film_actor AS fa JOIN film AS f  ON fa.film_id = f.film_id ORDER BY fa.actor_id\G
*************************** 1. row ***************************
           id: 1
  select_type: SIMPLE
        table: f
         type: index
possible_keys: PRIMARY
          key: idx_title
      key_len: 767
          ref: NULL
         rows: 1000
        Extra: Using index; Using temporary; Using filesort
*************************** 2. row ***************************
           id: 1
  select_type: SIMPLE
        table: fa
         type: ref
possible_keys: idx_fk_film_id
          key: idx_fk_film_id
      key_len: 2
          ref: sakila.f.film_id
         rows: 2
        Extra: Using index
2 rows in set (0.00 sec)

Please notice that in the query, we are sorting data using ‘film_actor.actor_id’ column. In the current query execution plan, the optimizer starts with the ‘film’ table and then join ‘film_actor’ to it using idx_fk_film_id index. Sorting has to be performed using the filesort algorithm and a temporary table, because the current join order makes it impossible to use any index for sorting.

Let’s say that for some reason (maybe temporary table is too impacting), we’d prefer to avoid filesort and perform ORDER BY using index. It is possible as we have an index we could use:

  PRIMARY KEY (`actor_id`,`film_id`),

There’s an easy way to make such change - we can use STRAIGHT_JOIN hint. It can be used in two ways. If you use it as:

SELECT STRAIGHT_JOIN ...

this will mean that the tables should be joined the exact order as they appear in the query. So, in case of the following type of query:

SELECT STRAIGHT_JOIN * FROM tab1 JOIN tab2 ON tab1.a = tab2.a JOIN tab3 ON tab2.b = tab3.b;

we can be sure that tables will be joined in following order:

tab1, tab2, tab3

STRAIGHT_JOIN  can also be used within the query, instead of a JOIN, in the following way:

SELECT * FROM tab1 JOIN tab2 ON tab1.a = tab2.a STRAIGHT_JOIN tab3 ON tab2.b = tab3.b; 

This forces tab3 to be joined to tab2 exactly in this order. Optimizer has the following combinations to choose from:

tab1, tab2, tab3
tab2, tab3, tab1

Please note that we are talking only about JOIN here. This is because using LEFT or RIGHT JOIN already determines how tables should be joined - STRAIGHT_JOIN won’t have any effect here.

Ok, let’s get back to our query. We are going to force JOIN in ‘film_actor’, ‘film’ order - exactly as tables appear in the query.

mysql> EXPLAIN SELECT STRAIGHT_JOIN actor_id, title FROM film_actor AS fa JOIN film AS f  ON fa.film_id = f.film_id ORDER BY fa.actor_id\G
*************************** 1. row ***************************
           id: 1
  select_type: SIMPLE
        table: fa
         type: index
possible_keys: idx_fk_film_id
          key: PRIMARY
      key_len: 4
          ref: NULL
         rows: 5462
        Extra: Using index
*************************** 2. row ***************************
           id: 1
  select_type: SIMPLE
        table: f
         type: eq_ref
possible_keys: PRIMARY
          key: PRIMARY
      key_len: 2
          ref: sakila.fa.film_id
         rows: 1
        Extra: NULL
2 rows in set (0.00 sec)

As expected, ‘film_actor’ was used as first table in the join - this allowed the optimizer to use primary key to sort the resultset. We managed to eliminate both filesort and temporary table. In fact, the new query is a little bit faster than the original one. Below is a sample of data from ‘sys’ schema created by Mark Leith.

mysql> select query, max_latency, avg_latency, rows_examined_avg from statement_analysis WHERE db='sakila' AND last_seen > (NOW() - INTERVAL 10 MINUTE) AND query like 'SELECT%'\G
*************************** 1. row ***************************
            query: SELECT `actor_id` , `title` FR ... d` ORDER BY `fa` . `actor_id`
      max_latency: 22.10 ms
      avg_latency: 16.25 ms
rows_examined_avg: 17386
*************************** 2. row ***************************
            query: SELECT STRAIGHT_JOIN `actor_id ... d` ORDER BY `fa` . `actor_id`
      max_latency: 16.75 ms
      avg_latency: 15.10 ms
rows_examined_avg: 10924
2 rows in set (0.00 sec)

As you can see, we scan less rows and latency also seems better.

Switchable optimizations

With time, more and more optimizations are being added to the MySQL optimizer. Some of them can be controlled by the user - we can turn them off when we find they are not suitable for our query mix. We won’t be going into the details of every optimization, we’ll concentrate on what we can control and how.

You can list the whole set of switchable optimizations and their status for a current session by running:

mysql> SELECT @@optimizer_switch\G
*************************** 1. row ***************************
@@optimizer_switch: index_merge=on,index_merge_union=on,index_merge_sort_union=on,index_merge_intersection=on,engine_condition_pushdown=on,index_condition_pushdown=on,mrr=on,mrr_cost_based=on,block_nested_loop=on,batched_key_access=off,materialization=on,semijoin=on,loosescan=on,firstmatch=on,subquery_materialization_cost_based=on,use_index_extensions=on
1 row in set (0.00 sec)

The list depends on the MySQL version used, the above was taken on MySQL 5.6. MariaDB also differs from Oracle MySQL in this matter.

Each of the optimizations can be disabled on global level. For example, to disable index_merge optimization we can run:

mysql> SET GLOBAL optimizer_switch="index_merge=off";

To make a change on a session level we can run:

mysql> SET SESSION optimizer_switch="index_merge=off";

Let’s see how it works. We have the following query executed against the ‘sakila’ schema. It produces a query execution plan which involves index merge optimization, to be precise - union index merge.

mysql> EXPLAIN SELECT * FROM film_actor WHERE actor_id = 4 OR film_id = 7\G
*************************** 1. row ***************************
           id: 1
  select_type: SIMPLE
        table: film_actor
         type: index_merge
possible_keys: PRIMARY,idx_fk_film_id
          key: PRIMARY,idx_fk_film_id
      key_len: 2,2
          ref: NULL
         rows: 27
        Extra: Using union(PRIMARY,idx_fk_film_id); Using where
1 row in set (0.00 sec)

This means that MySQL will use two indexes (PRIMARY and idx_fk_film_id) to perform lookups. Let’s say we don’t want this particular optimization to be used here because we know there is a better execution plan.

We can either disable this index merge on global level but it may not be the best idea if there are other queries that can benefit from it. We can do it also on the session level, for this particular query only.

mysql> SET SESSION optimizer_switch="index_merge=off"; EXPLAIN SELECT * FROM film_actor WHERE actor_id = 4 OR film_id = 7\G SET SESSION optimizer_switch="index_merge=on";
Query OK, 0 rows affected (0.00 sec)

*************************** 1. row ***************************
           id: 1
  select_type: SIMPLE
        table: film_actor
         type: ALL
possible_keys: PRIMARY,idx_fk_film_id
          key: NULL
      key_len: NULL
          ref: NULL
         rows: 5462
        Extra: Using where
1 row in set (0.00 sec)

Query OK, 0 rows affected (0.00 sec)

Changing optimizer flags is usually the last line of defence - most of the time forcing the optimizer to use a particular index (or prevent it from using it) will be more than enough to alter the query execution plan. It’s still good to know about this option, as it may be useful every now and then.

We are here closing the chapter on performance - we’ve covered the basics from database configuration to the query tuning process, workload analysis, indexing and EXPLAIN. We plan on covering more in the future but, starting with next blog post of the DBA series, we’ll move to troubleshooting - how do you find out what is wrong with your database? Why does it not start correctly? What to do if you suffer from transient performance problems? If you are running a cluster, why does a node not join the cluster? 

Blog category:

ClusterControl Tips & Tricks: Updating your MySQL Configuration

$
0
0

Requires ClusterControl 1.2.11 or later. Applies to MySQL based clusters.

From time to time it is necessary to tune and update your configuration. Here we will show you how you can change/update  individual parameters using the ClusterControl UI. Navigate to Manage > Configurations.

Pretend that you want to change max_connections from 200 to 500 on all DB nodes in your cluster.

Click on Change Parameter. Select all MySQL Servers in the DB Instances drop down and select the Group (in this case MYSQLD) where the Parameter that you want to change resides, select the parameter (max_connections), and set the New Value to 500:

Press Proceed, and then you will be presented with a Config Change Log of your parameter change:

The Config Change Log says that:

  1. Change was successful
  2. The change was possible with SET GLOBAL (in this case SET GLOBAL max_connections=500)
  3. The change was persisted in my.cnf
  4. No restart is required

What if you don’t find the parameter you want to change in the Parameter drop-down? You can type in the parameter by hand then, and give it a new value. If possible, SET GLOBAL variable_name=value will be executed, and if not, then a restart may be required. Remember, the change will be persisted in my.cnf upon successful execution.

Happy Clustering!

PS.: To get started with ClusterControl, click here!

Blog category:

ClusterControl Tips & Tricks: Securing your MySQL Installation

$
0
0

Requires ClusterControl 1.2.11 or later. Applies to MySQL based clusters.

During the life cycle of Database installation it is common that new user accounts are created. It is a good practice to once in a while verify that the security is up to standards. That is, there should at least not be any accounts with global access rights, or accounts without password.

Using ClusterControl, you can at any time perform a security audit.

In the User Interface go to Manage > Developer Studio. Expand the folders so that you see s9s/mysql/programs. Click on security_audit.js and then press Compile and Run.

If there are problems you will clearly see it in the messages section:

Enlarged Messages output:

Here we have accounts that do not have a password. Those accounts should not exist in a secure database installation. That is rule number one. To correct this problem, click on mysql_secure_installation.js in the s9s/mysql/programs folder.

Click on the dropdown arrow next to Compile and Run and press Change Settings. You will see the following dialog and enter the argument “STRICT”:

Then press Execute. The mysql_secure_installation.js script will then do on each MySQL database instance part of the cluster:

  1. Delete anonymous users
  2. Dropping 'test' database (if exists).
  3. If STRICT is given as an argument to mysql_secure_installation.js it will also do:
    • Remove accounts without passwords.

In the Message box you will see:

The MySQL database servers part of this cluster have now been secured and you have reduced the risk of compromising your data.

You can re-run security_audit.js to verify that the actions have had effect.

Happy Clustering!

PS.: To get started with ClusterControl, click here!

Blog category:

ClusterControl Tips & Tricks: User Management for MySQL

$
0
0

Requires ClusterControl 1.2.11 or later. Applies to MySQL based clusters.

In this example we will look at how you can use ClusterControl to create a user and assign privileges to the user. We will create a user that has enough privileges to perform an xtrabackup.

In the ClusterControl UI press Manage > Schemas and Users, and then press Create Account. You will see the following screen, and here we have filled out the details to create a user with enough privileges to run xtrabackup:

Server refers to the server from which the user is allowed to connect. In Create On DB Node you can select a particular server to execute the CREATE USER/GRANT on. However, if you are using Galera clustering, then the CREATE USER/GRANT will be replicated to all DB Nodes in the cluster.

Then press Save User and the following will be displayed.

Following this you can then look at the user from the Active Accounts page (a reload of the page may be needed before the user is visible - known bug to be fixed):

You have now created a backup user that is allowed to perform backups.

Next you can go to Manage > Configurations and edit the configuration files of the DB nodes that you want to execute backups on. Add following lines:

[xtrabackup]
user=backupuser
password=supersecret

Don’t forget to save the configuration file. This user will then be used by xtrabackup the next time you perform a backup.

Happy Clustering!

PS.: To get started with ClusterControl, click here!

Blog category:

Viewing all 1262 articles
Browse latest View live


<script src="https://jsc.adskeeper.com/r/s/rssing.com.1596347.js" async> </script>