Running a MySQL Galera Cluster (either the Percona, MariaDB, or Codership build) is, unfortunately, not a supported (nor part of) the databases supported by Amazon RDS. Most of the databases supported by RDS use asynchronous replication, while Galera Cluster is a synchronous multi-master replication solution. Galera also requires InnoDB as its storage engine to function properly, and while you can use other storage engines such as MyISAM it is not advised that you use this storage engine because of the lack of transaction handling.
Because of the lack of support natively in RDS, this blog will focus on the offerings available when choosing and hosting your Galera-based cluster using an AWS environment.
There are certainly many reasons why you would choose or not choose the AWS cloud platform, but for this particular topic we’re going to go over the advantages and benefits of what you can leverage rather than why you would choose the AWS Platform.
The Virtual Servers (Elastic Compute Instances)
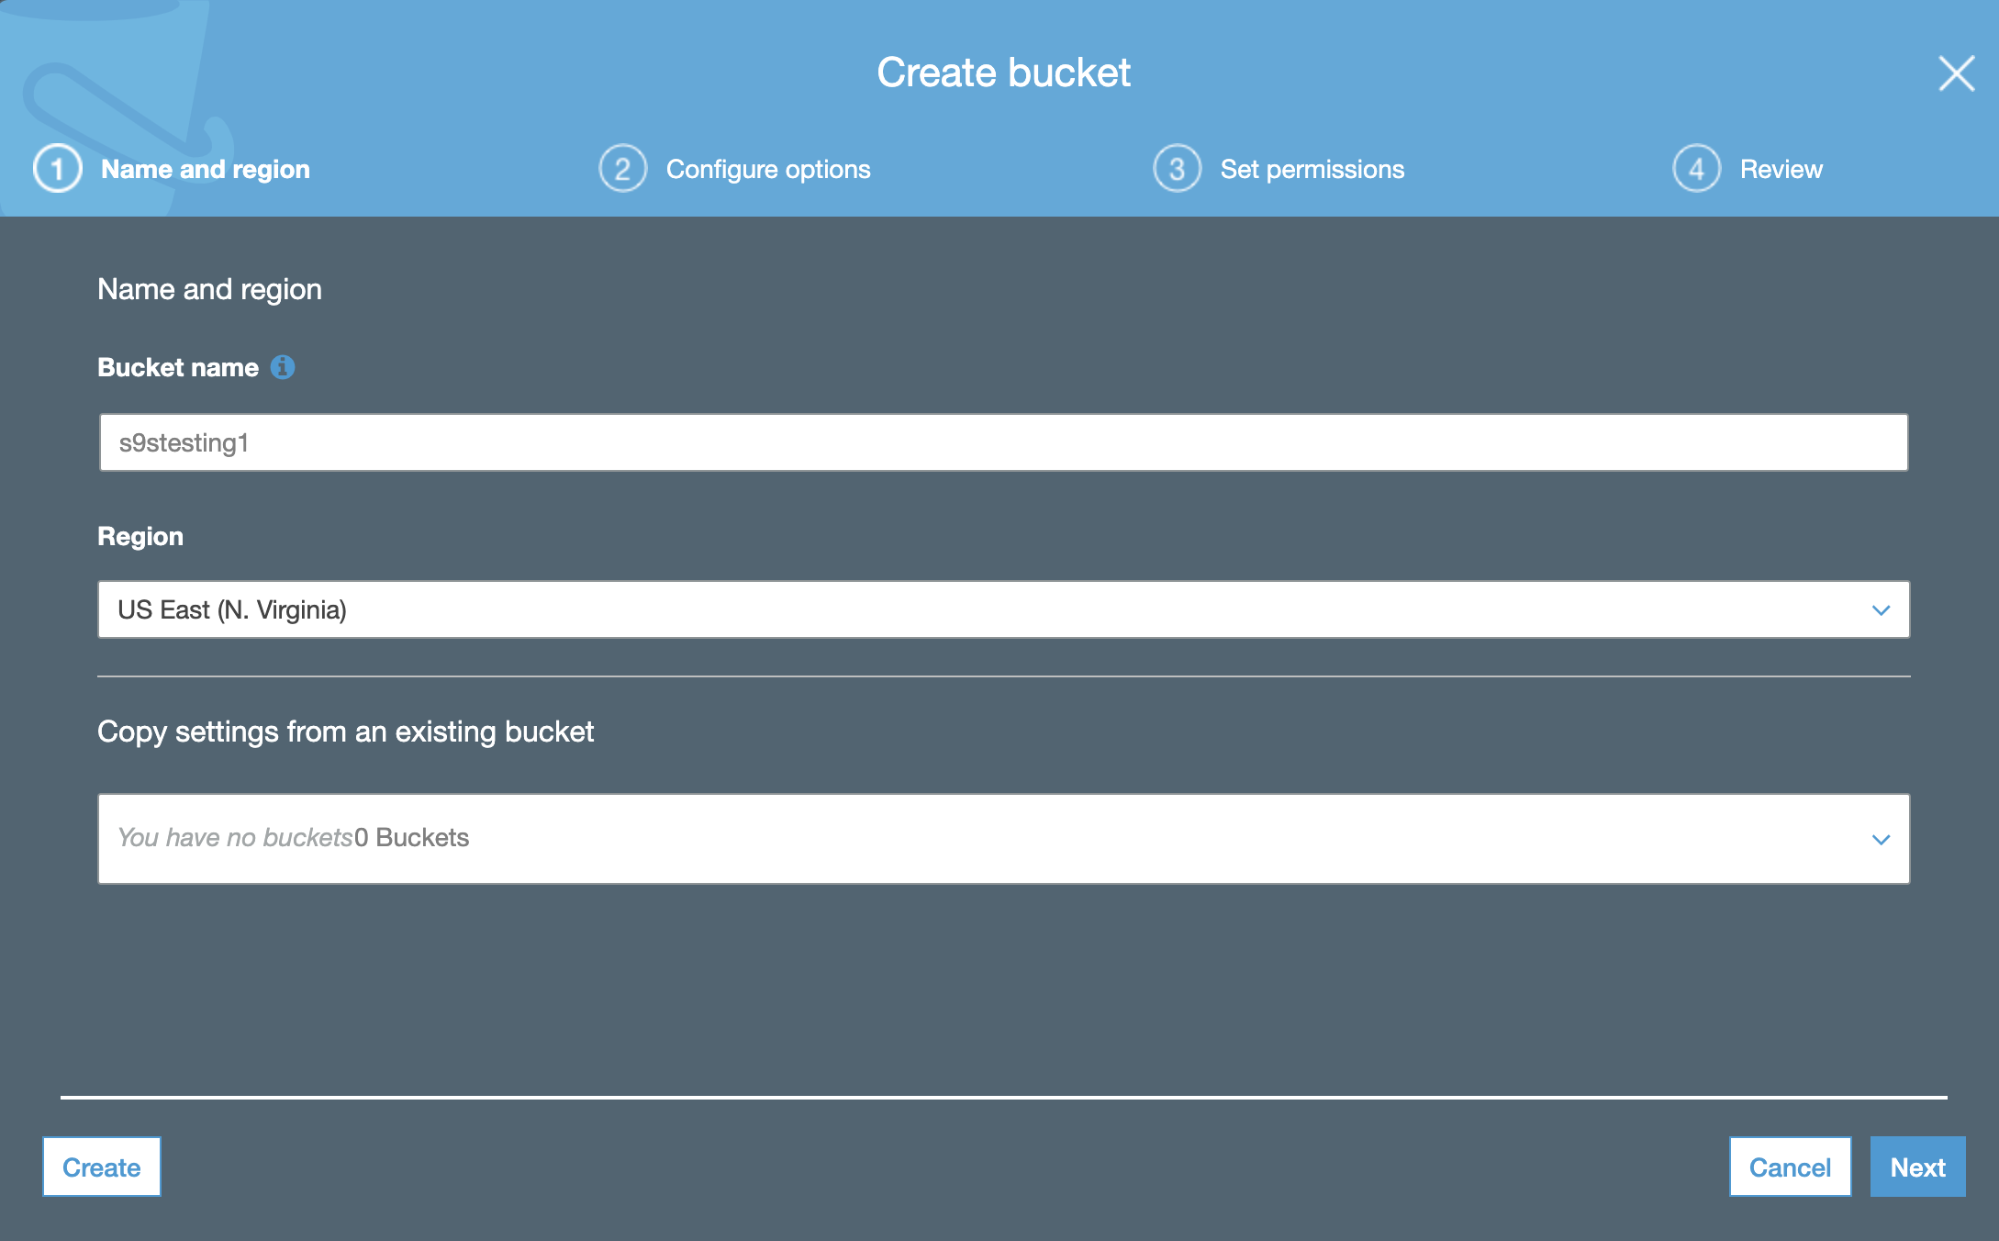
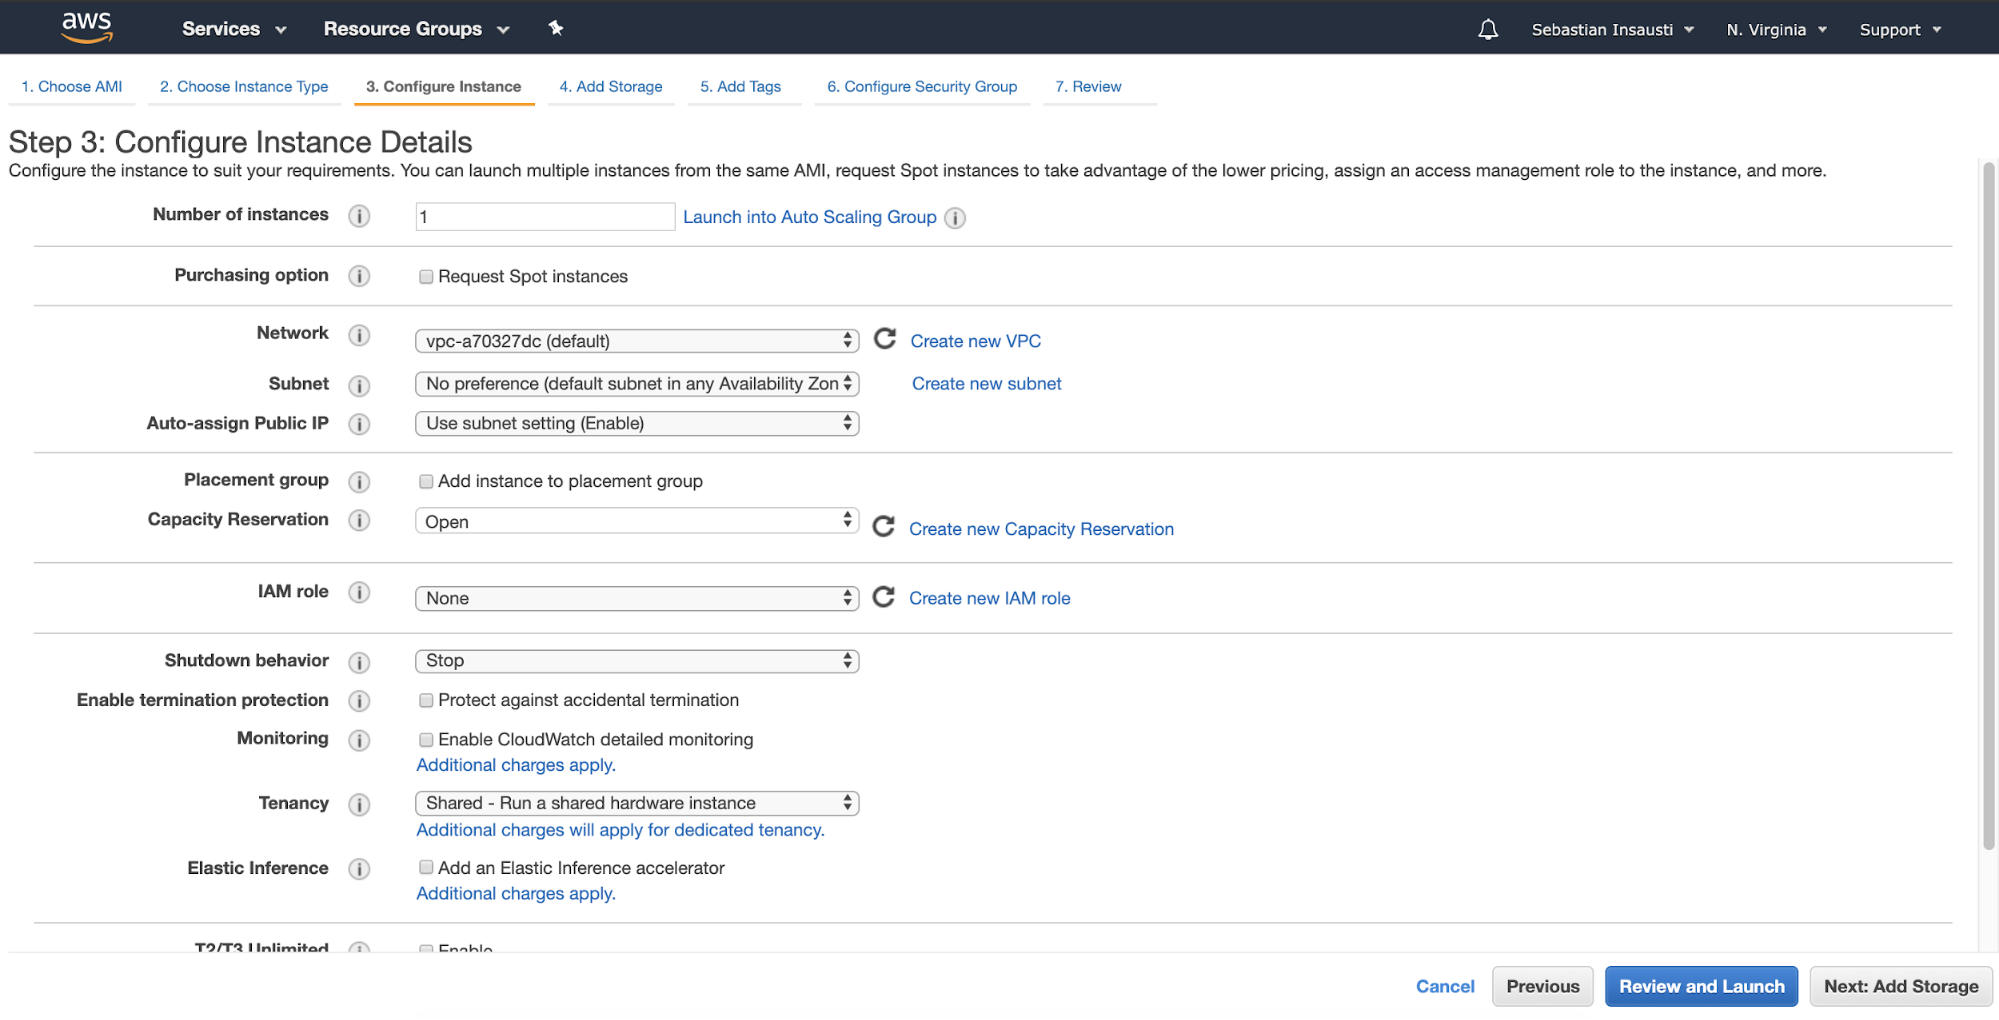
As mentioned earlier, MySQL Galera is not part of RDS and InnoDB is a transactional storage engine for which you need the right resources for your application requirement. It must have the capacity to serve the demand of your client request traffic. At the time of this article, your sole choice for running Galera Cluster is by using EC2, Amazon's compute instance cloud offering.
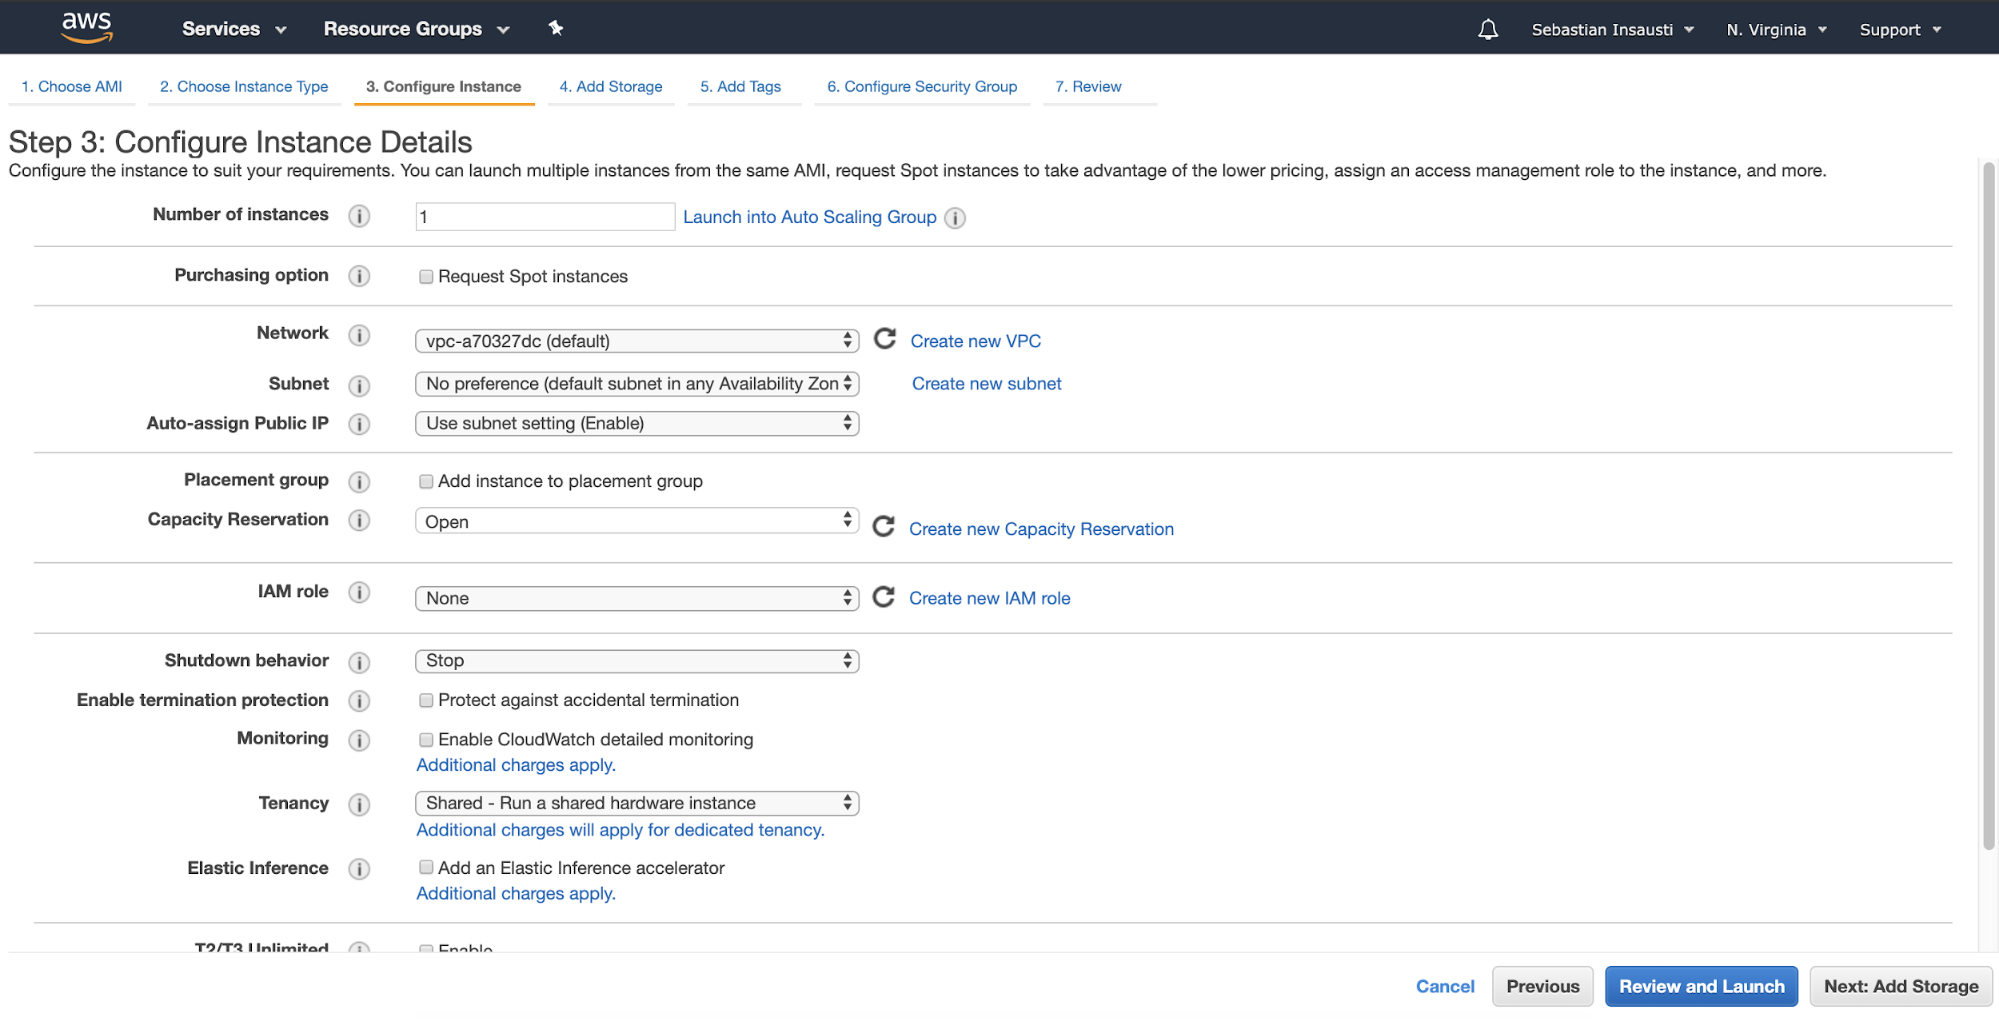
Because you have the advantage of running your system on a number of nodes on EC2 instances, running a Galera Cluster on EC2 verses on-prem doesn’t differ much. You can access the server remotely via SSH, install your desired software packages, and choose the kind of Galera Cluster build you like to utilize.
Moreover, with EC2 this offering is more elastic and flexible, allowing you to deliver and offer a simpler, granular setup. You can take advantage of the web services to automate or build a number of nodes if you need to scaleout your environment, or for example, automate the building of your staging or development environment. It also gives you an edge to quickly build your desired environment, choose and setup your desired OS, and pickup the right computing resources that fits your requirements (such as CPU, memory, and disk storage.) EC2 eliminates the time to wait for hardware, since you can do this on the fly. You can also leverage their AWS CLI tool to automate your Galera cluster setup.
Pricing for Amazon EC2 Instances
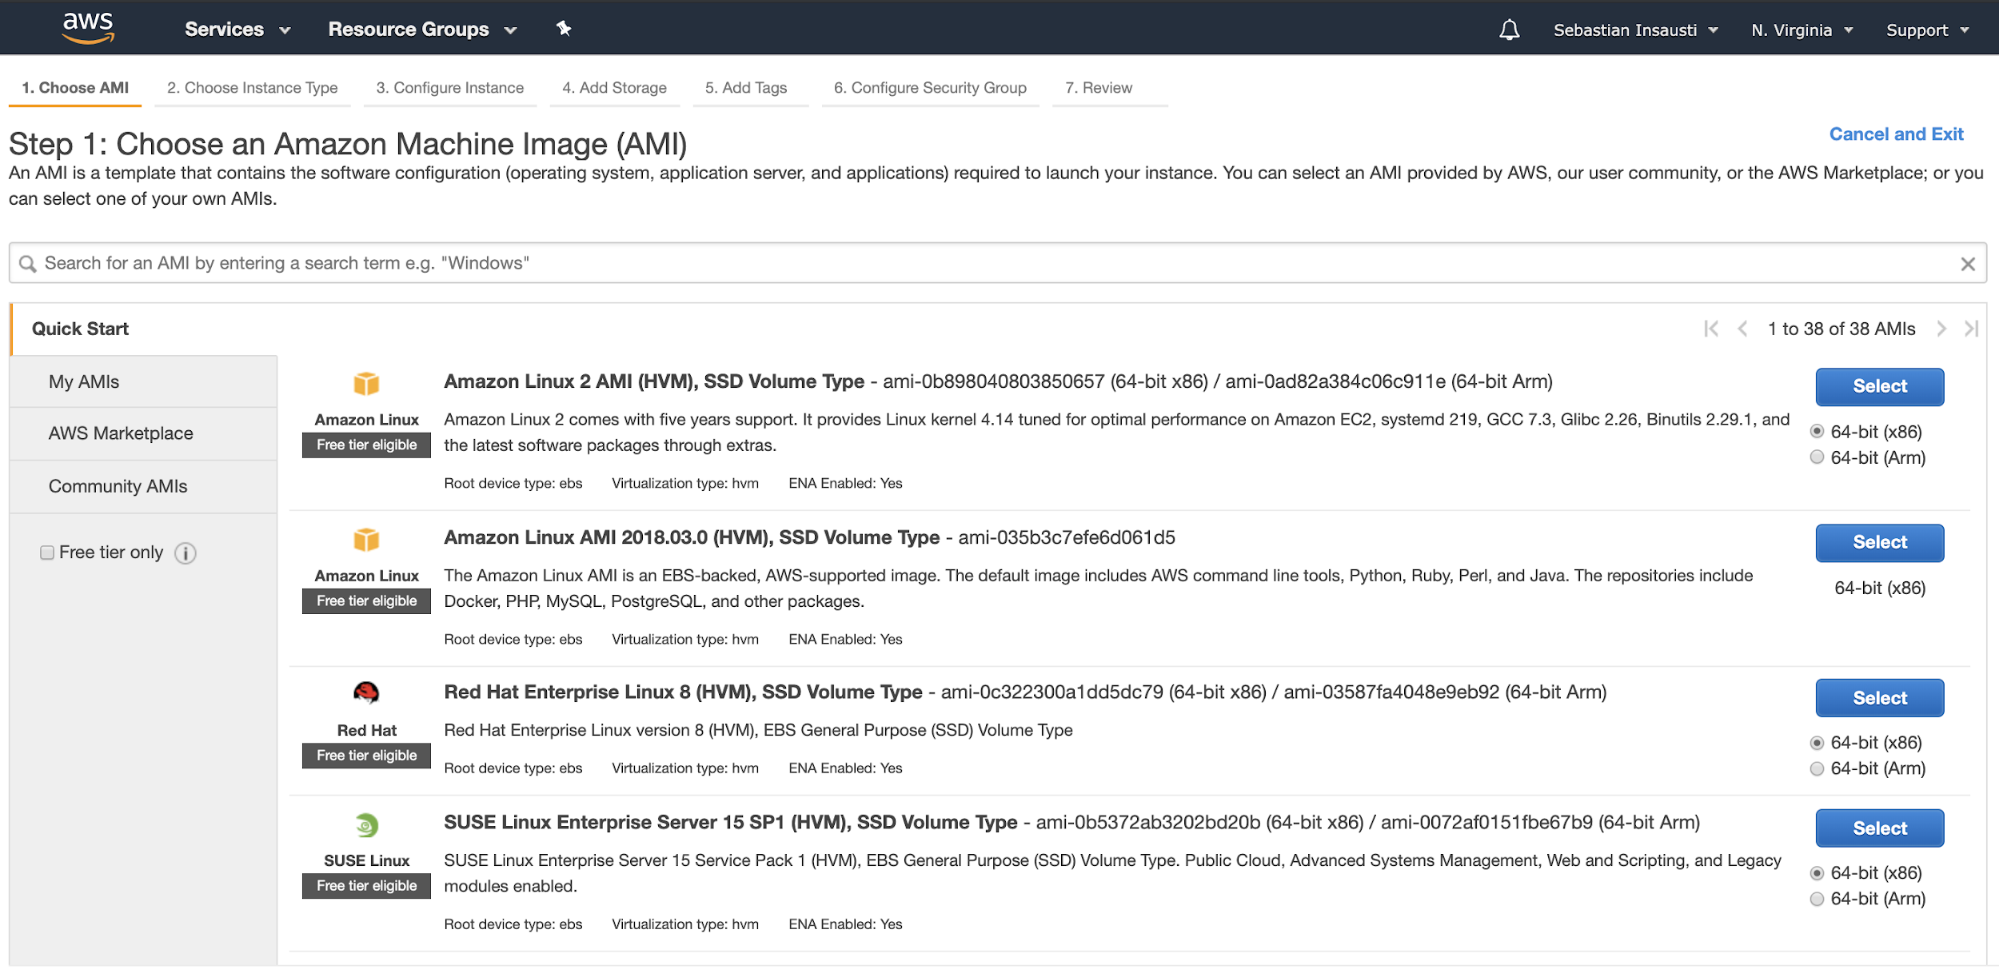
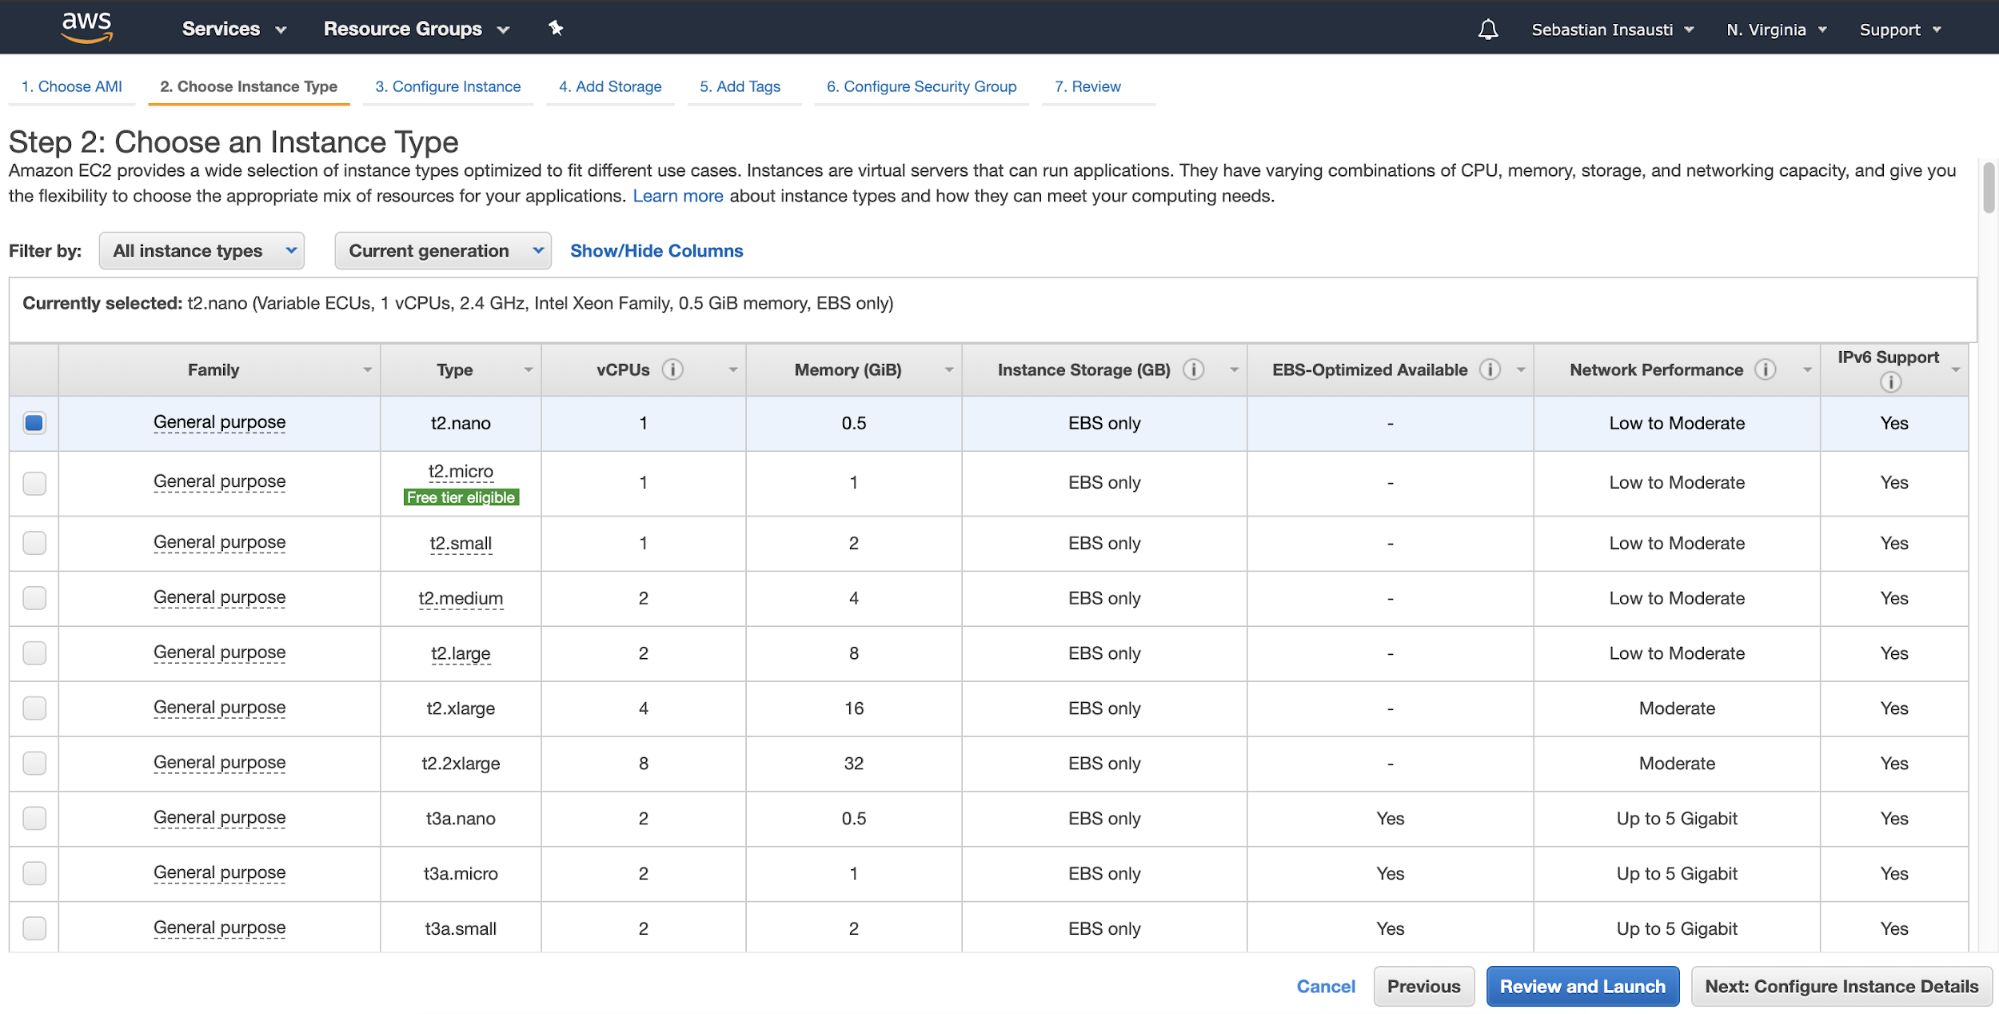
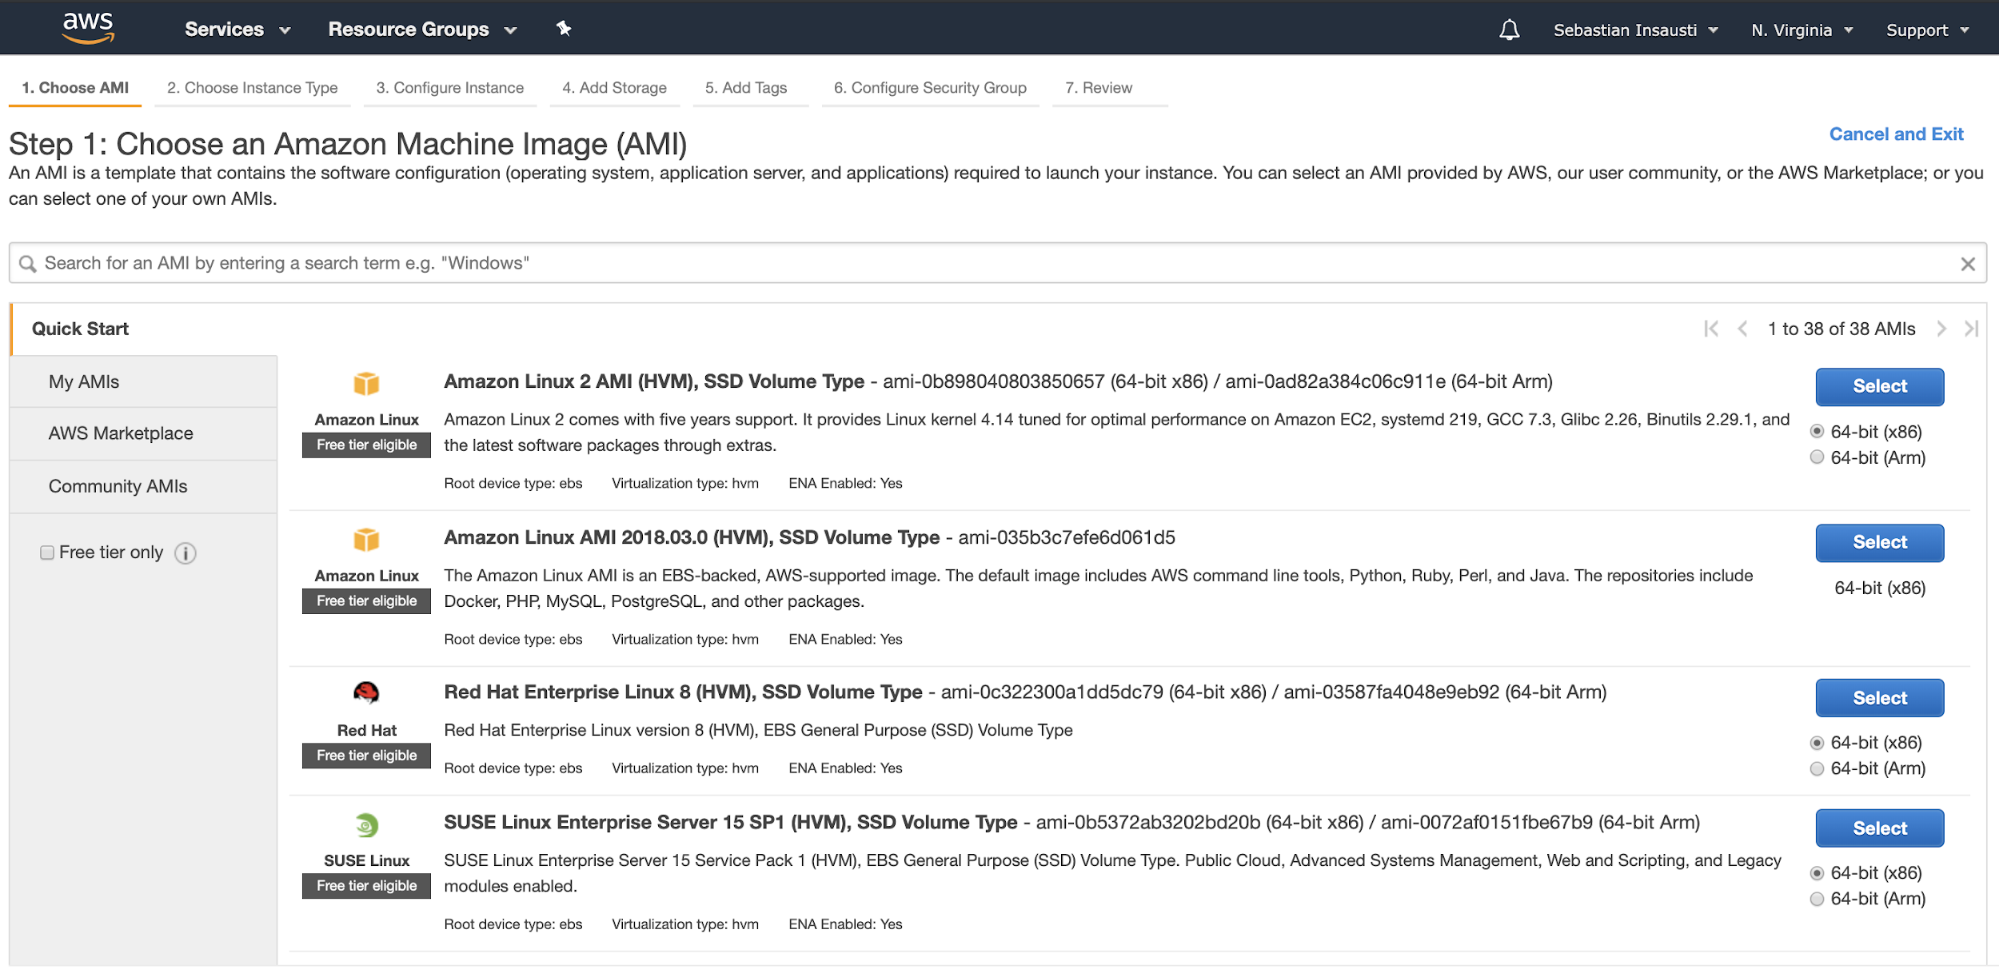
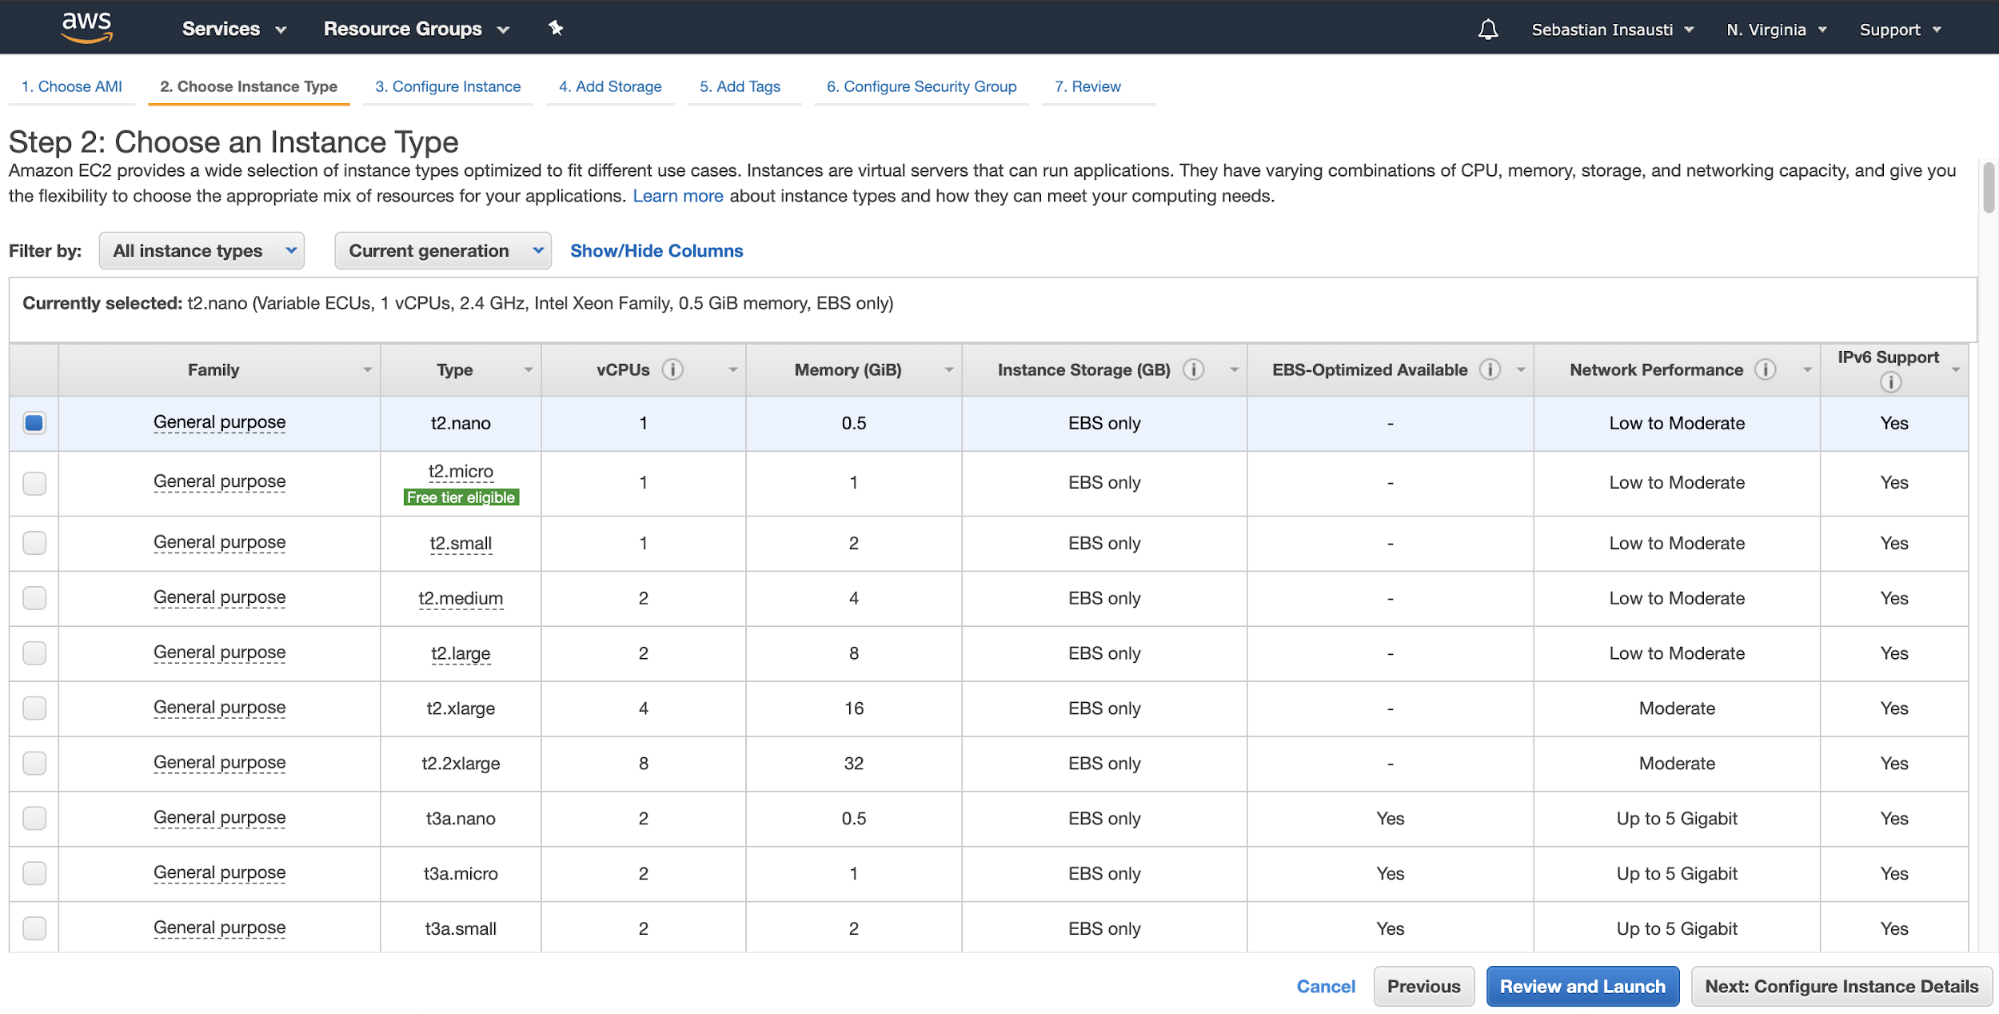
EC2 offers a number of selections which are very flexible for consumers who would like to host their Galera Cluster environment on AWS compute nodes. The AWS Free Tier includes 750 hours of Linux and Windows t2.micro instances, each month, for one year. You can stay within the Free Tier by using only EC2 Micro instances, but this might not be the best thing for production use.
There are multiple types of EC2 instances for which you can deploy when provisioning your Galera nodes. Ideally, these r4/r5/x1 family (memory optimized) and c4/c5 family (compute optimized) are an ideal choice, and these prices differ depending on how large your server resource needs are and type of OS.
These are the types of paid instances you can choose...
On Demand
Pay by compute capacity (per-hour or per-second), depends on the type of instances you run. For example, prices might differ when provisioning an Ubuntu instances vs RHEL instance aside from the type of instance. It has no long-term commitments or upfront payments needed. It also has the flexibility to increase or decrease your compute capacity. These instances are recommended for low cost and flexible environment needs like applications with short-term, spiky, or unpredictable workloads that cannot be interrupted, or applications being developed or tested on Amazon EC2 for the first time. Check it out here for more info.
Dedicated Hosts
If you are looking for compliance and regulatory requirements such as the need to acquire a dedicated server that runs on a dedicated hardware for use, this type of offer suits your needs. Dedicated Hosts can help you address compliance requirements and reduce costs by allowing you to use your existing server-bound software license, including Windows Server, SQL Server, SUSE Linux Enterprise Server, Red Hat Enterprise Linux, or other software licenses that are bound to VMs, sockets, or physical cores, subject to your license terms. It can be purchased On-Demand (hourly) or as a Reservation for up to 70% off the On-Demand price. Check it out here for more info.
Spot Instances
These instances allow you to request spare Amazon EC2 computing capacity for up to 90% off the On-Demand price. This is recommended for applications that have flexible start and end times, applications that are only feasible at very low compute prices, or users with urgent computing needs for large amounts of additional capacity. Check it out here for more info.
Reserved Instances
This type of payment offer provides you the option to grab up to a 75% discount and, depending on which instance you would like to reserve, you can acquire a capacity reservation giving you additional confidence in your ability to launch instances when you need them. This is recommended if your applications have steady state or predictable usage, applications that may require reserved capacity, or customers that can commit to using EC2 over a 1 or 3 year term to reduce their total computing costs. Check it out here for more info.
Pricing Note
One last thing with EC2, they also offer a per-second billing which also takes cost of unused minutes and seconds in an hour off of the bill. This is advantageous if you are scaling-out for a minimal amount of time, just to handle traffic request from a Galera node or in case you want to try and test on a specific node for just a limited time use.
Database Encryption on AWS
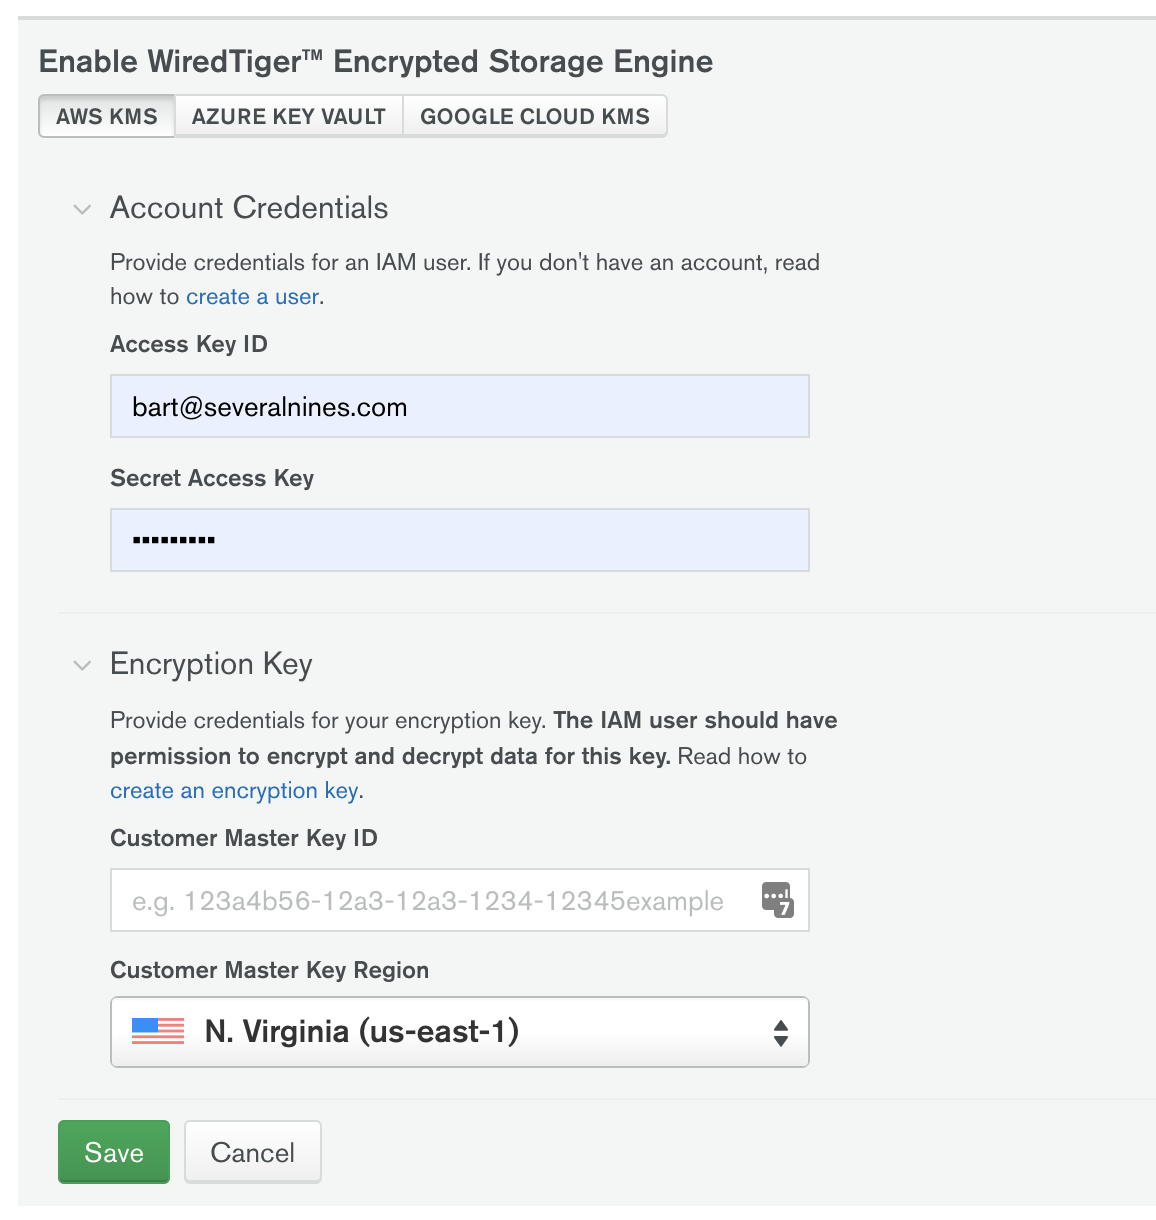
If you're concerned about the confidentiality of your data, or abiding the laws required for your security compliance and regulations, AWS offers data-at-rest encryption. If you're using MariaDB Cluster version 10.2+, they have built-in plugin support to interface with the Amazon Web Services (AWS) Key Management Service (KMS) API. This allows you to take advantage of AWS-KMS key management service to facilitate separation of responsibilities and remote logging & auditing of key access requests. Rather than storing the encryption key in a local file, this plugin keeps the master key in AWS KMS.
When you first start MariaDB, the AWS KMS plugin will connect to the AWS Key Management Service and ask it to generate a new key. MariaDB will store that key on-disk in an encrypted form. The key stored on-disk cannot be used to decrypt the data; rather, on each startup, MariaDB connects to AWS KMS and has the service decrypt the locally-stored key(s). The decrypted key is stored in-memory as long as the MariaDB server process is running, and that in-memory decrypted key is used to encrypt the local data.
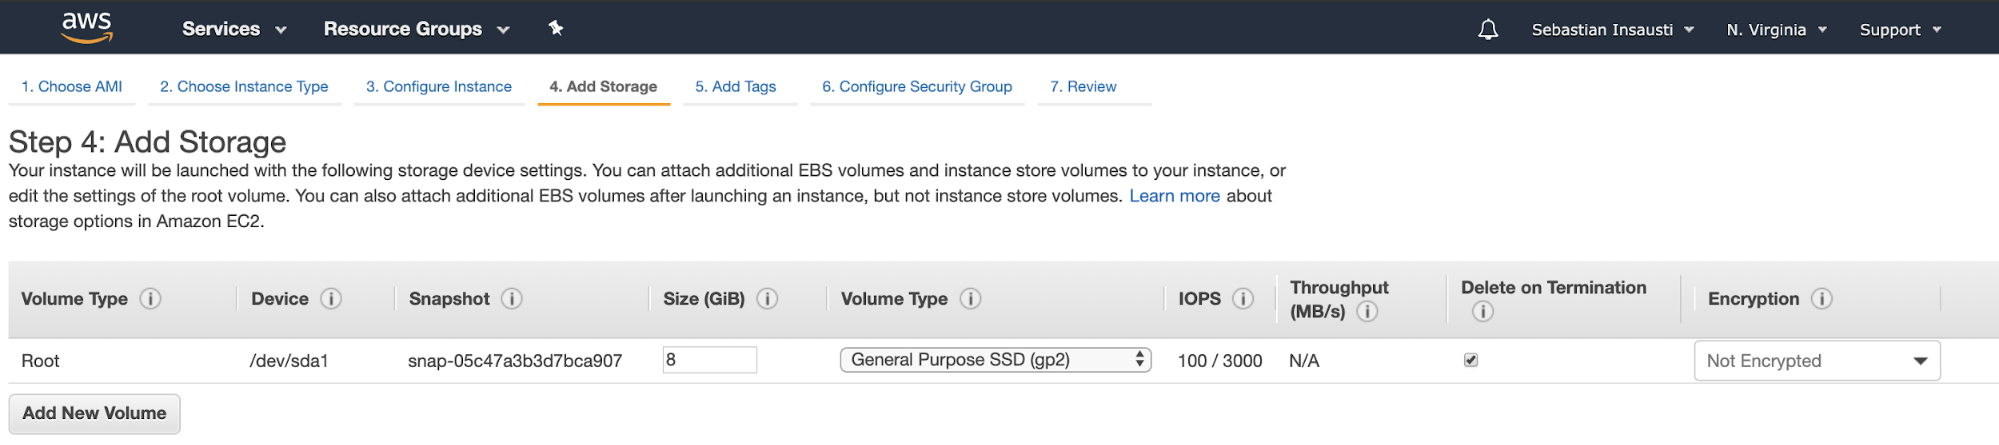
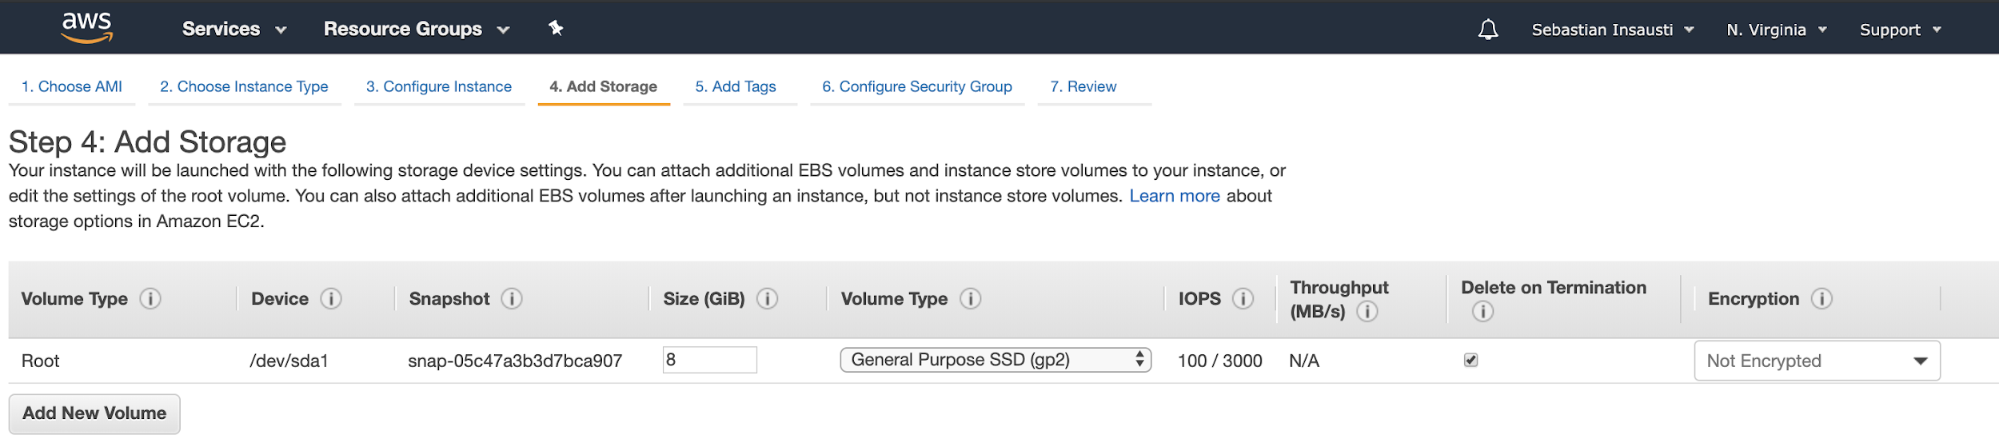
Alternatively, when deploying your EC2 instances, you can encrypt your data storage volume with EBS (Elastic Block Storage) or encrypt the instance itself. Encryption for EBS type volumes are all supported, though it might have an impact but the latency is very minimal or even not visible to the end users. For EC2 instance-type encryption, most of the large instances are supported. So if you're using compute or memory optimized nodes, you can leverage its encryption.
Below are the list of supported instances types...
- General purpose: A1, M3, M4, M5, M5a, M5ad, M5d, T2, T3, and T3a
- Compute optimized: C3, C4, C5, C5d, and C5n
- Memory optimized: cr1.8xlarge, R3, R4, R5, R5a, R5ad, R5d, u-6tb1.metal, u-9tb1.metal, u-12tb1.metal, X1, X1e, and z1d
- Storage optimized: D2, h1.2xlarge, h1.4xlarge, I2, and I3
- Accelerated computing: F1, G2, G3, P2, and P3
You can setup your AWS account to always enable encryption upon deployment of your EC2-type instances. This means that AWS will encrypt new EBS volumes on launch and encrypts new copies of unencrypted snapshots.
Multi-AZ/Multi-Region/Multi-Cloud Deployments
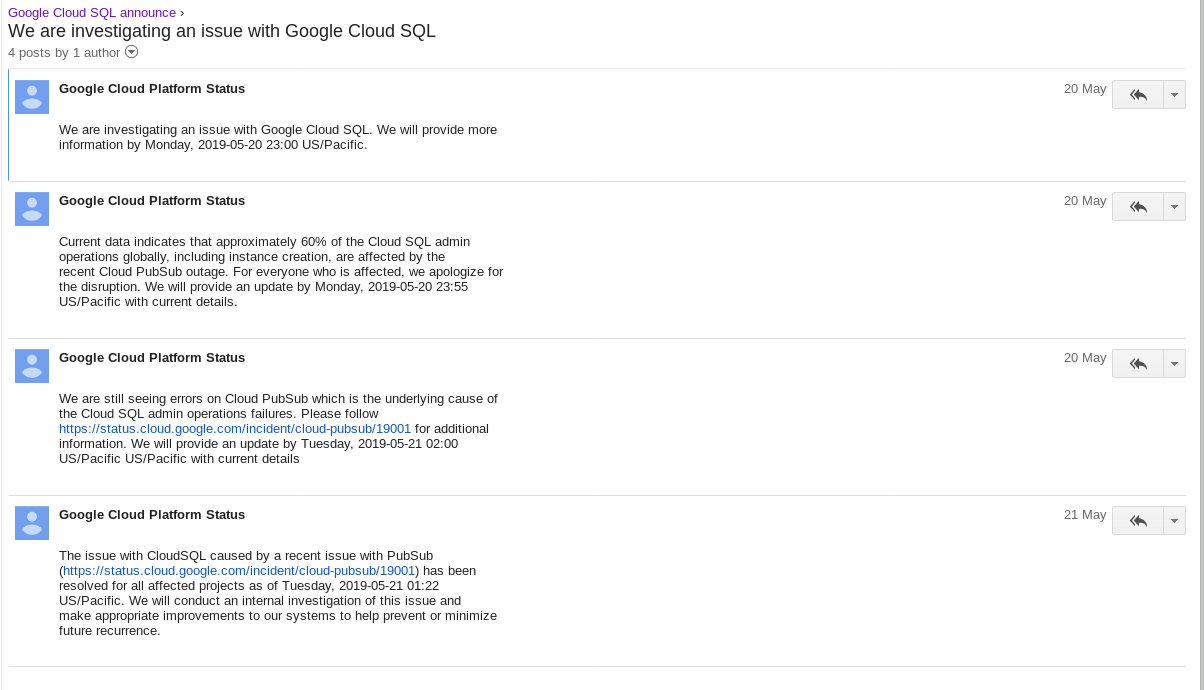
Unfortunately, as of this writing, there's no such direct support in the AWS Console (nor any of their AWS API) that supports Multi-AZ/-Region/-Cloud deployments for Galera node clusters.
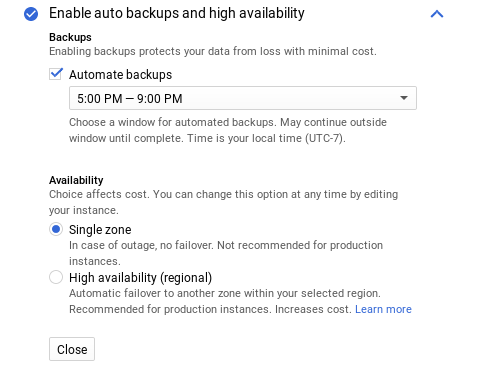
High Availability, Scalability, and Redundancy
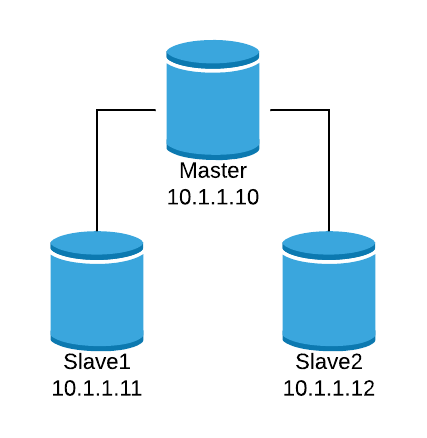
To achieve a multi-AZ deployment, it's recommendable that you provision your galera nodes in different availability zones. This prevents the cluster from going down or a cluster malfunction due to lack of quorum.
You can also setup an AWS Auto Scaling and create an auto scaling group to monitor and do status checks so your cluster will always have redundancy, scalable, and highly availability. Auto Scaling should solve your problem in the case that your node goes down for some unknown reason.
For multi-region or multi-cloud deployment, Galera has its own parameter called gmcast.segment for which you can set this upon server start. This parameter is designed to optimize the communication between the Galera nodes and minimize the amount of traffic sent between network segments including writeset relaying and IST and SST donor selection.
This type of setup allows you to deploy multiple nodes in different regions for your Galera Cluster. Aside from that, you can also deploy your Galera nodes on a different vendor, for example, if it's hosted in Google Cloud and you want redundancy on Microsoft Azure.
I would recommend you to check out our blog Multiple Data Center Setups Using Galera Cluster for MySQL or MariaDB and Zero Downtime Network Migration With MySQL Galera Cluster Using Relay Node to gather more information on how to implement these types of deployments.
Database Performance on AWS
Depending on your application demand, if your queries memory consuming the memory optimized instances are your ideal choice. If your application has higher transactions that require high-performance for web servers or batch processing, then choose compute optimized instances. If you want to learn more about optimizing your Galera Cluster, you can check out this blog How to Improve Performance of Galera Cluster for MySQL or MariaDB.
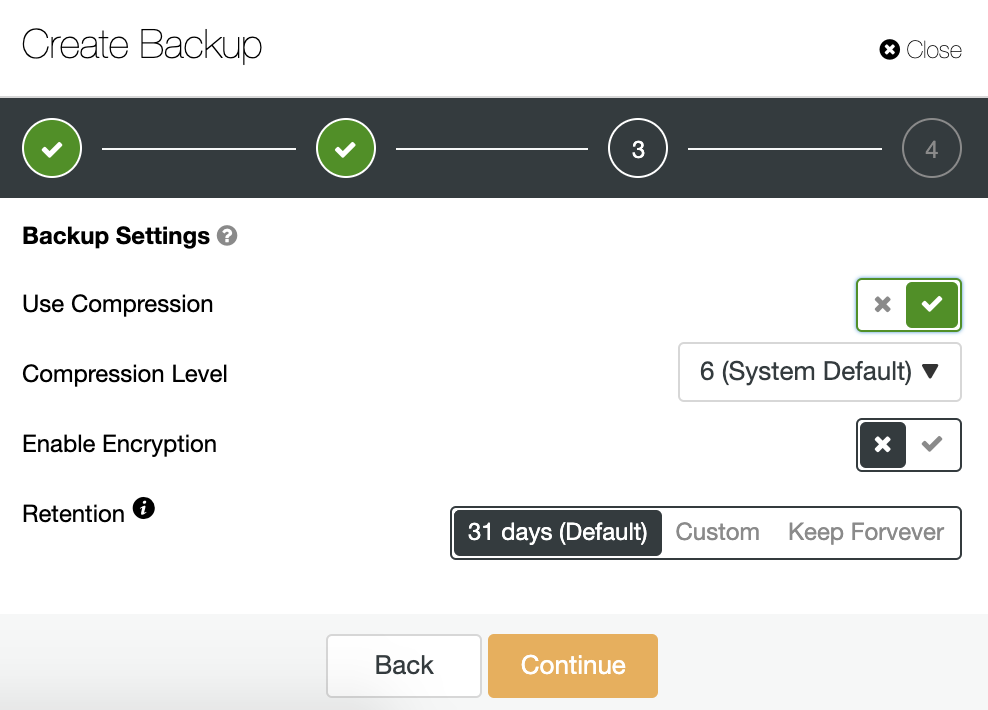
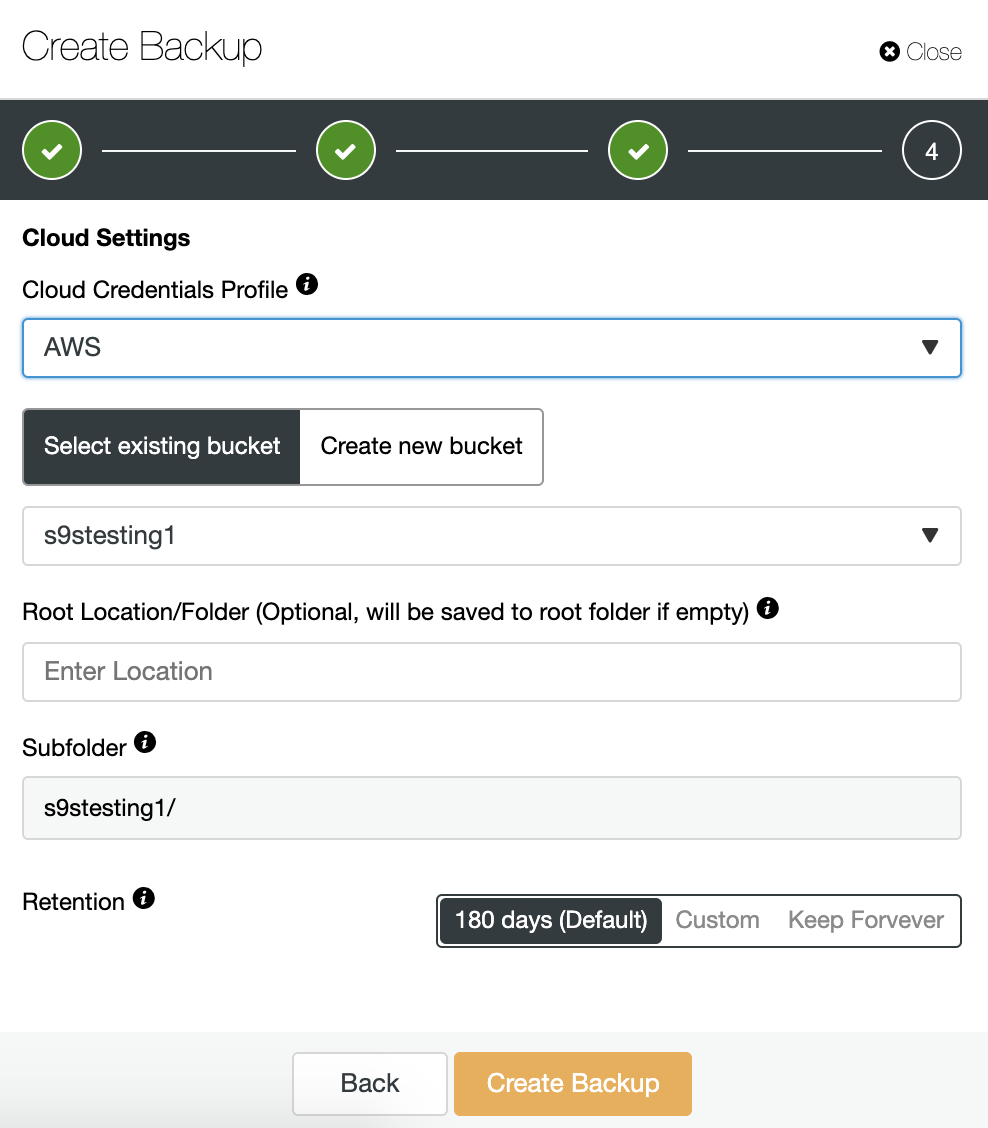
Database Backups on AWS
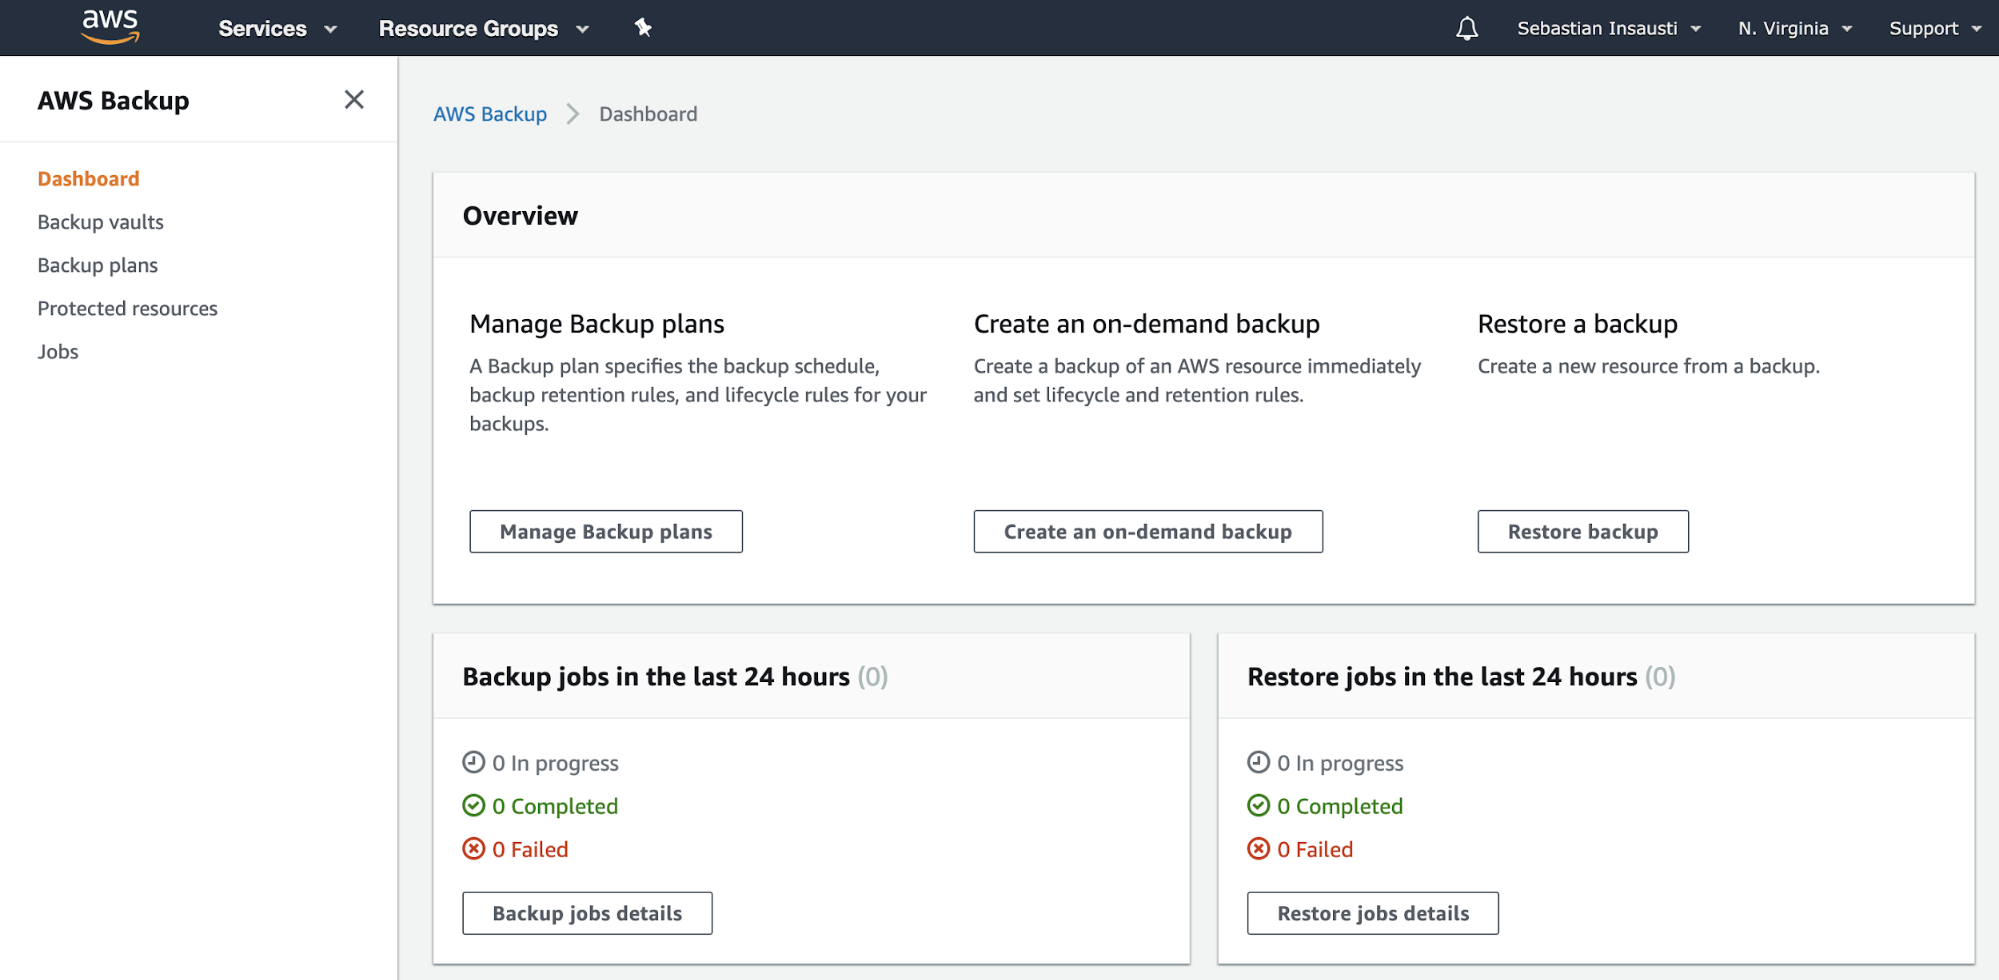
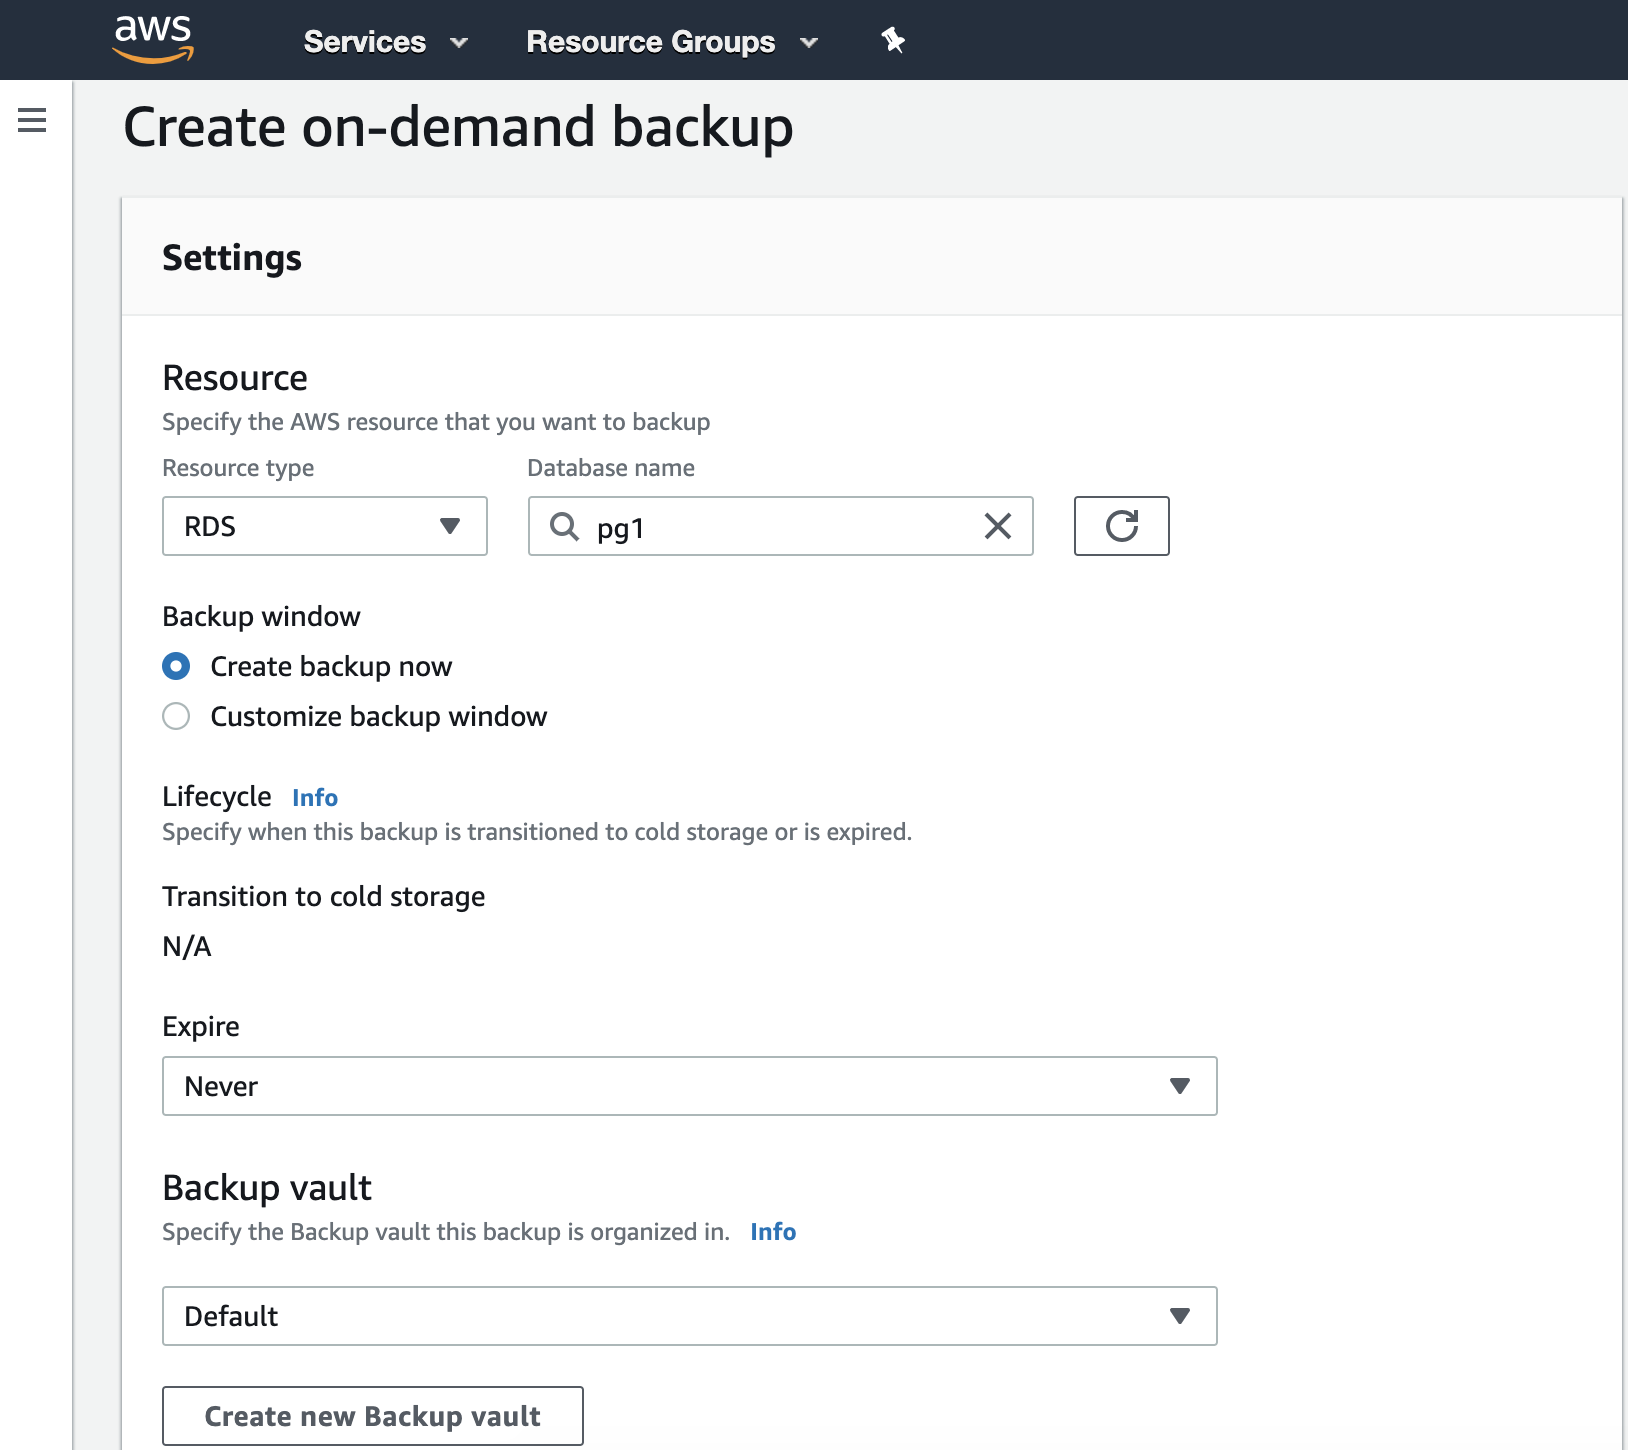
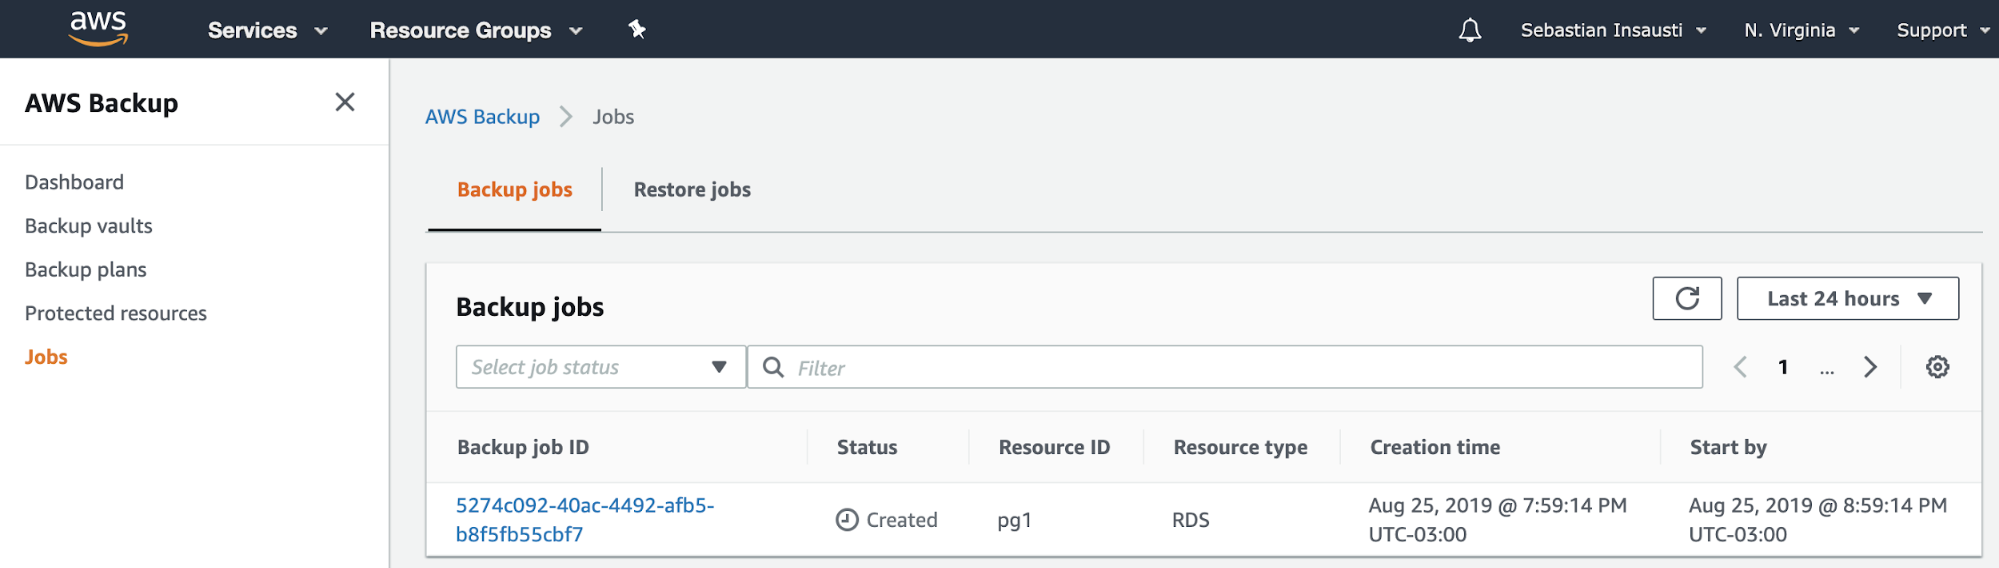
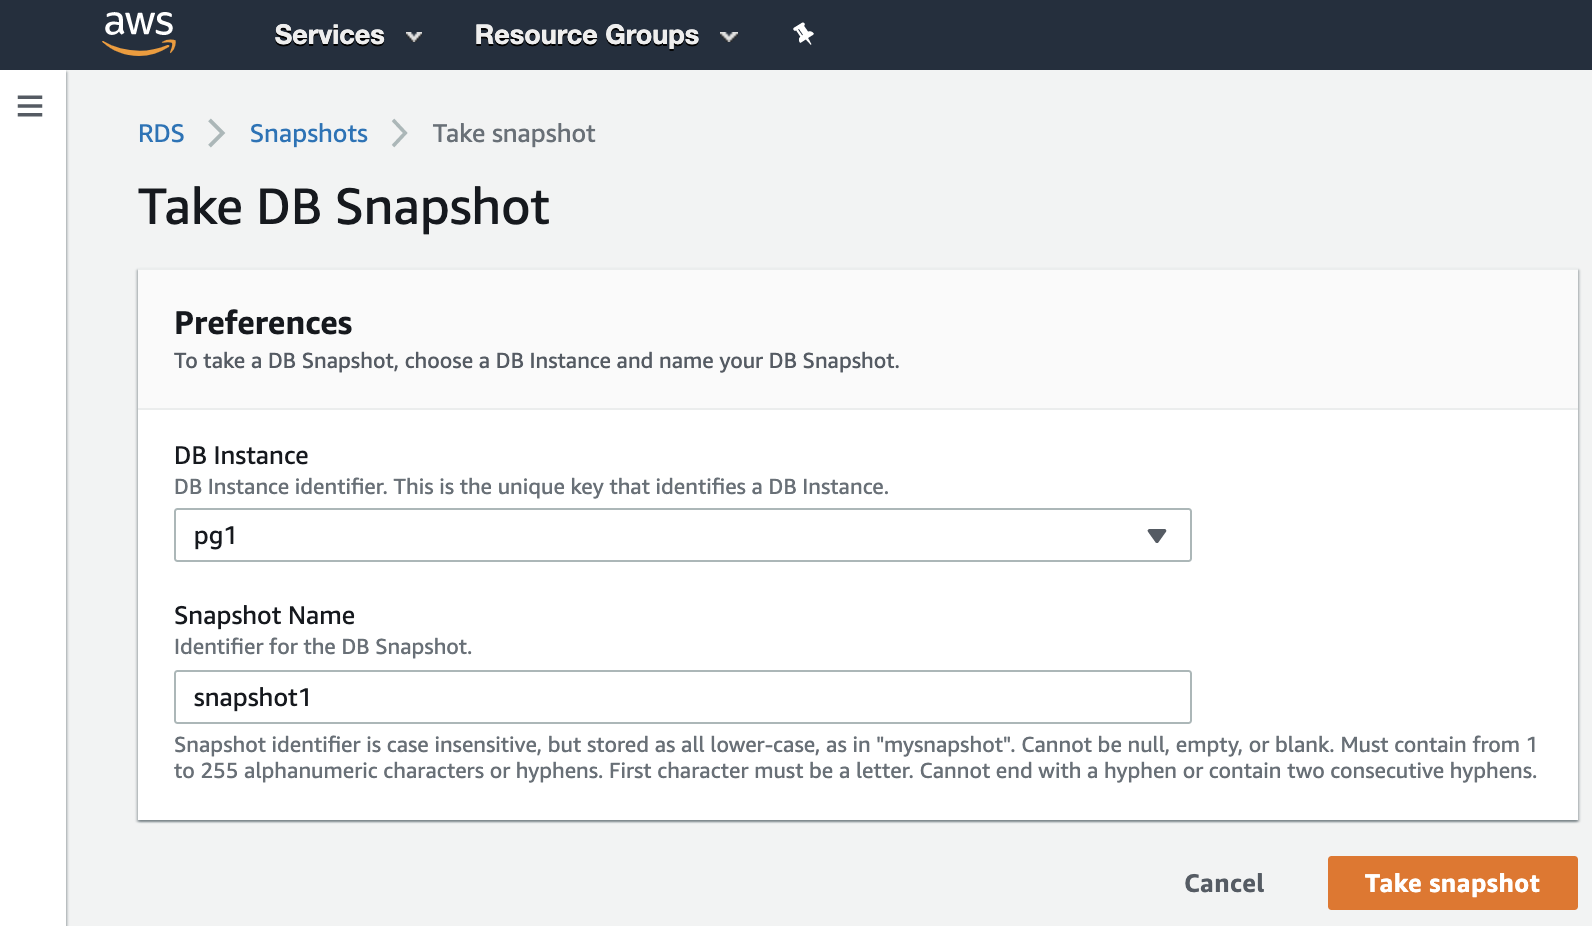
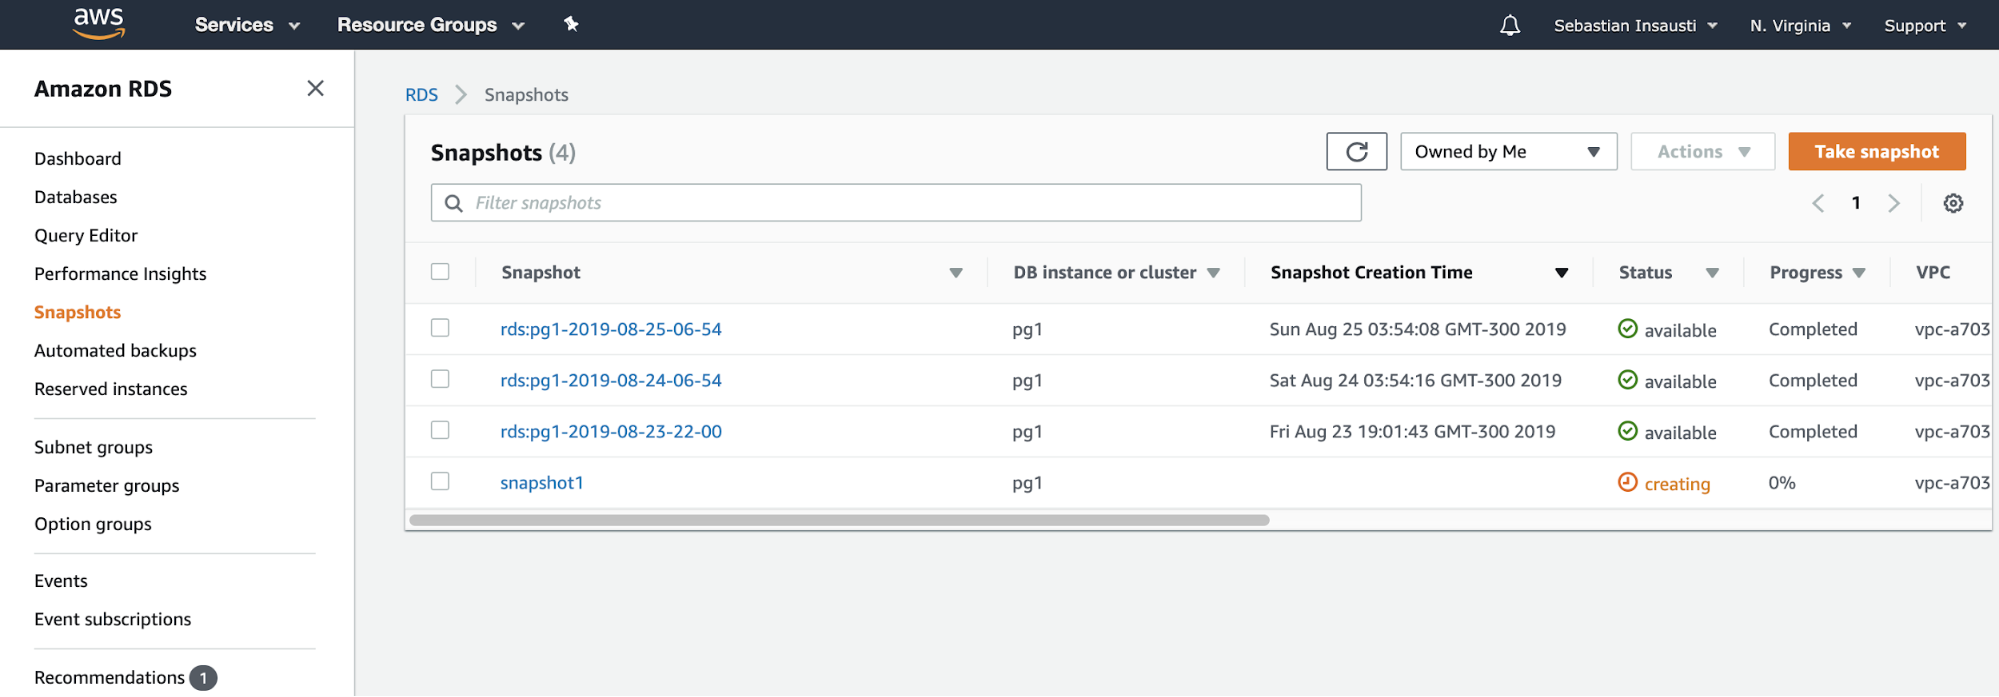
Creating backups can be difficult since there's no direct support within AWS that is specific for MySQL Galera technology. However, AWS provides you a disaster and recovery solution using EBS Snapshots. You can take snapshots of the EBS volumes attached to your instance, then either take a backup by schedule using CloudWatch or by using the Amazon Data Lifecycle Manager (Amazon DLM) to automate the snapshots.
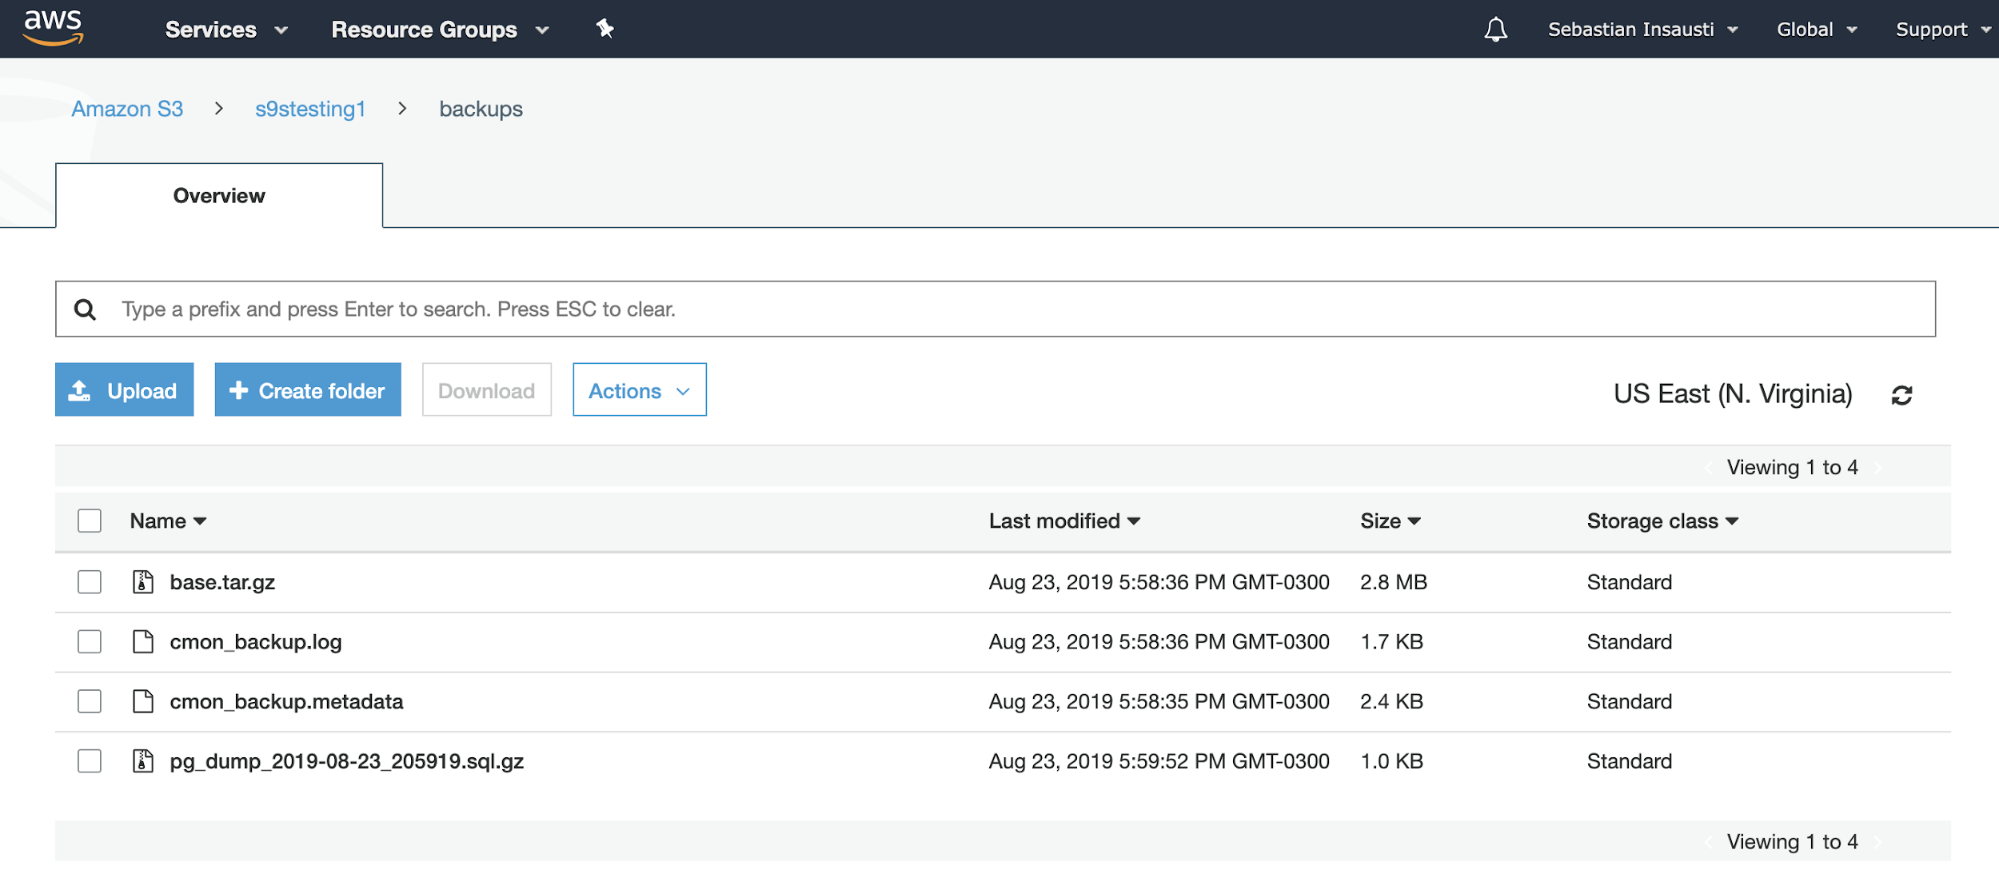
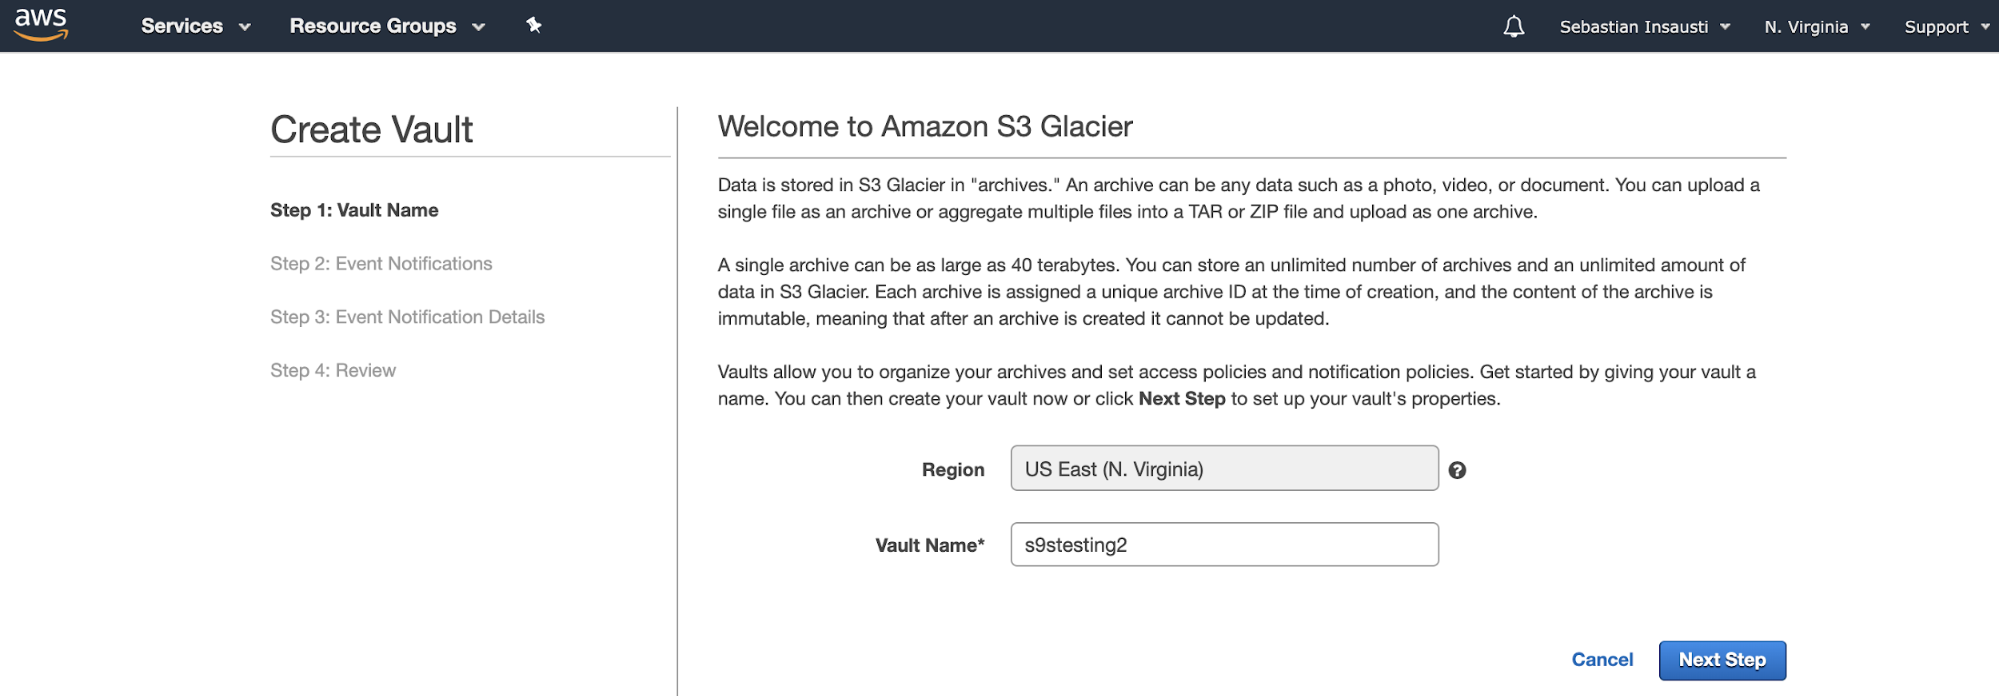
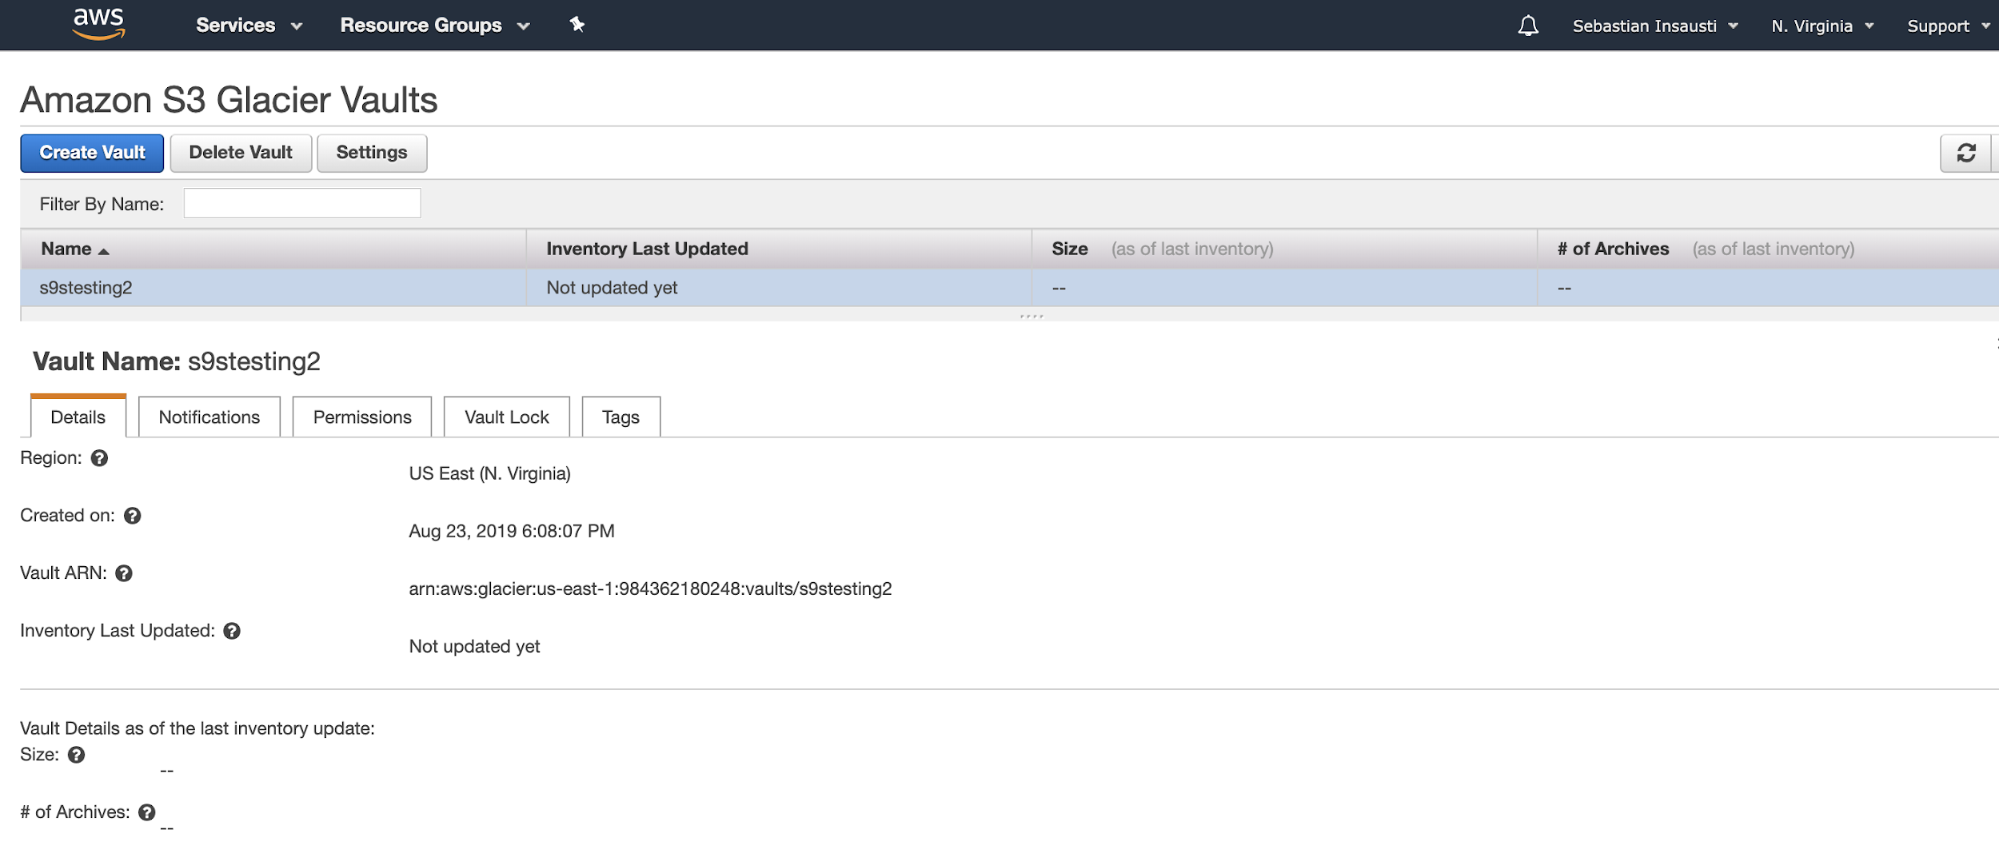
Take note that the snapshots taken are incremental backups, which means that only the blocks on the device that have changed after your most recent snapshot are saved. You can store these snapshots to AWS S3 to save storage costs. Alternatively, you can use external tools like Percona Xtrabackup, and Mydumper (for logical backups) and store these to AWS EFS -> AWS S3 -> AWS Glacier.
You can also setup Lifecycle Management in AWS if you need your backup data to be stored in a more cost efficient manner. If you have large files and are going to utilize the AWS EFS, you can leverage their AWS Backup solution as this is also a simple yet cost-effective solution.
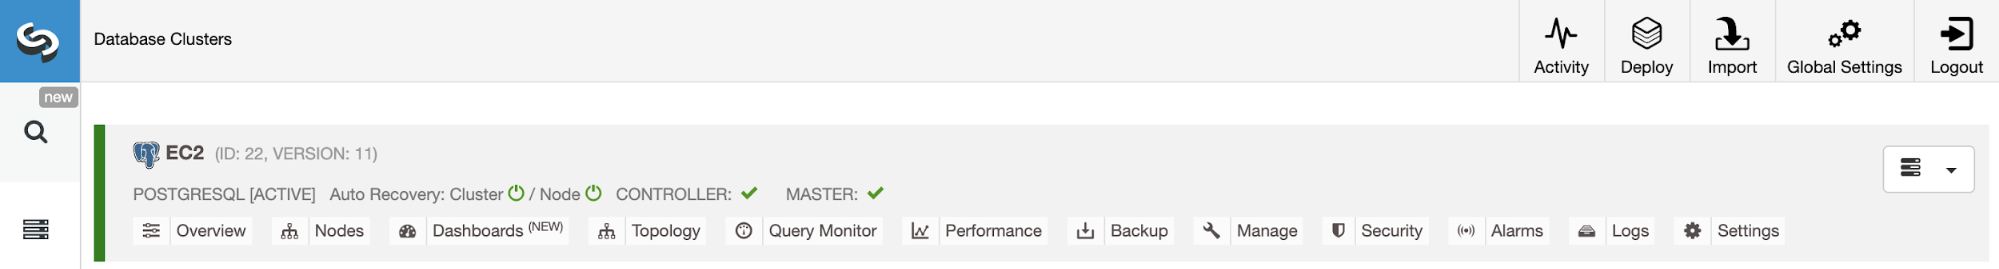
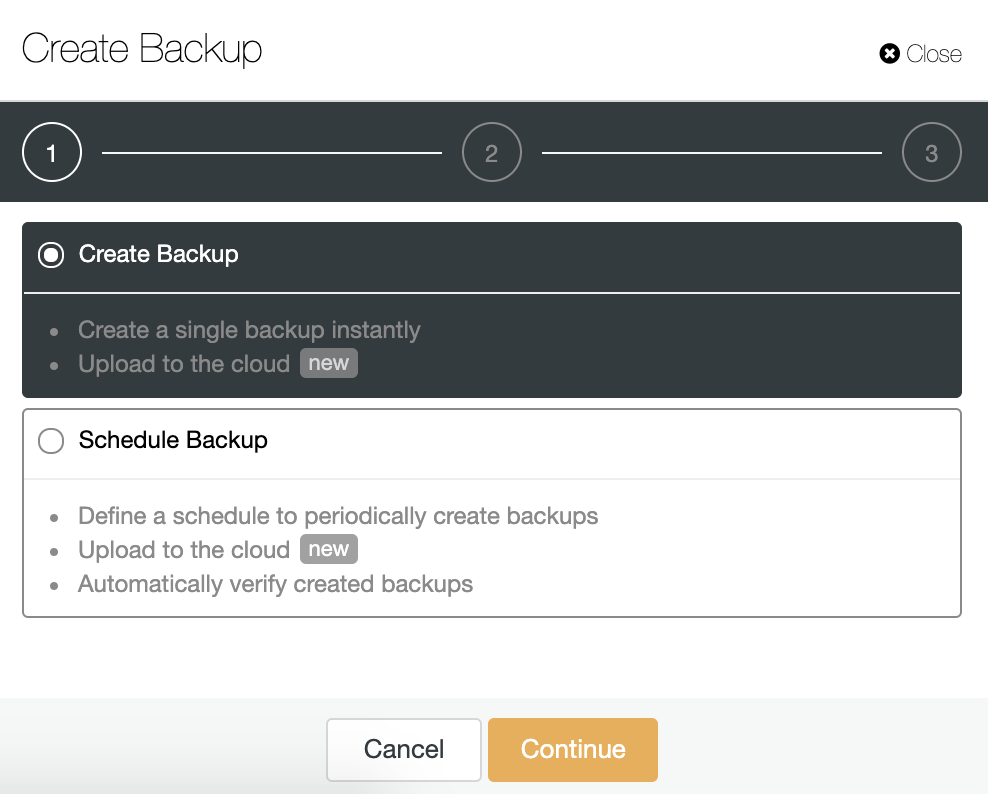
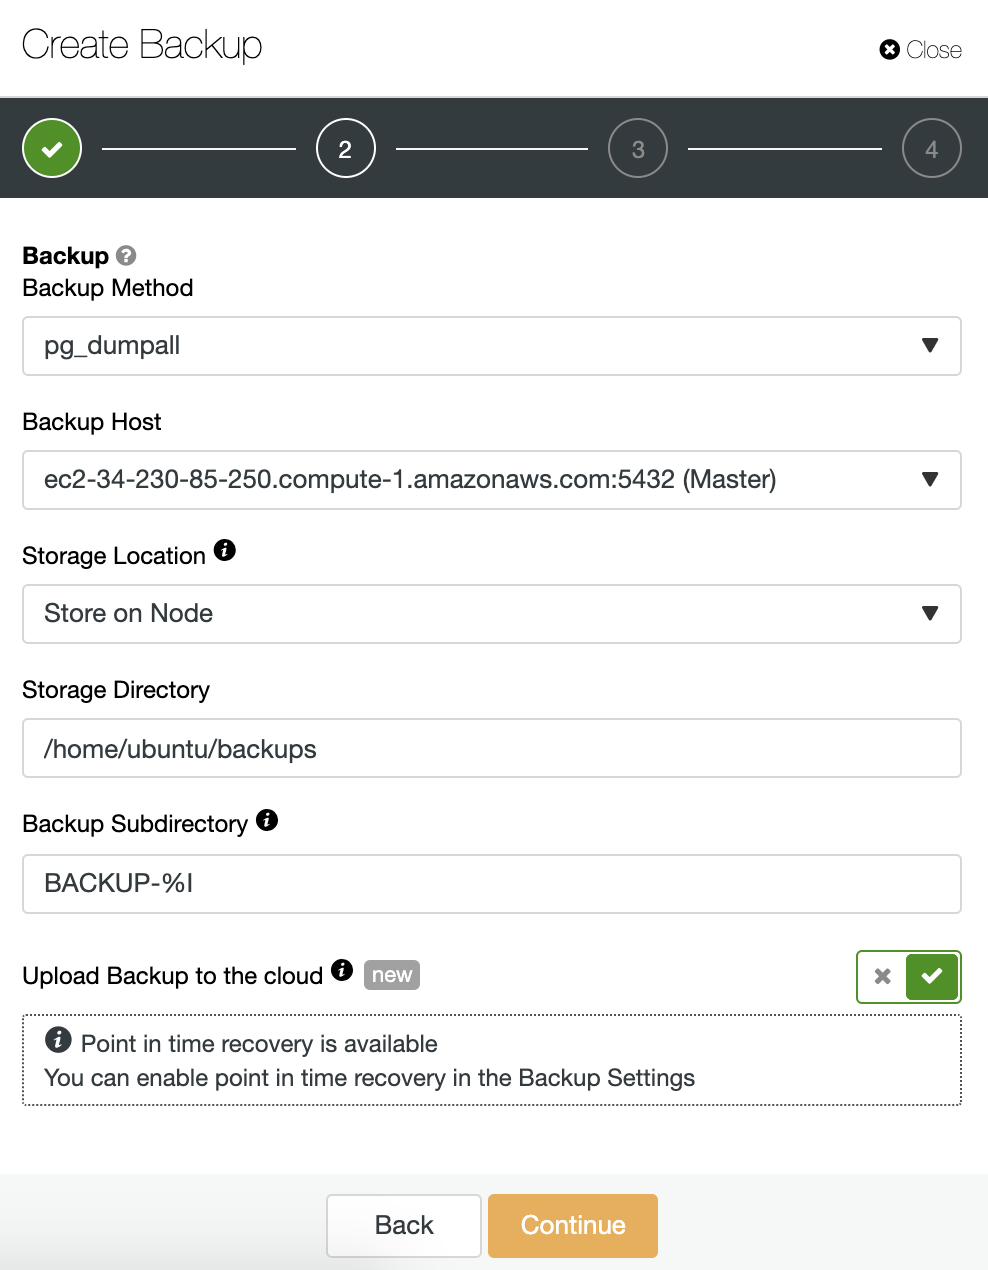
On the other hand, you can also use external services (as well such as ClusterControl) which provides you both monitoring and backup solutions. Check this out if you want to know more.
Database Monitoring on AWS
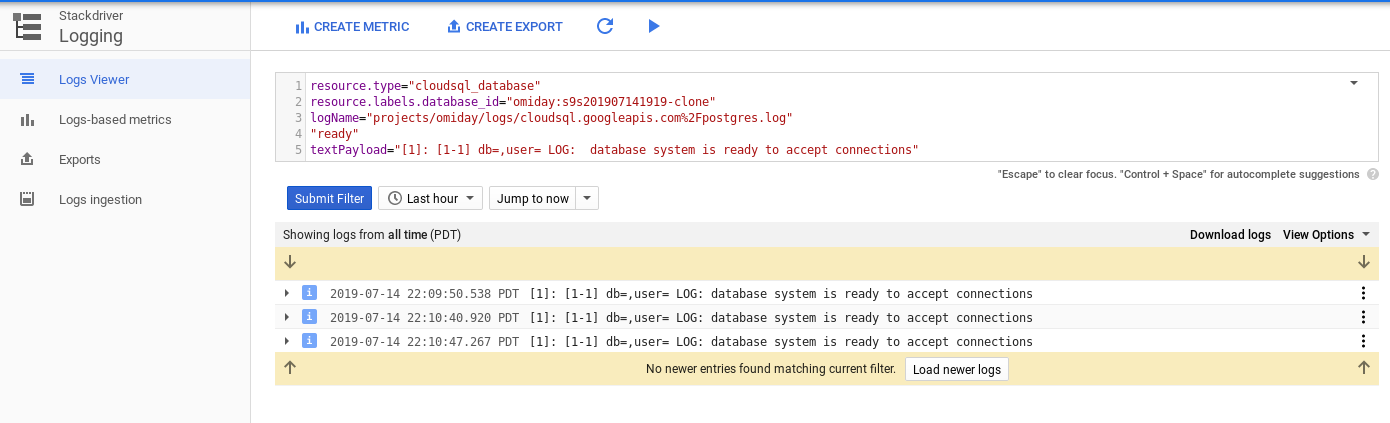
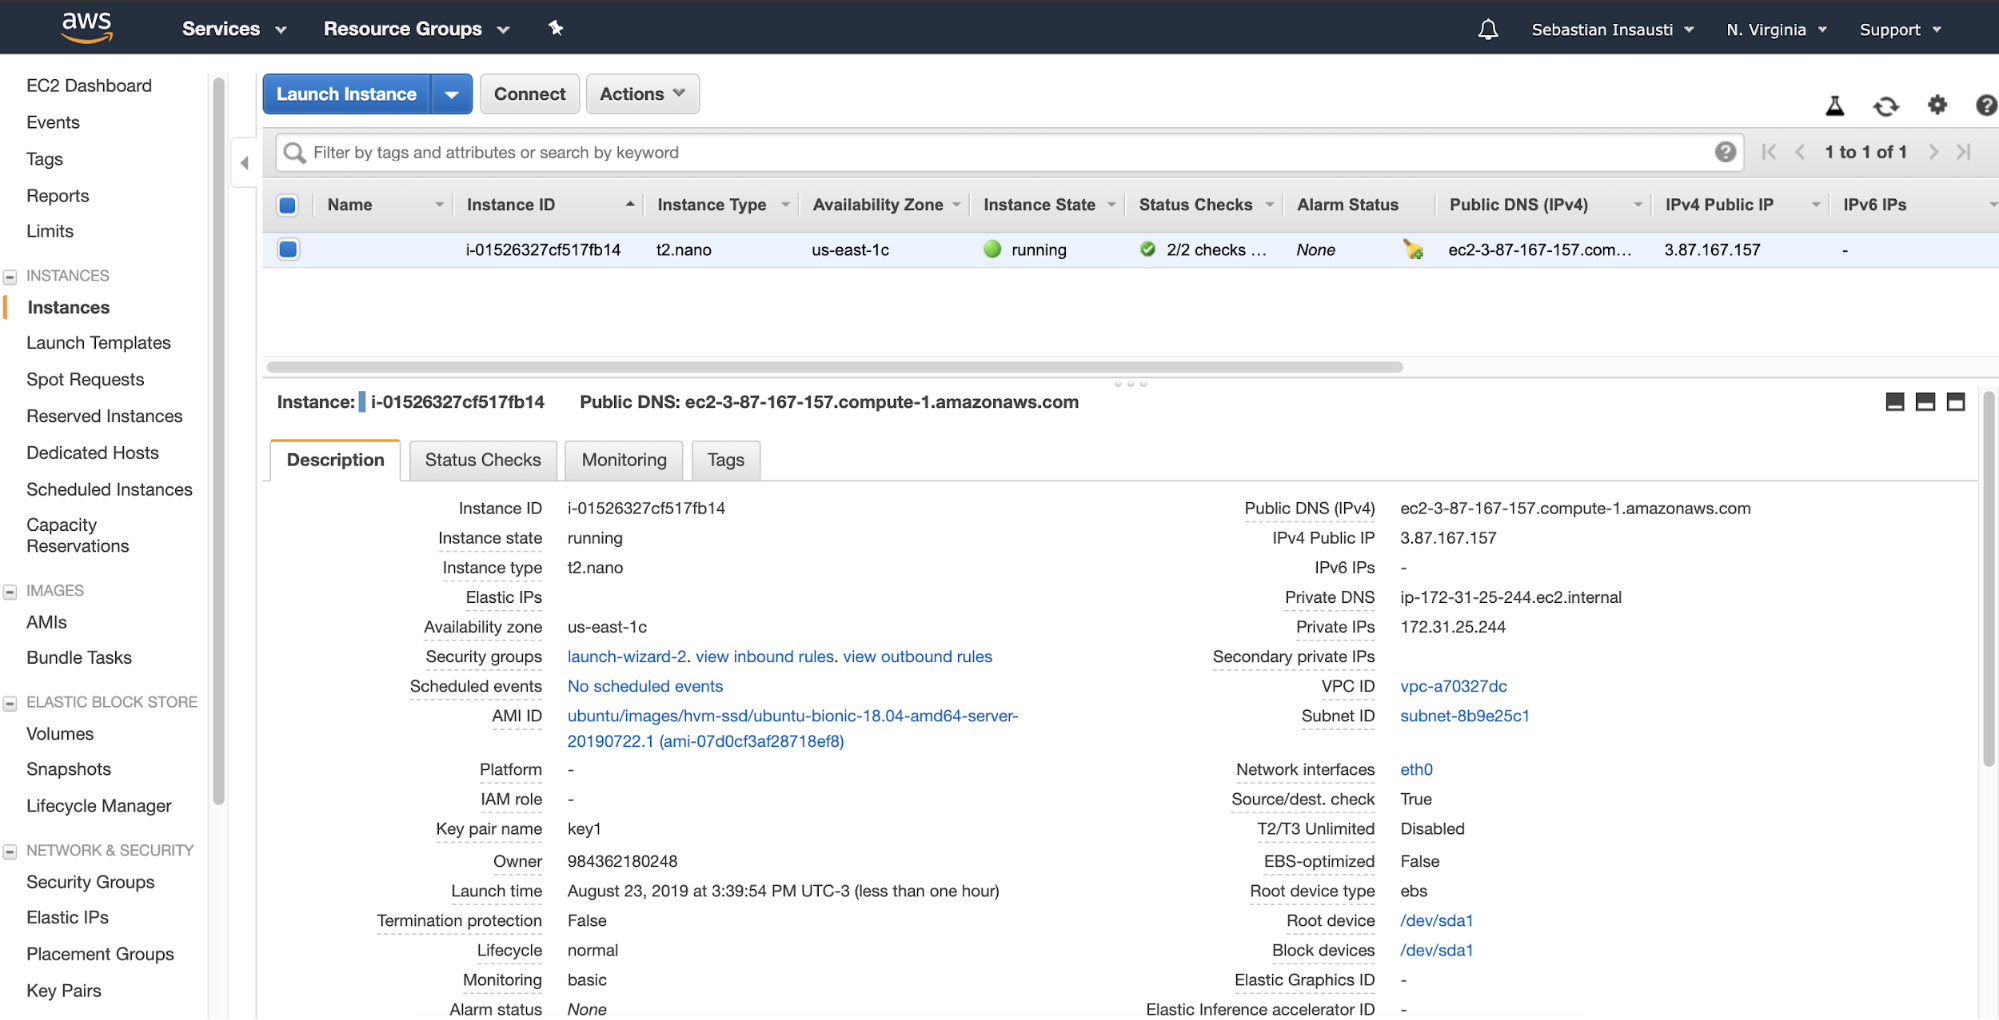
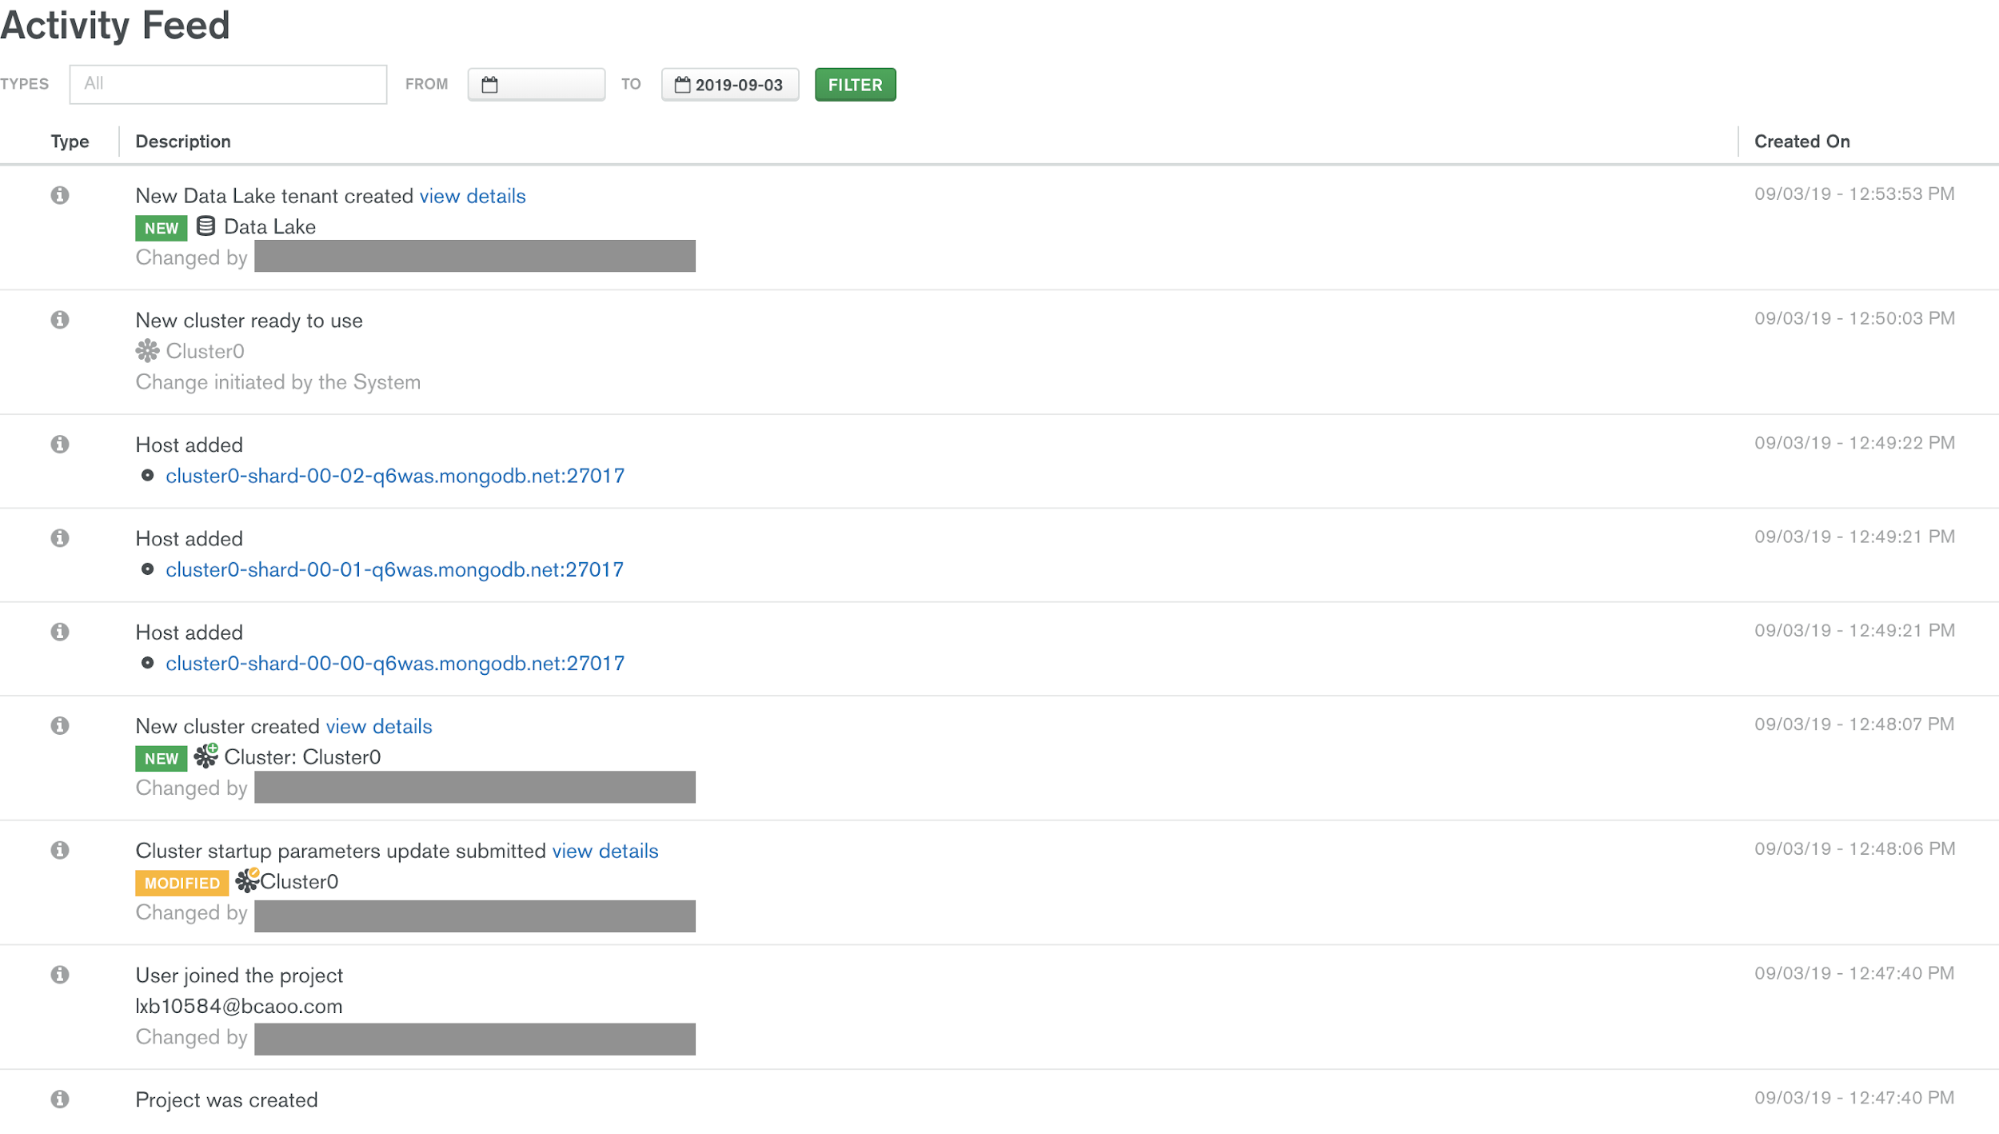
AWS offers health checks and some status checks to provide you visibility into your Galera nodes. This is done through CloudWatch and CloudTrail.
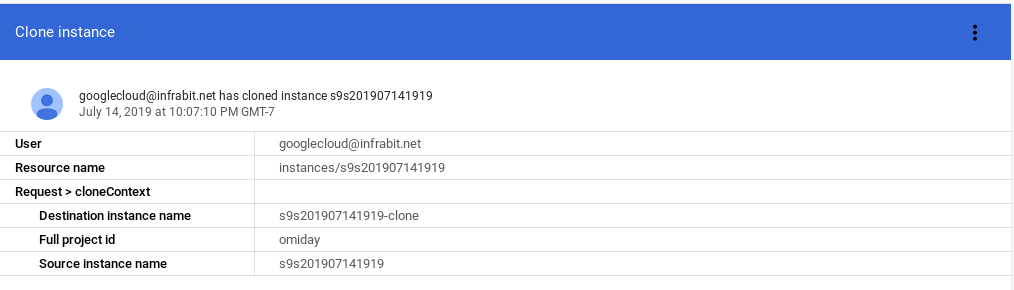
CloudTrail lets you enable and inspect the logs and perform audits based on what actions and traces have been made.
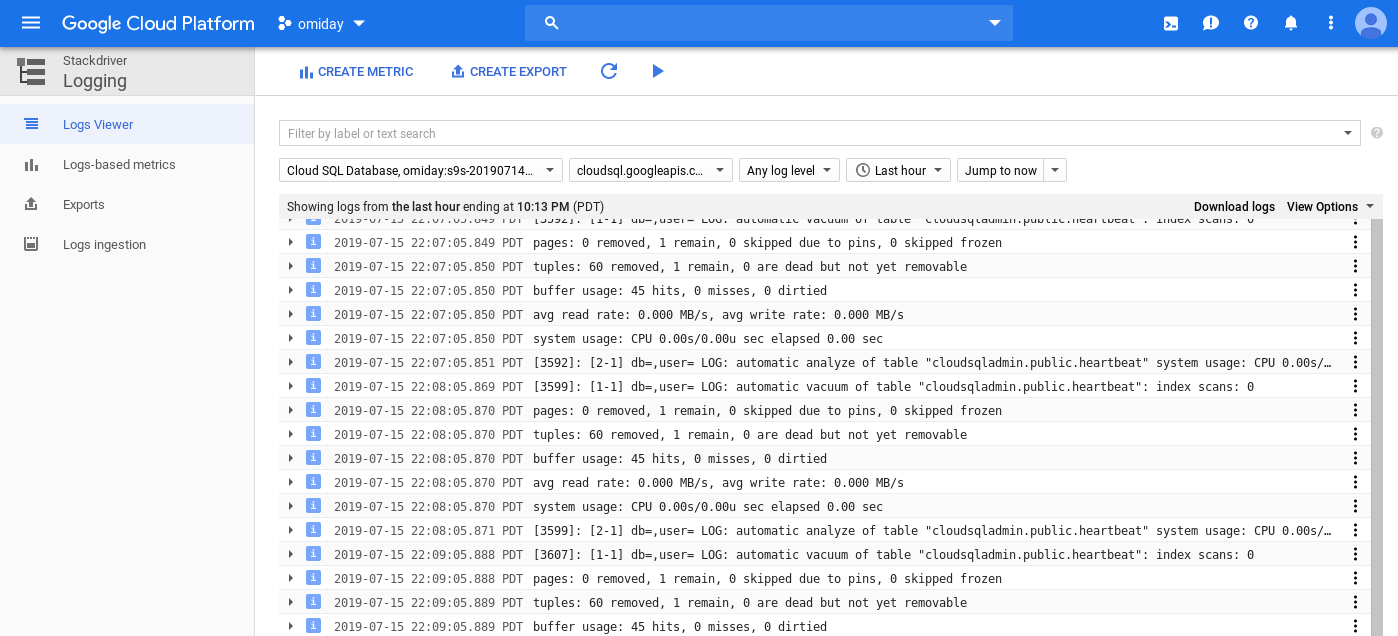
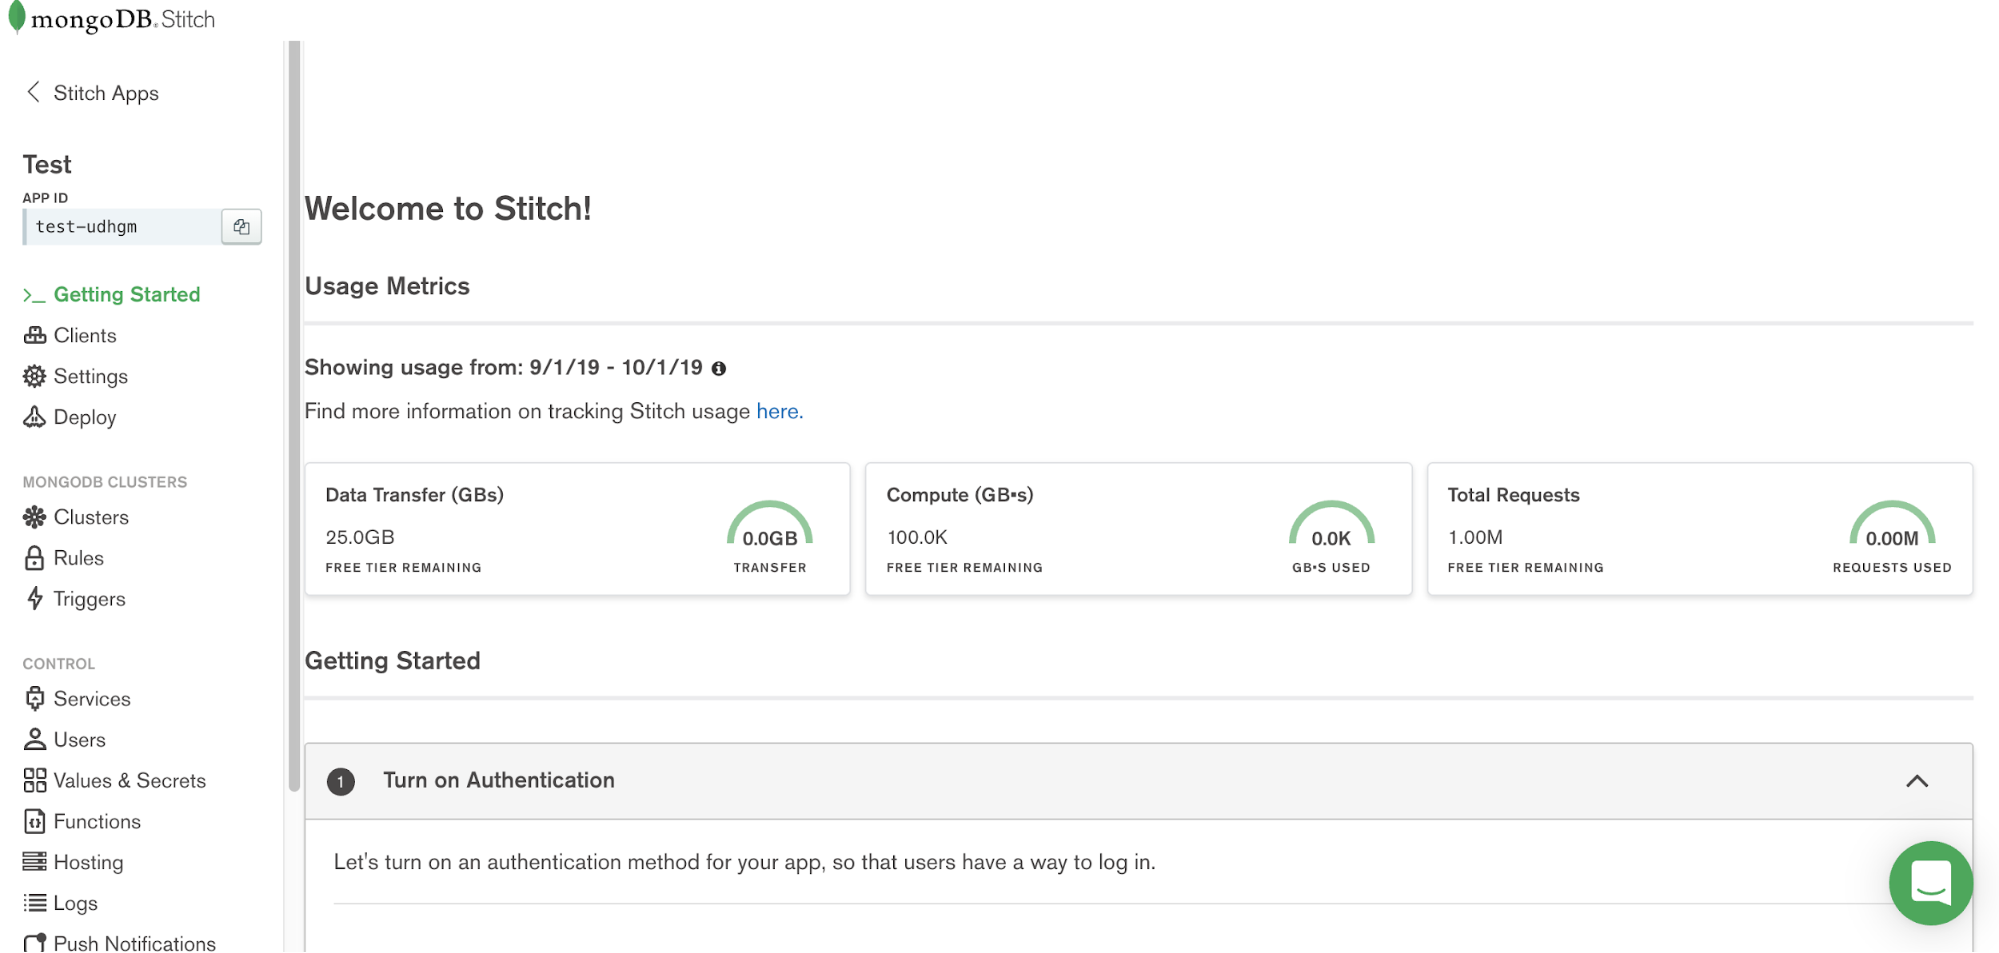
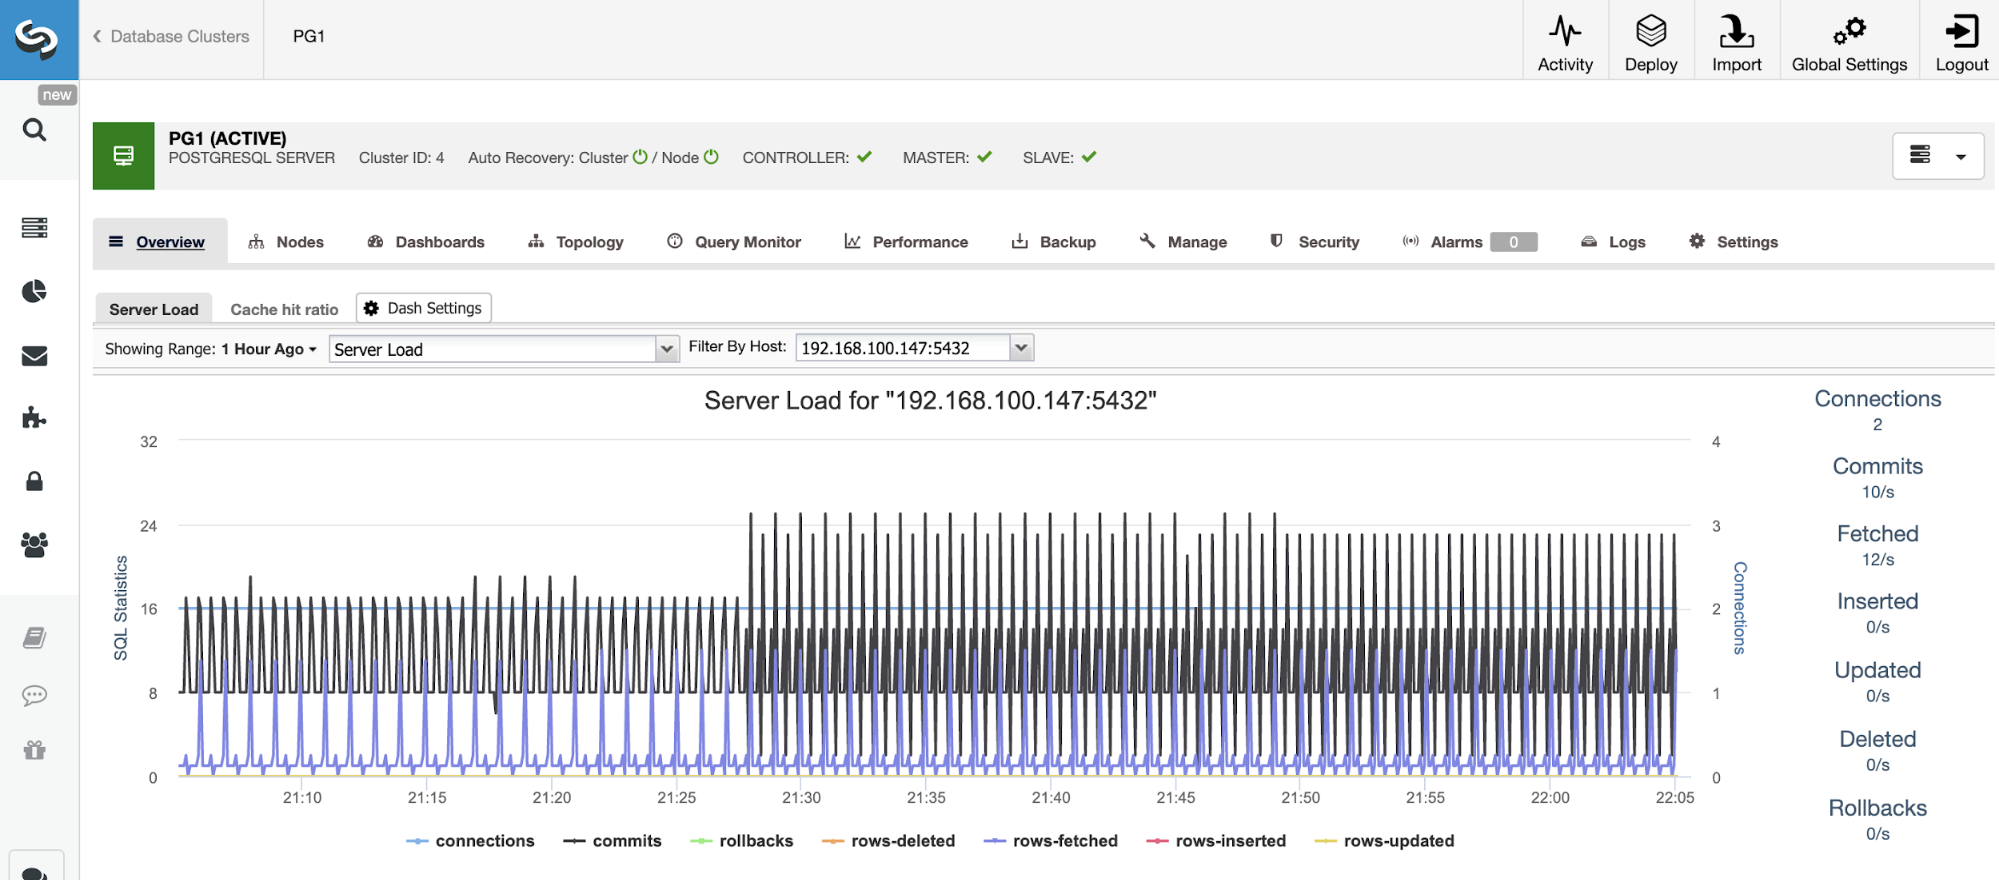
CloudWatch lets you collect and track metrics, collect and monitor log files, and set custom alarms. You can set it up according to your custom needs and gain system-wide visibility into resource utilization, application performance, and operational health. CloudWatch comes with a free tier as long as you still fall within its limits (See the screenshot below.)
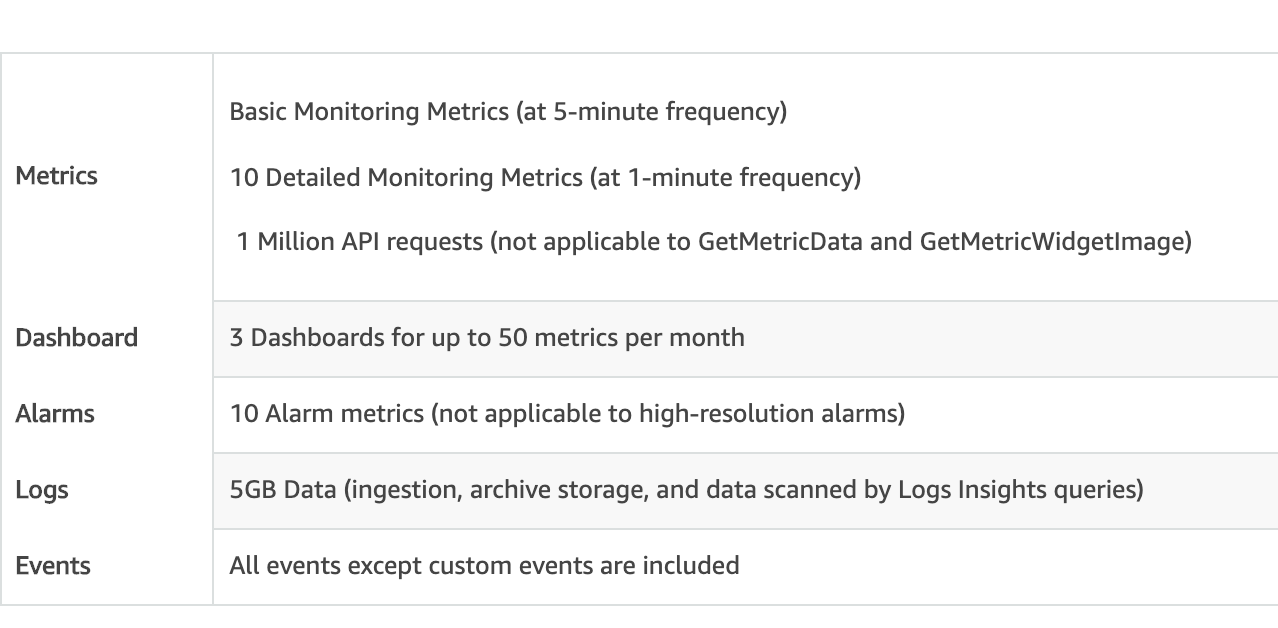
CloudWatch also comes with a price depending on the volume of metrics being distributed. Checkout its current pricing by checking here.
Take note: there's a downside to using CloudWatch. It is not designed to cater to the database health, especially for monitoring MySQL Galera cluster nodes. Alternatively, you can use external tools that offer high-resolution graphs or charts that are useful in reporting and are easier to analyze when diagnosing a problematic node.
For this you can use PMM by Percona, DataDog, Idera, VividCortex, or our very own ClusterControl (as monitoring is FREE with ClusterControl Community.) I would recommend that you use a monitoring tool that suits your needs based on your individual application requirements. It's very important that your monitoring tool be able to notify you aggressively or provide you integration for instant messaging systems such as Slack, PagerDuty or even send you SMS when escalating severe health status.
Database Security on AWS
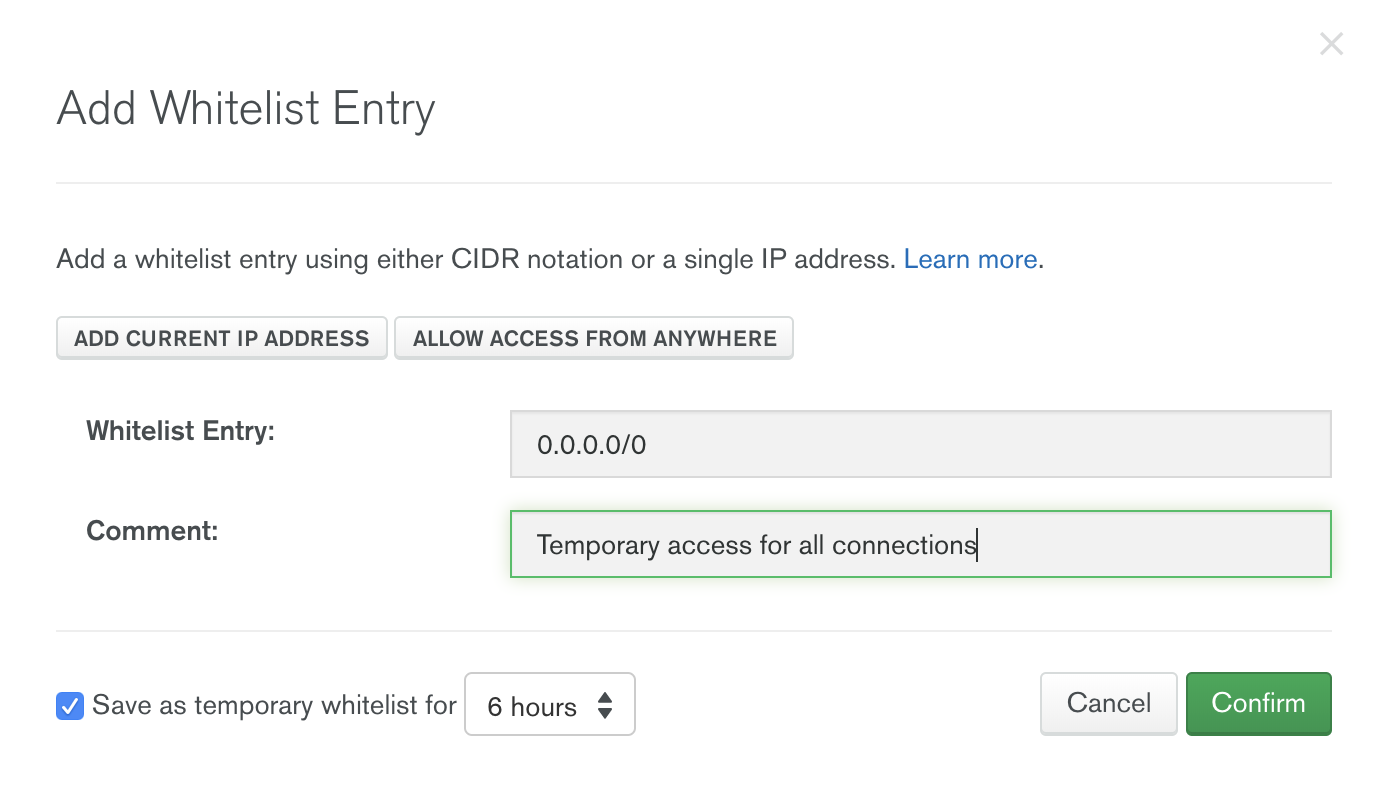
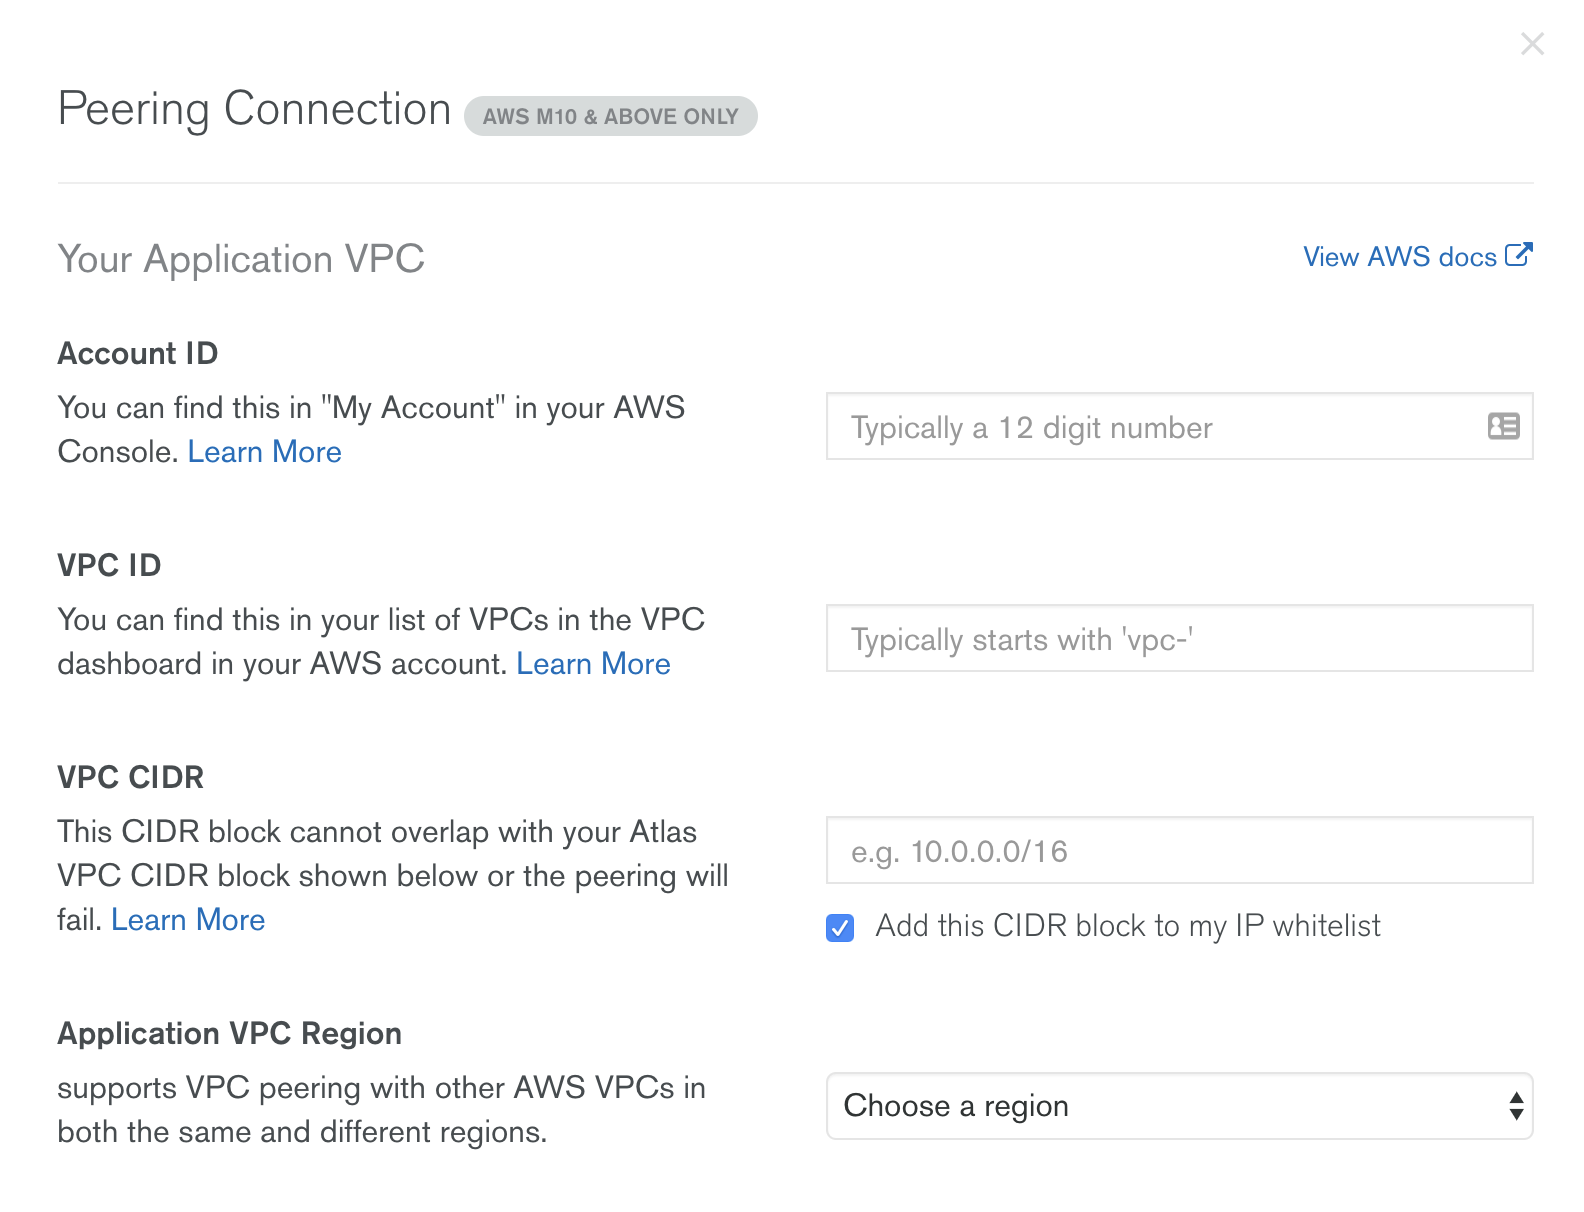
Securing your EC2 instances is one of the most vital parts of deploying your database into the public cloud. You can setup a private subnet and setup the required security groups only favored to allow the port or source IP depending on your setup. You can set your database nodes with a non-remote access and just set up a jump host or an Internet Gateway, if nodes requires to access the internet to access or update software packages. You can read our previous blog Deploying Secure Multicloud MySQL Replication on AWS and GCP with VPN on how we set this up.
In addition to this, you can secure your data in-transit by using TLS/SSL connection or encrypt your data when it's at rest. If you're using ClusterControl, deploying a secure data in-transit is simple and easy. You can check out our blog SSL Key Management and Encryption of MySQL Data in Transit if you want to try out. For data at-rest, storing your data via S3 can be encrypted using AWS Server-Side Encryption or use AWS-KMS which I have discussed earlier. Check this external blog on how to setup and leverage a MariaDB Cluster using AWS-KMS so you can store your data securely at-rest.
Galera Cluster Troubleshooting on AWS
AWS CloudWatch can help especially when investigating and checking out the system metrics. You can check the network, CPU, memory, disk, and it's instance or compute usage and balance. This might not, however, meet your requirements when digging into a specific case.
CloudTrail can perform solid traces of actions that has been governed based on your specific AWS account. This will help you determine if the occurrences aren't coming from MySQL Galera, but might be some bug or issues within the AWS environment (such as Hyper-V is having issues within the host machine where your instance, as the guest, is being hosted.)
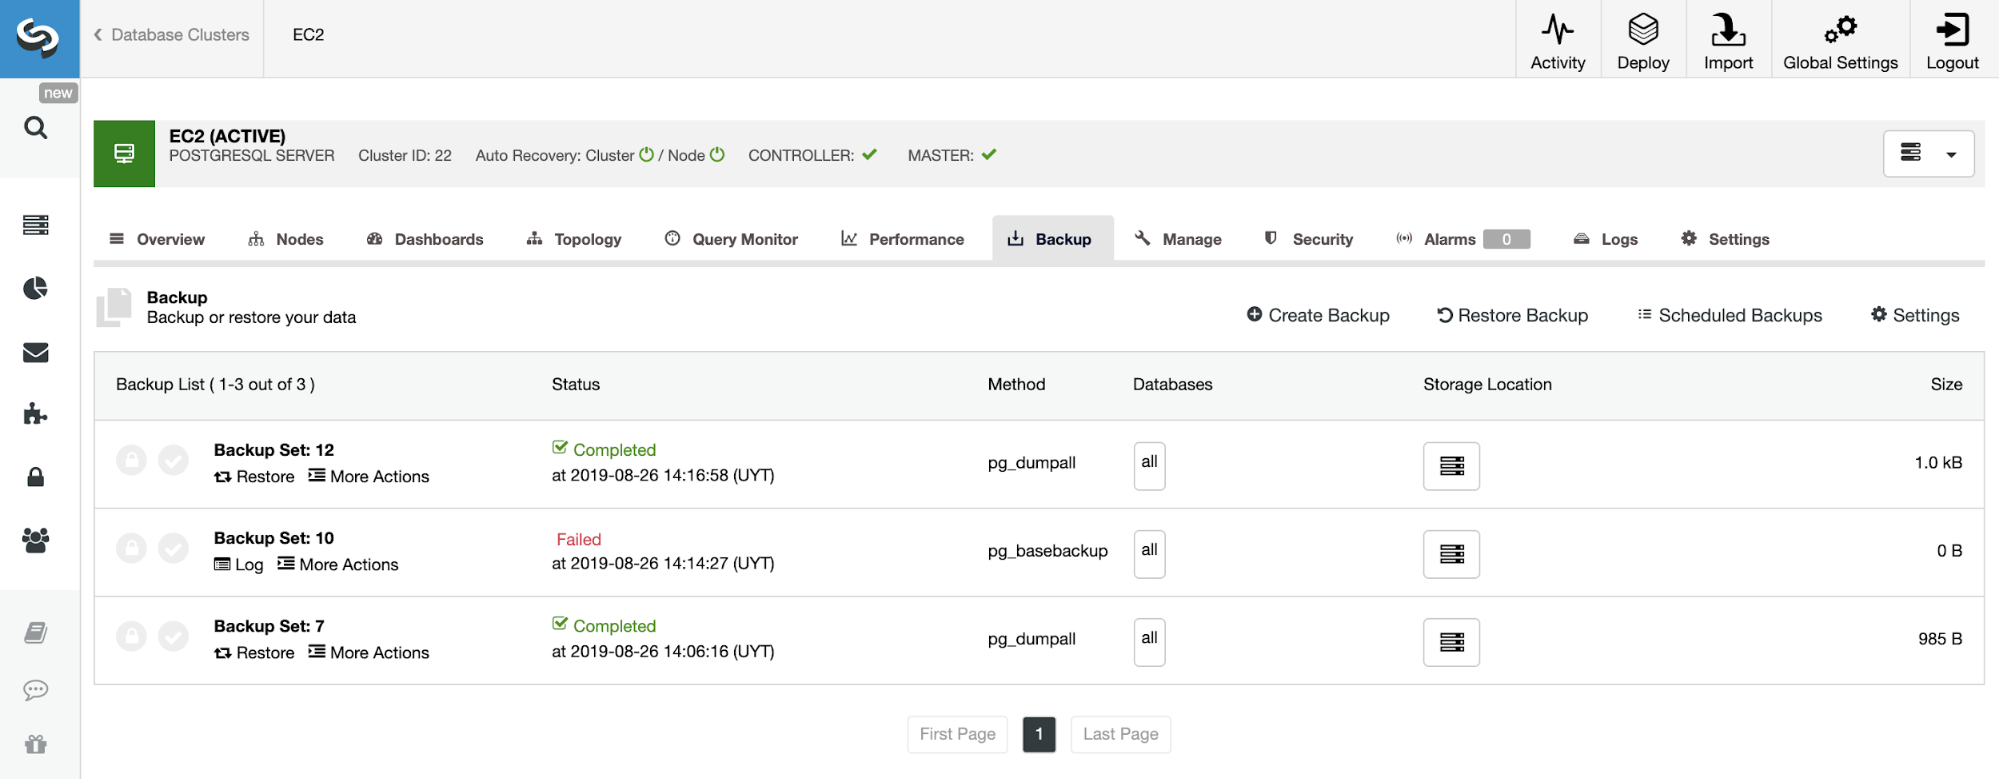
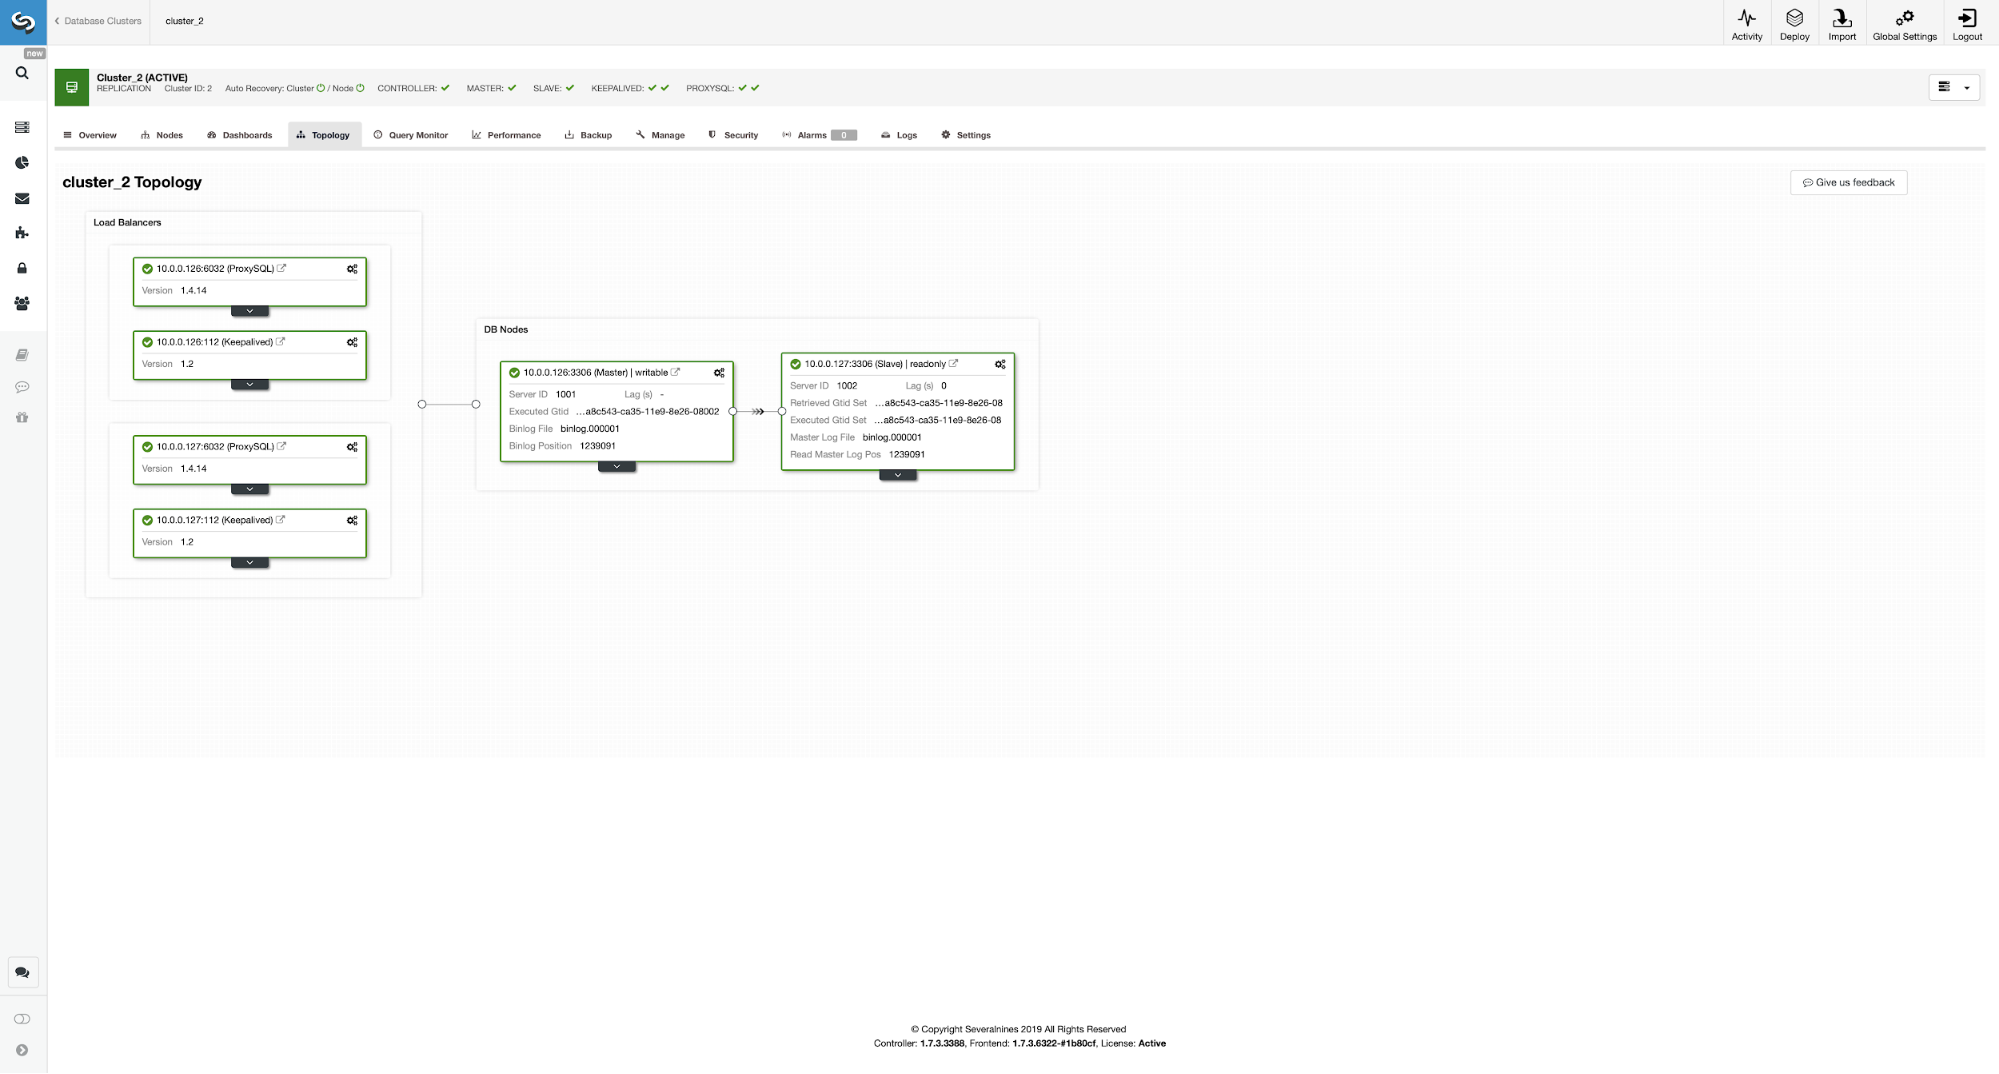
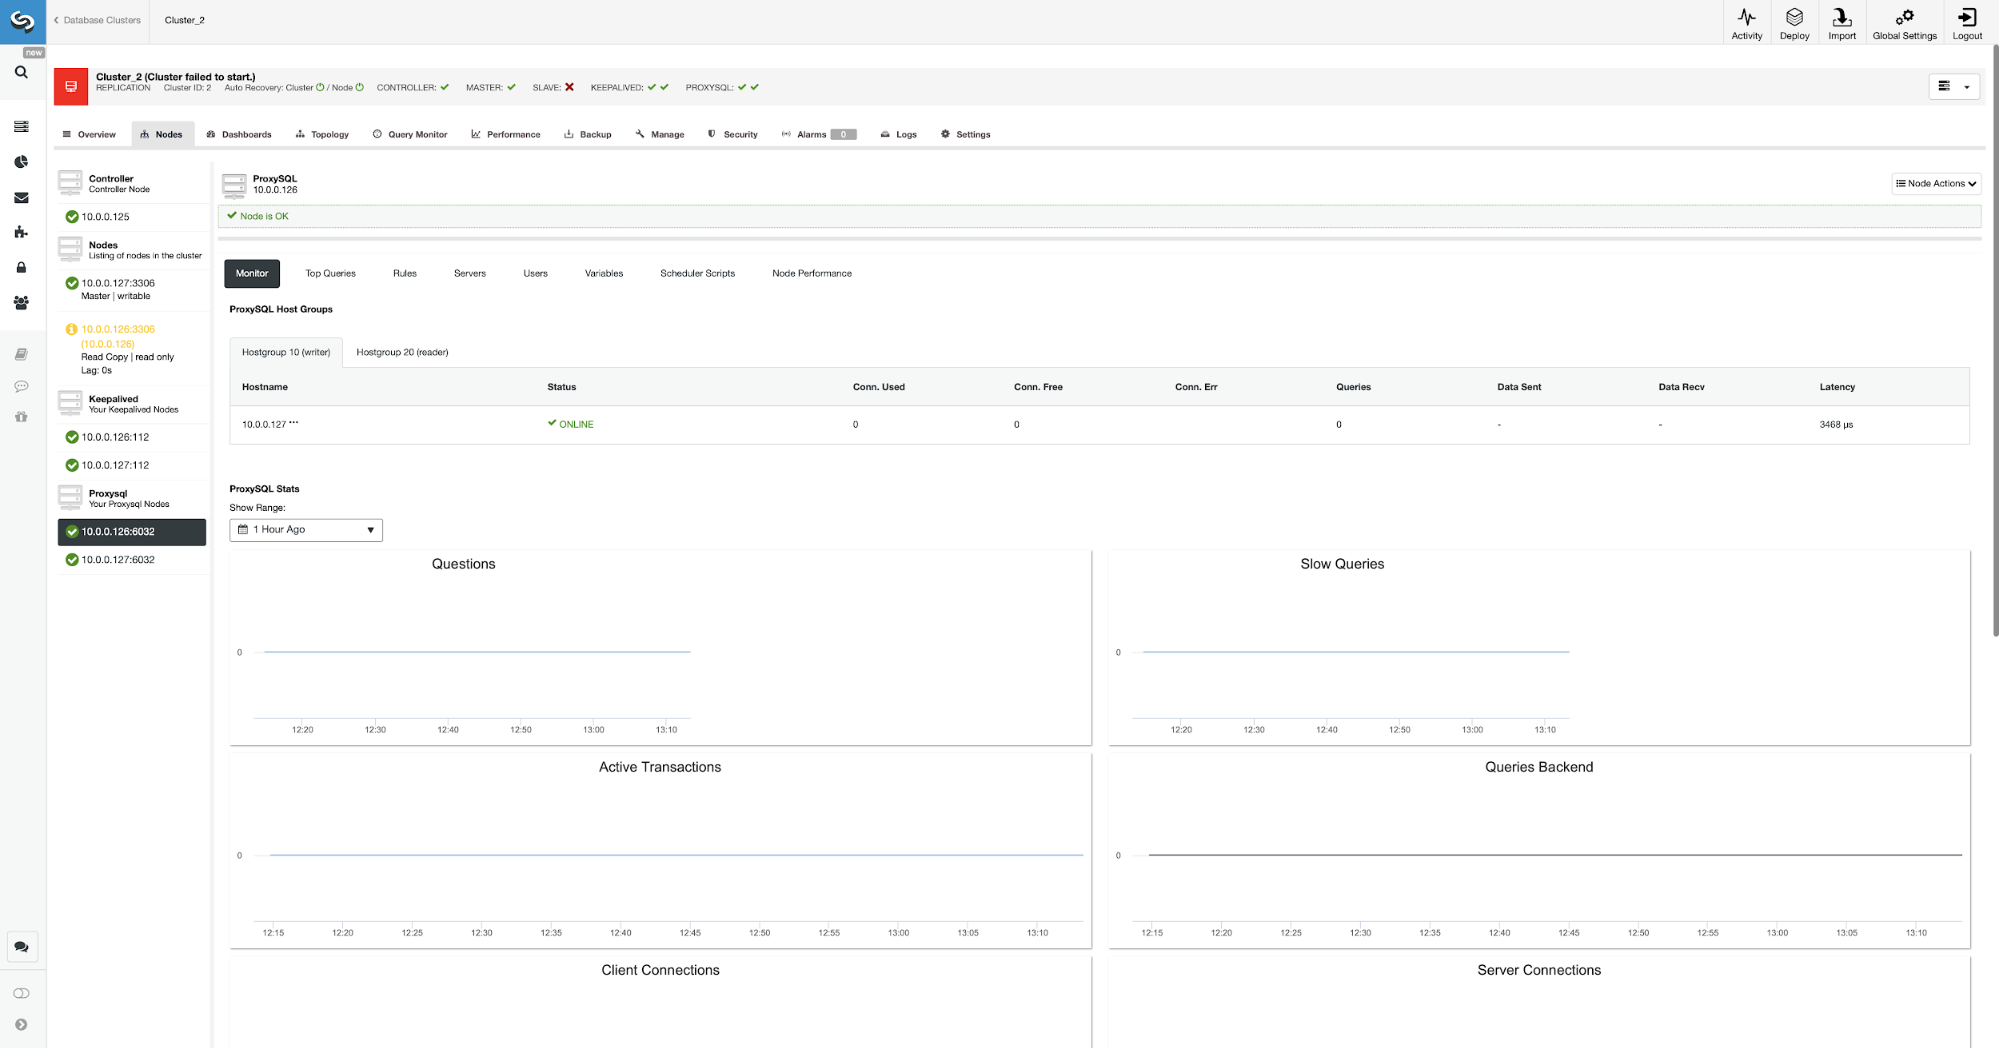
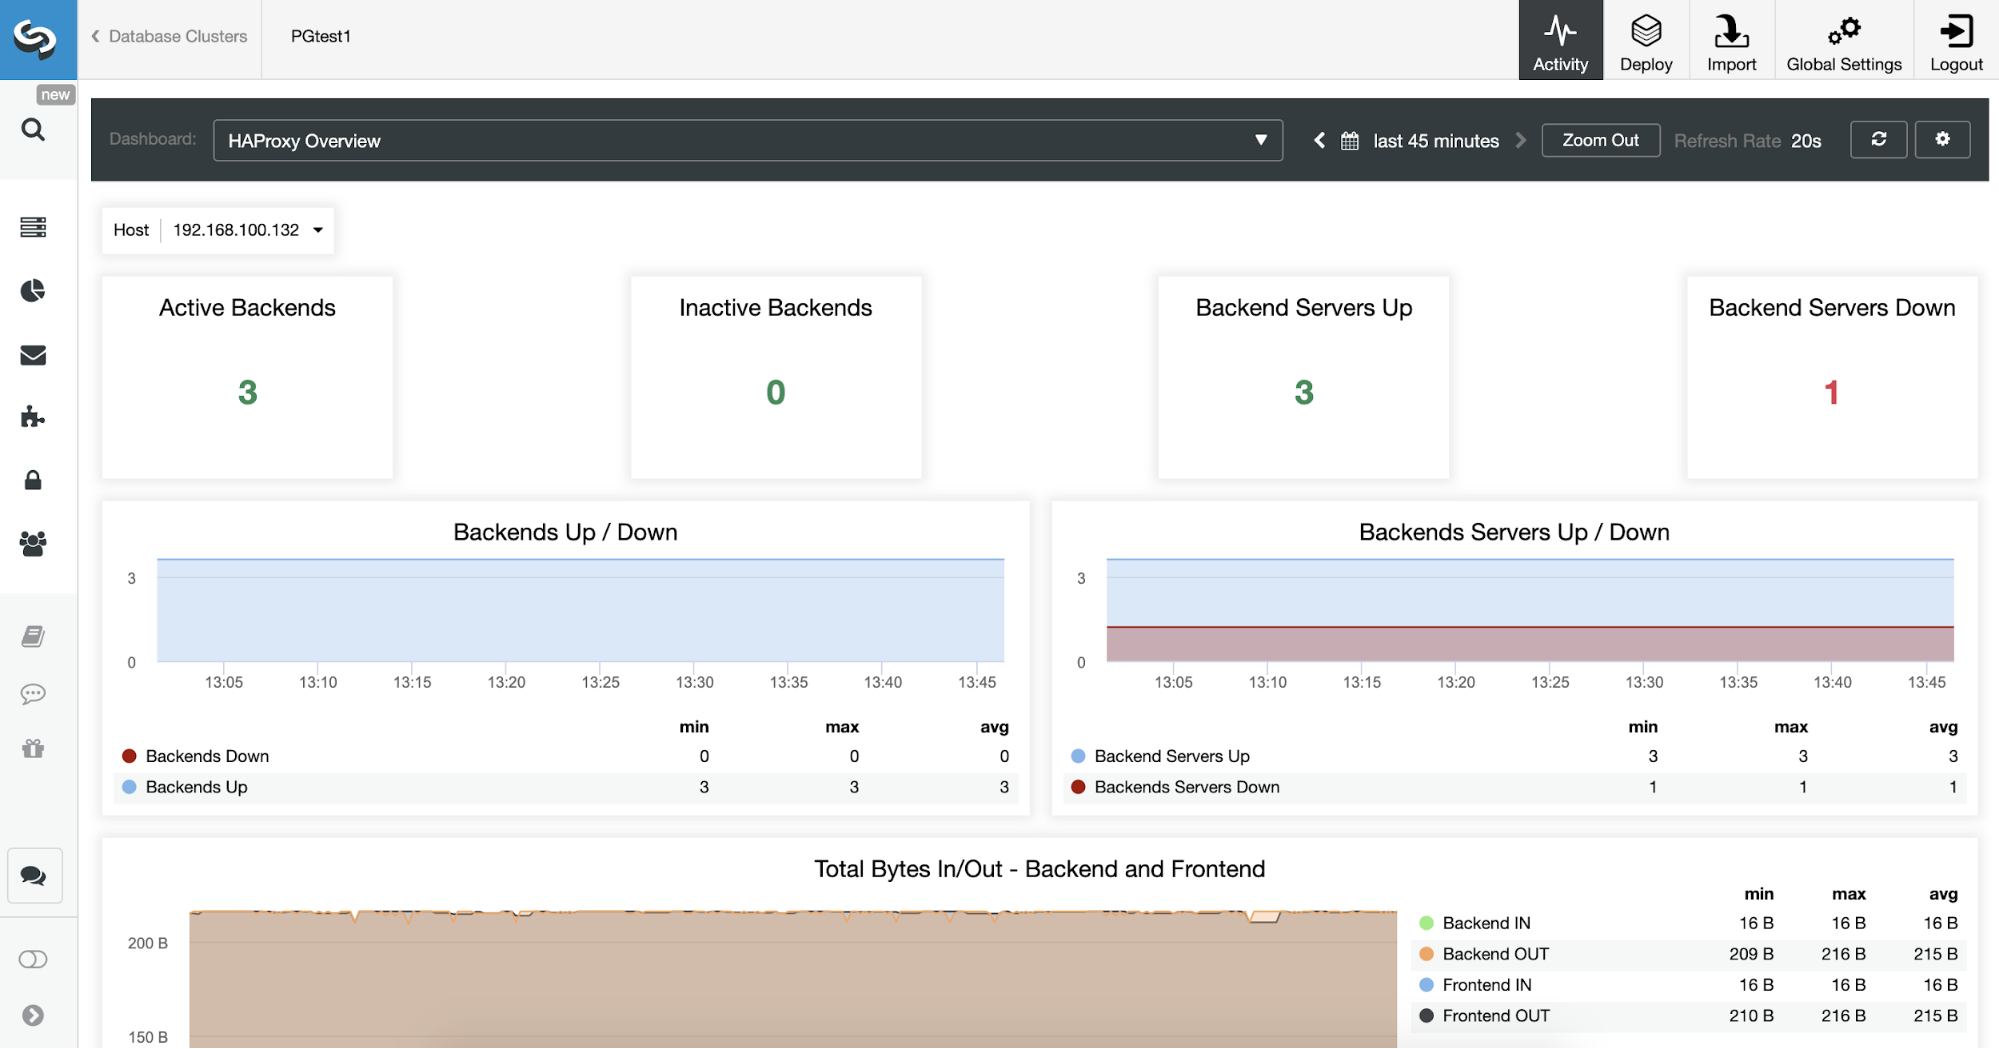
If you're using ClusterControl, going to Logs -> System Logs, you'll be able to browse the captured error logs taken from the MySQL Galera node itself. Apart from this, ClusterControl provides real-time monitoring that would amplify your alarm and notification system in case an emergency or if your MySQL Galera node(s) is kaput.
Conclusion
AWS does not have pure support for a MySQL Galera Cluster setup, unlike AWS RDS which has MySQL compatibility. Because of this most of the recommendations or opinions running a Galera Cluster for production use within the AWS environment are based on experienced and well-tested environments that have been running for a very long time.
MariaDB Cluster comes with a great productivity, as they constantly provide concise support for the AWS technology stack solution. In the upcoming release of MariaDB 10.5 version, they will offer a support for S3 Storage Engine, which may be worth the wait.
External tools can help you manage and control your MySQL Galera Cluster running on the AWS Cloud, so it's not a huge concern if you have some dilemmas and FUD on why you should run or shift to the AWS Cloud Platform.
AWS might not be the one-size-fits-all solution in some cases, but it provides a wide-array of solutions that you can customize and tailor it to fit your needs.
In the next part of our blog, we'll look at another public cloud platform, particularly Google Cloud and see how we can leverage if we choose to run our Galera Cluster into their platform.