Key Things to Monitor in PostgreSQL - Analyzing Your Workload
In computer systems, monitoring is the process of gathering metrics, analyzing, computing statistics and generating summaries and graphs regarding the performance or the capacity of a system, as well as generating alerts in case of unexpected problems or failures which require immediate attention or action. Therefore, monitoring has two uses: one for historic data analysis and presentation which help us identify medium and long term trends within our system and thus help us plan for upgrades, and a second one for immediate action in case of trouble.
Monitoring helps us identify problems and react to those problems concerning a wide range of fields such as:
- Infrastructure/Hardware (physical or virtual)
- Network
- Storage
- System Software
- Application Software
- Security
Monitoring is a major part of the work of a DBA. PostgreSQL, traditionally, has been known to be “low-maintenance” thanks to its sophisticated design and this means that the system can live with low attendance when compared to other alternatives. However, for serious installations where high availability and performance are of key importance, the database system has to be regularly monitored.
The role of the PostgreSQL DBA can step up to higher levels within the company’s hierarchy besides strictly technical: apart from basic monitoring and performance analysis, must be able to spot changes in usage patterns, identify the possible causes, verify the assumptions and finally translate the findings in business terms. As an example, the DBA must be able to identify some sudden change in a certain activity that might be linked to a possible security threat. So the role of the PostgreSQL DBA is a key role within the company, and must work closely with other departmental heads in order to identify and solve problems that arise. Monitoring is a great part of this responsibility.
PostgreSQL provides many out of the box tools to help us gather and analyze data. In addition, due to its extensibility, it provides the means to develop new modules into the core system.
PostgreSQL is highly dependent on the system (hardware and software) it runs on. We cannot expect a PostgreSQL server to perform good if there are problems in any of the vital components in the rest of the system. So the role of the PostgreSQL DBA overlaps with the role of the sysadmin. Below, as we examine what to watch in PostgreSQL monitoring, we will encounter both system-dependent variables and metrics as well as PostgreSQL’s specific figures.
Monitoring does not come for free. A good investment must be put in it by the company/organization with a commitment to manage and maintain the whole monitoring process. It also adds a slight load on the PostgreSQL server as well. This is little to worry about if everything is configured correctly, but we must keep in mind that this can be another way to misuse the system.
System Monitoring Basics
Important variables in System monitoring are:
- CPU Usage
- Network Usage
- Disk Space / Disk Utilization
- RAM Usage
- Disk IOPS
- Swap space usage
- Network Errors
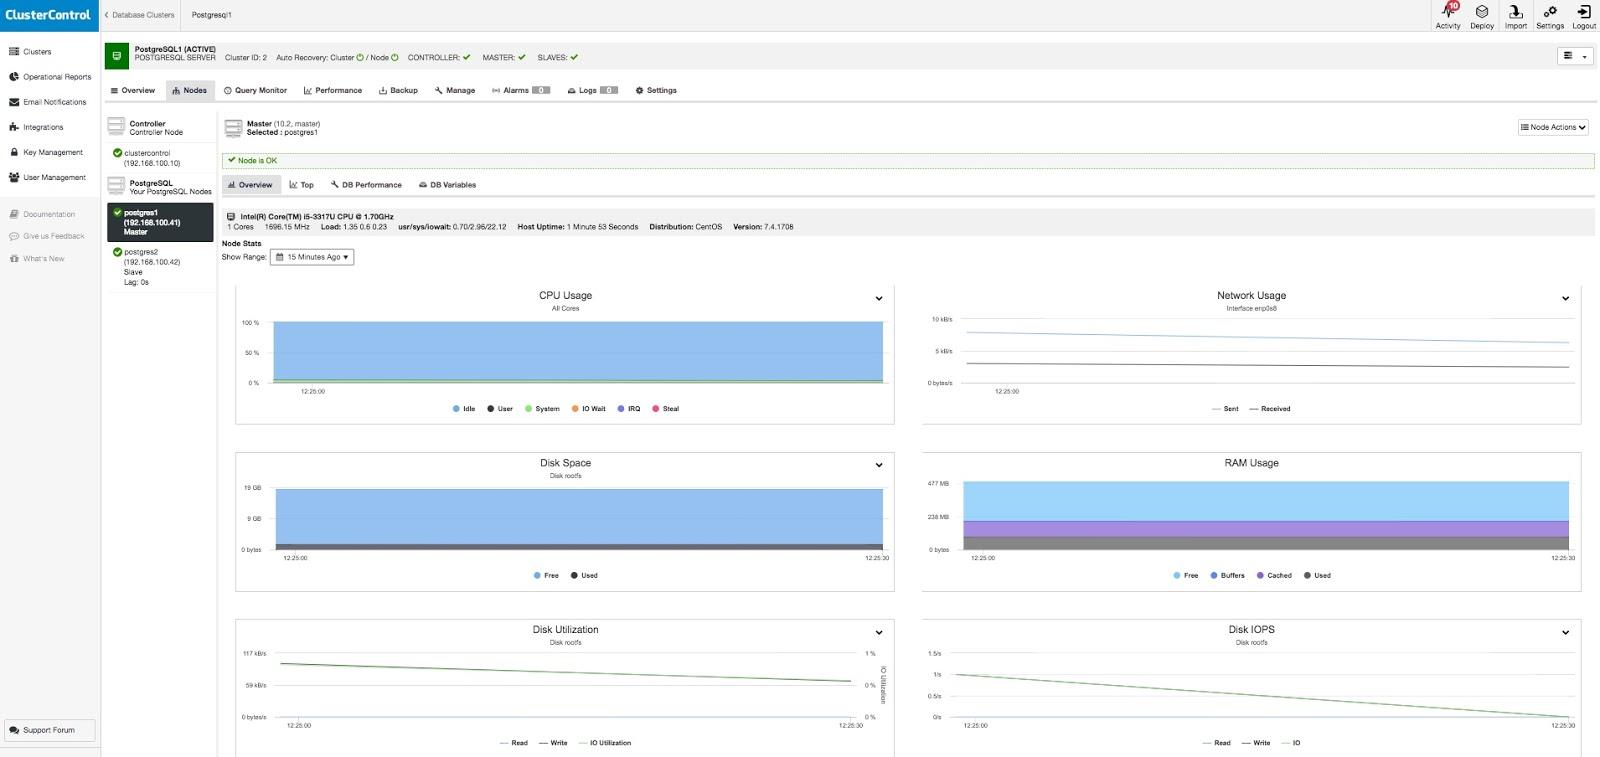
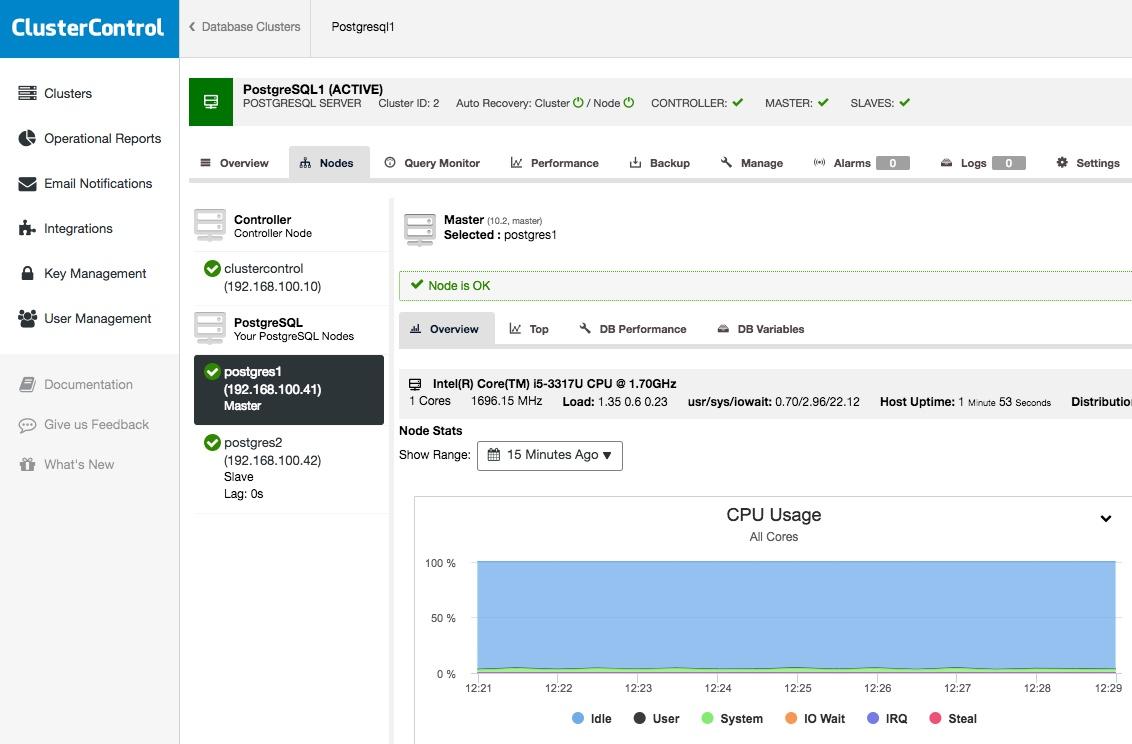
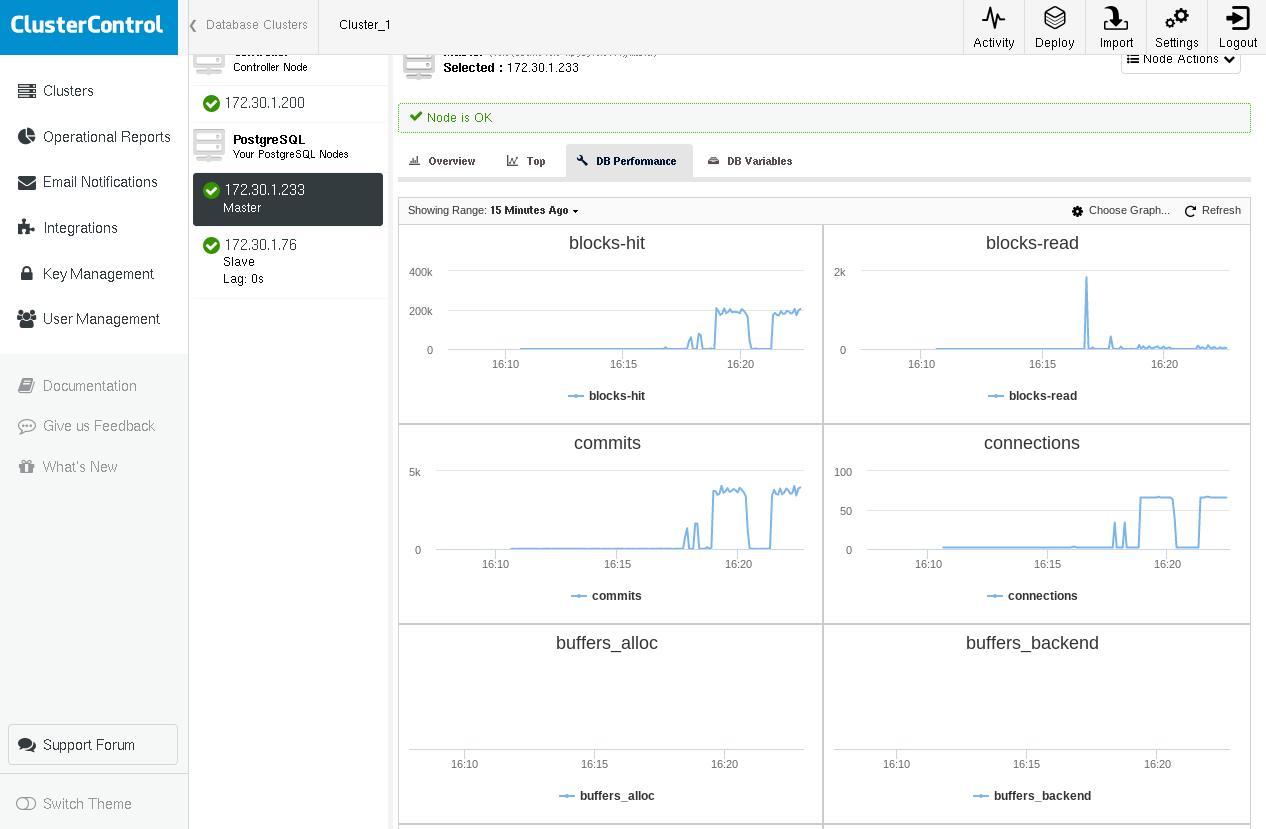
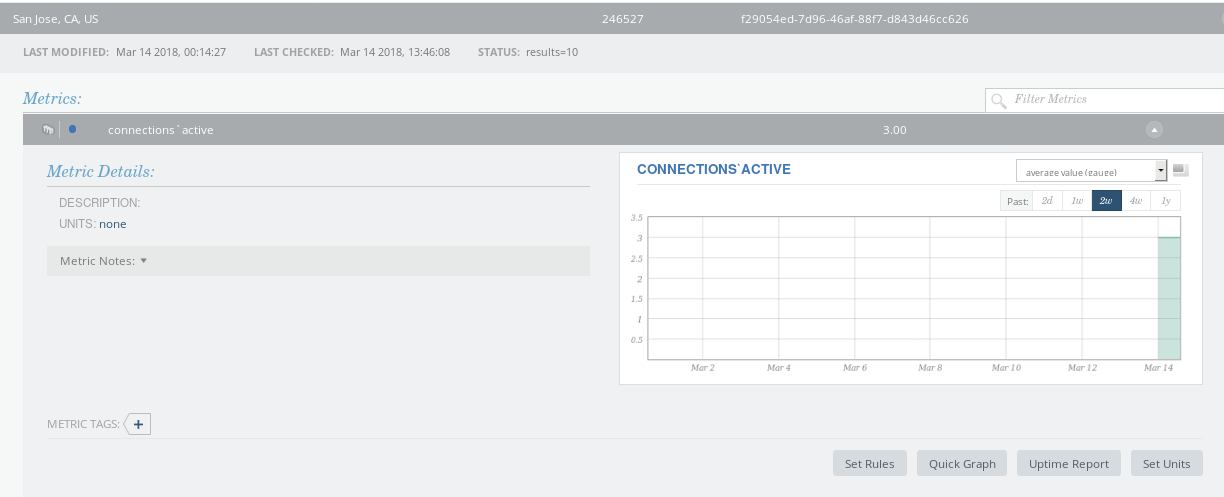
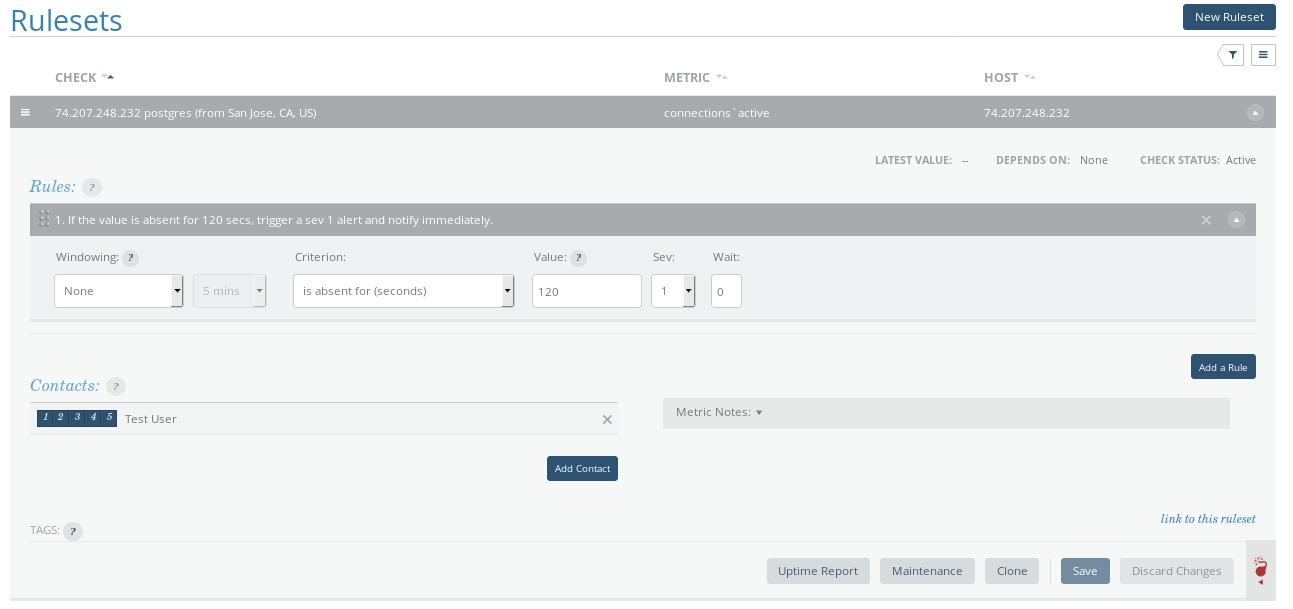
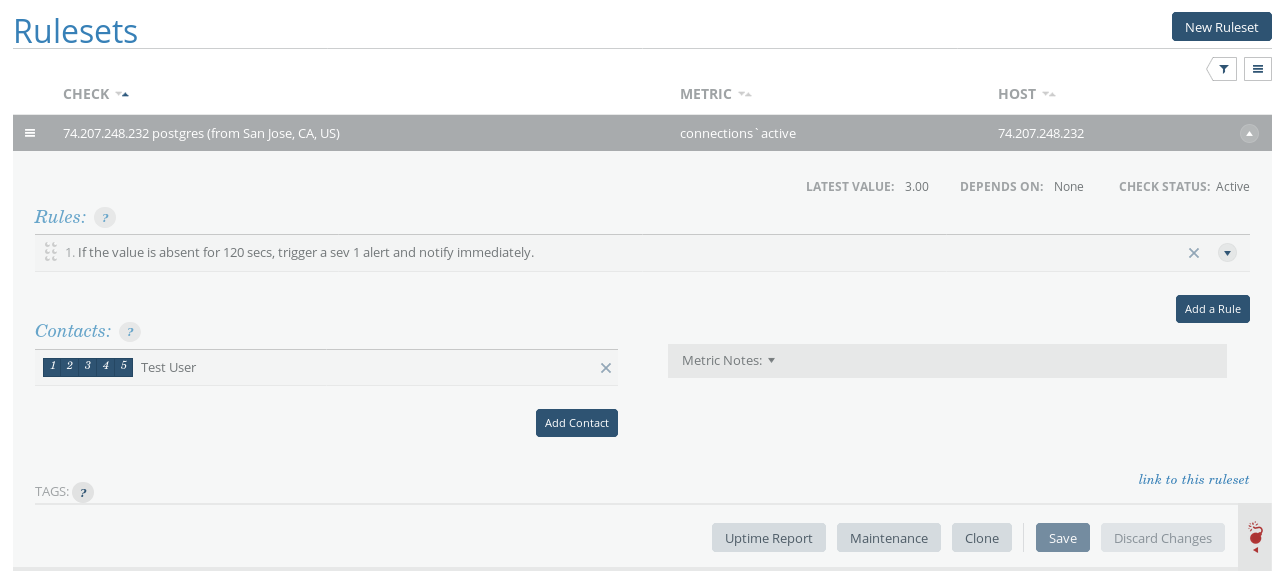
Here is an example of ClusterControl showing graphs for some critical PostgreSQL variables coming from pg_stat_database and pg_stat_bgwriter (which we will cover in the following paragraphs) while running pgbench -c 64 -t 1000 pgbench twice:
We notice that we have a peak on blocks-read in the first run, but we get close to zero during the second run as all blocks are found in shared_buffers.
Other variables of interest are paging activity, interrupts, context switches, among others. There is a plethora of tools to use in Linux/BSDs and unix or unix-like systems. Some of them are:
ps: for a list of the processes running
top/htop/systat: for system (CPU / memory) utilization monitoring
vmstat: for general system activity (including virtual memory) monitoring
iostat/iotop/top -mio: for IO monitoring
ntop: for network monitoring
Here is an example of vmstat on a FreeBSD box during a query which requires some disk reads and also some computation:
procs  memory      page                         disks      faults          cpu
r b w  avm   fre   flt   re  pi  po   fr    sr  ad0 ad1  in     sy    cs us sy id
0 0 0  98G  666M   421   0   0   0   170  2281    5  0  538   6361  2593  1  1 97
0 0 0  98G  665M   141   0   0   0     0  2288   13  0  622  11055  3748  3  2 94
--- query starts here ---
0 0 0  98G  608M   622   0   0   0   166  2287 1072  0 1883  16496 12202  3  2 94
0 0 0  98G  394M   101   0   0   0     2  2284 4578  0 5815  24236 39205  3  5 92
2 0 0  98G  224M  4861   0   0   0  1711  2287 3588  0 4806  24370 31504  4  6 91
0 0 0  98G  546M    84 188   0   0 39052 41183 2832  0 4017  26007 27131  5  7 88
2 0 0  98G  469M   418   0   0   1   397  2289 1590  0 2356  11789 15030  2  2 96
0 0 0  98G  339M   112   0   0   0   348  2300 2852  0 3858  17250 25249  3  4 93
--- query ends here ---
1 0 0  98G  332M  1622   0   0   0   213  2289    4  0  531   6929  2502  3  2 95
Repeating the query we would not notice any new burst in disk activity since those blocks of disk would already be in the OS’s cache. Although, the PostgreSQL DBA must be able to fully understand what is happening in the underlying infrastructure where the database runs, more complex system monitoring is usually a job for the sysadmin, as this is a large topic in itself.
In linux, a very handy shortcut for the top utility is pressing “C”, which toggles showing the command line of the processes. PostgreSQL by default rewrites the command line of the backends with the actual SQL activity they are running at the moment and also the user.
PostgreSQL Monitoring Basics
Important variables in PostgreSQL monitoring are:
- Buffer cache performance (cache hits vs disk reads)
- Number of commits
- Number of connections
- Number of sessions
- Checkpoints and bgwriter statistics
- Vacuums
- Locks
- Replication
- And last but definitely not least, queries
Generally there are two ways in a monitoring setup to perform data collection:
- To acquire data via a Log
- To acquire data by querying PostgreSQL system
Log file-based data acquisition depends on the (properly configured) PostgreSQL log. We can use this kind of logging for “off-line” processing of the data. Log file-based monitoring is best suited when minimal overhead to the PostgreSQL server is required and when we don’t care about live data or about getting live alerts (although live monitoring using log file data can be possible by e.g. directing postgresql log to syslog and then streaming syslog to another server dedicated for log processing).
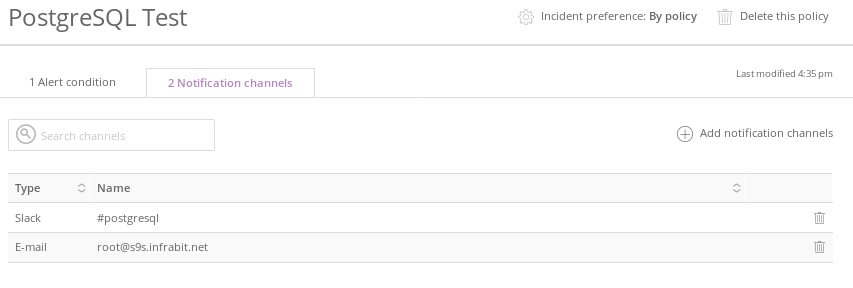
Single Console for Your Entire Database Infrastructure
Find out what else is new in ClusterControl
PostgreSQL Statistics Collector
PostgreSQL provides a rich set of views and functions readily available via the Statistics Collector subsystem. Again those data are divided in two categories:
- Dynamic information on what the system is doing at the moment.
- Statistics accumulated since the statistics collector subsystem was last reset.
Dynamic statistics views provide info about current activity per process (pg_stat_activity), status of physical replication (pg_stat_replication), status of physical standby (pg_stat_wal_receiver) or logical (pg_stat_subscription), ssl (pg_stat_ssl) and vacuum (pg_stat_progress_vacuum).
Collected statistics views provide info about important background processes such as the wal archiver, the bgwriter, and database objects: user or system tables, indexes, sequences and functions as well as the databases themselves.
It should be quite obvious by now that there are multiple ways to categorize data related to monitoring:
- By source:
- System tools (ps, top, iotop, etc)
- PgSQL Log file
- Database
- By specific database operation:
- Buffer cache
- Commits
- Queries
- Sessions
- Checkpoints
- Etc
After reading this article and experimenting with the notions, concepts and terms presented, you should be able to make a 2D matrix with all the possible combinations. As an example, the specific PostgreSQL activity (SQL command) can be found using: ps or top (system utilities), the PostgreSQL log files, pg_stat_activity (dynamic view), but also using pg_stat_statements an extension found in contrib (collected stats view). Likewise, information about locks can be found in the PostgreSQL log files, pg_locks and pg_stat_activity (presented just below) using wait_event and wait_event_type. Because of this, it is difficult covering the vast area of monitoring in a uni-dimensional linear fashion, and the author risks creating confusion to the reader because of this. In order to avoid this we will cover monitoring roughly by following the course of the official documentation, and adding related information as needed.
Dynamic Statistics Views
Using pg_stat_activity we are able to see what is the current activity by the various backend processes. For instance if we run the following query on table parts with about 3M rows:
testdb=# \d parts
                         Table "public.parts"
   Column   |          Type          | Collation | Nullable | Default
------------+------------------------+-----------+----------+---------
 id         | integer                |           |          |
 partno     | character varying(20)  |           |          |
 partname   | character varying(80)  |           |          |
 partdescr  | text                   |           |          |
 machine_id | integer                |           |          |
 parttype   | character varying(100) |           |          |
 date_added | date                   |           |          |
And lets run the following query, which needs some seconds to complete:
testdb=# select avg(age(date_added)) FROM parts;
By opening a new terminal and running the following query, while the previous is still running, we get:
testdb=# select pid,usename,application_name,client_addr,backend_start,xact_start,query_start,state,backend_xid,backend_xmin,query,backend_type from pg_stat_activity where datid=411547739 and usename ='achix' and state='active';
-[ RECORD 1 ]----+----------------------------------------
pid              | 21305
usename          | achix
application_name | psql
client_addr      |
backend_start    | 2018-03-02 18:04:35.833677+02
xact_start       | 2018-03-02 18:04:35.832564+02
query_start      | 2018-03-02 18:04:35.832564+02
state            | active
backend_xid      |
backend_xmin     | 438132638
query            | select avg(age(date_added)) FROM parts;
backend_type     | background worker
-[ RECORD 2 ]----+----------------------------------------
pid              | 21187
usename          | achix
application_name | psql
client_addr      |
backend_start    | 2018-03-02 18:02:06.834787+02
xact_start       | 2018-03-02 18:04:35.826065+02
query_start      | 2018-03-02 18:04:35.826065+02
state            | active
backend_xid      |
backend_xmin     | 438132638
query            | select avg(age(date_added)) FROM parts;
backend_type     | client backend
-[ RECORD 3 ]----+----------------------------------------
pid              | 21306
usename          | achix
application_name | psql
client_addr      |
backend_start    | 2018-03-02 18:04:35.837829+02
xact_start       | 2018-03-02 18:04:35.836707+02
query_start      | 2018-03-02 18:04:35.836707+02
state            | active
backend_xid      |
backend_xmin     | 438132638
query            | select avg(age(date_added)) FROM parts;
backend_type     | background worker
The pg_stat_activity view gives us info about the backend process, the user, the client, the transaction, the query, the state as well as a comprehensive info about the waiting status of the query.
But why 3 rows? In versions >=9.6, if a query can be run in parallel, or portions of it can be run in parallel, and the optimizer thinks that parallel execution is the fastest strategy, then it creates a Gather or Gather Merge node, and then requests at most max_parallel_workers_per_gather background worker processes, which by default is 2, hence the 3 rows we see in the output above. We can tell apart the client backend process from the background worker by using the backend_type column. For the pg_stat_activity view to be enabled you’ll have to make sure that the system configuration parameter track_activities is on. The pg_stat_activity provides rich information in order to determine blocked queries by the use of wait_event_type and wait_event columns.
A more refined way to monitor statements is via the pg_stat_statements contrib extension, mentioned earlier. On a recent Linux system (Ubuntu 17.10, PostgreSQL 9.6), this can be installed fairly easy:
testdb=# create extension pg_stat_statements ;
CREATE EXTENSION
testdb=# alter system set shared_preload_libraries TO 'pg_stat_statements';
ALTER SYSTEM
testdb=# \q
postgres@achix-dell:~$ sudo systemctl restart postgresql
postgres@achix-dell:~$ psql testdb
psql (9.6.7)
Type "help" for help.

testdb=# \d pg_stat_statements
Let’s create a table with 100000 rows, and then reset pg_stat_statements, restart the PostgreSQL server, perform a select on this table on the (still cold) system, and then see the contents of pg_stat_statements for the select:
testdb=# select 'descr '||gs as descr,gs as id into medtable from  generate_series(1,100000) as gs;
SELECT 100000
testdb=# select pg_stat_statements_reset();
 pg_stat_statements_reset
--------------------------

(1 row)

testdb=# \q
postgres@achix-dell:~$ sudo systemctl restart postgresql
postgres@achix-dell:~$ psql testdb -c 'select * from medtable'> /dev/null
testdb=# select shared_blks_hit,shared_blks_read from pg_stat_statements where query like '%select%from%medtable%';
 shared_blks_hit | shared_blks_read
-----------------+------------------
               0 |              541
(1 row)

testdb=#
Now let’s perform the select * once more and then look again in the contents of pg_stat_statements for this query:
postgres@achix-dell:~$ psql testdb -c 'select * from medtable'> /dev/null
postgres@achix-dell:~$ psql testdb
psql (9.6.7)
Type "help" for help.

testdb=# select shared_blks_hit,shared_blks_read from pg_stat_statements where query like '%select%from%medtable%';
 shared_blks_hit | shared_blks_read
-----------------+------------------
             541 |              541
(1 row)
So, the second time the select statement finds all the required blocks in the PostgreSQL shared buffers, and pg_stat_statements reports this via shared_blks_hit. pg_stat_statements provides info about the total number of calls of a statement, the total_time, min_time, max_time and mean_time, which can be extremely helpful when trying to analyze the workload of your system. A slow query that is run very frequently should require immediate attention. Similarly, consistently low hit rates may signify the need to review the shared_buffers setting.
pg_stat_replication provides info on the current status of replication for each wal_sender. Let’s suppose we have setup a simple replication topology with our primary and one hot standby, then we may query pg_stat_replication on the primary (doing the same on the standby will yield no results unless we have setup cascading replication and this specific standby serves as an upstream to other downstream standbys) to see the current status of replication:
testdb=# select * from pg_stat_replication ;
-[ RECORD 1 ]----+------------------------------
pid              | 1317
usesysid         | 10
usename          | postgres
application_name | walreceiver
client_addr      | 10.0.2.2
client_hostname  |
client_port      | 48192
backend_start    | 2018-03-03 11:59:21.315524+00
backend_xmin     |
state            | streaming
sent_lsn         | 0/3029DB8
write_lsn        | 0/3029DB8
flush_lsn        | 0/3029DB8
replay_lsn       | 0/3029DB8
write_lag        |
flush_lag        |
replay_lag       |
sync_priority    | 0
sync_state       | async
The 4 columns sent_lsn, write_lsn, flush_lsn, replay_lsn tell us the exact WAL position at each stage of the replication process at the remote standby. Then we create some heavy traffic on the primary with a command like:
testdb=# insert into foo(descr) select 'descr ' || gs from generate_series(1,10000000) gs;
And look at pg_stat_replication again:
postgres=# select * from pg_stat_replication ;
-[ RECORD 1 ]----+------------------------------
pid              | 1317
usesysid         | 10
usename          | postgres
application_name | walreceiver
client_addr      | 10.0.2.2
client_hostname  |
client_port      | 48192
backend_start    | 2018-03-03 11:59:21.315524+00
backend_xmin     |
state            | streaming
sent_lsn         | 0/D5E0000
write_lsn        | 0/D560000
flush_lsn        | 0/D4E0000
replay_lsn       | 0/C5FF0A0
write_lag        | 00:00:04.166639
flush_lag        | 00:00:04.180333
replay_lag       | 00:00:04.614416
sync_priority    | 0
sync_state       | async
Now we see that we have a delay between the primary and the standby depicted in the sent_lsn, write_lsn, flush_lsn, replay_lsn values. Since PgSQL 10.0 the pg_stat_replication also shows the lag between a recently locally flushed WAL and the time it took to be remotely written, flushed and replayed respectively. Seeing nulls in those 3 columns means that the primary and the standby are in sync.
The equivalent of pg_stat_replication on the standby side is called: pg_stat_wal_receiver:
testdb=# select * from pg_stat_wal_receiver ;
-[ RECORD 1 ]---------+----------------------------------------------------------------------------------------------------------------------------------------------------------------------------------------------------
pid                   | 17867
status                | streaming
receive_start_lsn     | 0/F000000
receive_start_tli     | 1
received_lsn          | 0/3163F210
received_tli          | 1
last_msg_send_time    | 2018-03-03 13:32:42.516551+00
last_msg_receipt_time | 2018-03-03 13:33:28.644394+00
latest_end_lsn        | 0/3163F210
latest_end_time       | 2018-03-03 13:32:42.516551+00
slot_name             | fbsdclone
conninfo              | user=postgres passfile=/usr/local/var/lib/pgsql/.pgpass dbname=replication host=10.0.2.2 port=20432 fallback_application_name=walreceiver sslmode=disable sslcompression=1 target_session_attrs=any

testdb=#
When there is no activity, and the standby has replayed everything then latest_end_lsn must be equal to sent_lsn on the primary (and all intermediate log sequence numbers).
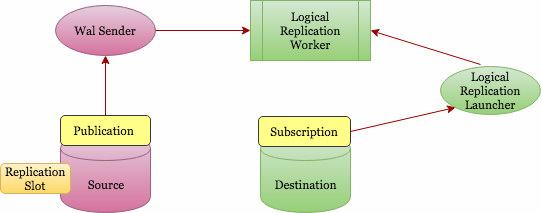
Similarly to physical replication, in the case of logical replication, where the role of the primary is taken by the publisher, and the role of the standby is taken by the subscriber, naturally the role of pg_stat_wal_receiver is taken by pg_stat_subscription. We can query pg_stat_subscription as follows:
testdb=# select * from pg_stat_subscription ;
-[ RECORD 1 ]---------+------------------------------
subid                 | 24615
subname               | alltables_sub
pid                   | 1132
relid                 |
received_lsn          | 0/33005498
last_msg_send_time    | 2018-03-03 17:05:36.004545+00
last_msg_receipt_time | 2018-03-03 17:05:35.990659+00
latest_end_lsn        | 0/33005498
latest_end_time       | 2018-03-03 17:05:36.004545+00
Note that on the publisher side, the corresponding view is the same as in the case of physical replication: pg_stat_replication.
Collected Statistics Views
pg_stat_archiver view has one row which gives info about the wal archiver. Keeping a snapshot of this row at regular intervals lets you calculate the size of the WAL traffic between those intervals. Also it gives info about failures while archiving WAL files.
pg_stat_bgwriter view gives very important information on the behavior of:
- The checkpointer
- The background writer
- The (client serving) backends
Since this view gives accumulative data since the last reset It is very useful to create another timestamped table with periodic snapshots of pg_stat_bgwriter, so that it will be easy to get an incremental perspective between two snapshots. Tuning is a science (or magic), and it requires extensive logging and monitoring as well as a clear understanding of the underlying concepts and PostgreSQL internals in order to have good results, and this view is where to start, looking for things such as:
- Are the checkpoints_timed the vast majority of the total checkpoints? If not then actions must be taken, results measured, and iterate the whole process until no improvements are found.
- Are the buffers_checkpoint a good majority over the other two kinds (buffers_clean but most importantly buffers_backend) ? If buffers_backend are high, then again, certain configurations parameters must be changed, new measurements to be taken and reassessed.
Pg_stat_[user|sys|all]_tables
The most basic usage of those views is to verify that our vacuum strategy works as expected. Large values of dead tuples relative to live tuples signifies inefficient vacuuming. Those views also provide info on seq vs index scans and fetches, info about num of rows inserted, updated, deleted as well as HOT updates. You should try to keep the number of HOT updates as high as possible in order to improve performance.
Pg_stat_[user|sys|all]_indexes
Here the system stores and shows info on individual index usage. One thing to keep in mind is that idx_tup_read is more accurate than idx_tup_fetch. Non PK/ non unique Indexes with low idx_scan should be considered for removal, since they only hinder HOT updates. As mentioned in the previous blog, over-indexing should be avoided, indexing comes at a cost.
Pg_statio_[user|sys|all]_tables
In those views we can find info on the performance of the cache regarding table heap reads, index reads and TOAST reads. A simple query to count for the percentage of hits, and the distribution of the hits across tables would be:
with statioqry as (select relid,heap_blks_hit,heap_blks_read,row_number() OVER (ORDER BY 100.0*heap_blks_hit::numeric/(heap_blks_hit+heap_blks_read) DESC),COUNT(*) OVER () from pg_statio_user_tables where heap_blks_hit+heap_blks_read >0)
select relid,row_number,100.0*heap_blks_hit::float8/(heap_blks_hit+heap_blks_read) as "heap block hits %", 100.0 * row_number::real/count as "In top %" from statioqry order by row_number;
   relid   | row_number | heap block hits % |     In top %
-----------+------------+-------------------+-------------------
     16599 |          1 |  99.9993058404502 | 0.373134328358209
     18353 |          2 |  99.9992251425738 | 0.746268656716418
     18338 |          3 |    99.99917566565 |  1.11940298507463
     17269 |          4 |  99.9990617323798 |  1.49253731343284
     18062 |          5 |  99.9988021889522 |  1.86567164179104
     18075 |          6 |  99.9985334109273 |  2.23880597014925
     18365 |          7 |  99.9968070500335 |  2.61194029850746
………..
     18904 |        127 |  97.2972972972973 |  47.3880597014925
     18801 |        128 |  97.1631205673759 |  47.7611940298507
     16851 |        129 |  97.1428571428571 |   48.134328358209
     17321 |        130 |  97.0043198249512 |  48.5074626865672
     17136 |        131 |                97 |  48.8805970149254
     17719 |        132 |  96.9791612263018 |  49.2537313432836
     17688 |        133 |   96.969696969697 |  49.6268656716418
     18872 |        134 |  96.9333333333333 |                50
     17312 |        135 |  96.8181818181818 |  50.3731343283582
……………..
     17829 |        220 |  60.2721026527734 |   82.089552238806
     17332 |        221 |  60.0276625172891 |  82.4626865671642
     18493 |        222 |                60 |  82.8358208955224
     17757 |        223 |  59.7222222222222 |  83.2089552238806
     17586 |        224 |  59.4827586206897 |  83.5820895522388
This tells us that at least 50% of the tables have hit rates larger than 96.93%, and 83.5% of the tables have a hit rate better than 59.4%
Pg_statio_[user|sys|all]_indexes
This view contains block read/hit information for indexes.
Pg_stat_database
This view contains one row per database. It shows some of the info of the preceding views aggregated to the whole database (blocks read, blocks hit, info on tups), some information relevant to the whole database (total xactions, temp files, conflicts, deadclocks, read/write time), and finally number of current backends.
Things to look for here are the ratio of blks_hit/(blks_hit + blks_read): the higher the value the better for the system’s I/O. However misses should not necessarily be accounted for disk reads as they may have very well been served by the OS’s filesys cache.
Similarly to other collected statistics views mentioned above, one should create a timestamped version of the pg_stat_database view and have a view at the differences between two consecutive snapshots:
- Are the number of rollbacks increasing?
- Or the number of committed xactions?
- Are we getting way more conflicts than yesterday (this applies to standbys)?
- Do we have abnormally high numbers of deadlocks?
All those are very important data. The first two might mean some change in some usage pattern, that must be explained. High number of conflicts might mean replication needs some tuning. High number of deadlocks is bad for many reasons. Not only performance is low because transactions get rolled back, but also if an application suffers from deadlocks in a single master topology, the problems will only get amplified if we move to multi-master. In this case, the software engineering department must rewrite the pieces of the code that cause the deadlocks.
Locks
Locking is a very important topic in PostgreSQL and deserves its own blog(s). Nevertheless basic locks monitoring has to be done in the same fashion as the other aspects of monitoring presented above. pg_locks view provides real time information on the current locks in the system. We may catch long waiting locks by setting log_lock_waits, then information on long waiting waits will be logged in the PgSQL log. If we notice unusual high locking which results in long waits then again, as in the case with the deadlocks mentioned above, the software engineers must review any pieces of code that might cause long held locks, e.g. explicit locking in the application (LOCK TABLE or SELECT … FOR UPDATE).
Similarly to the case of deadlocks, a system with short locks will move easier to a multi-master setup.