Quantcast
Channel: Severalnines
Viewing all 1259 articles
Browse latest View live

Comparing Database Proxy Failover Times - ProxySQL, MaxScale and HAProxy

$
0
0

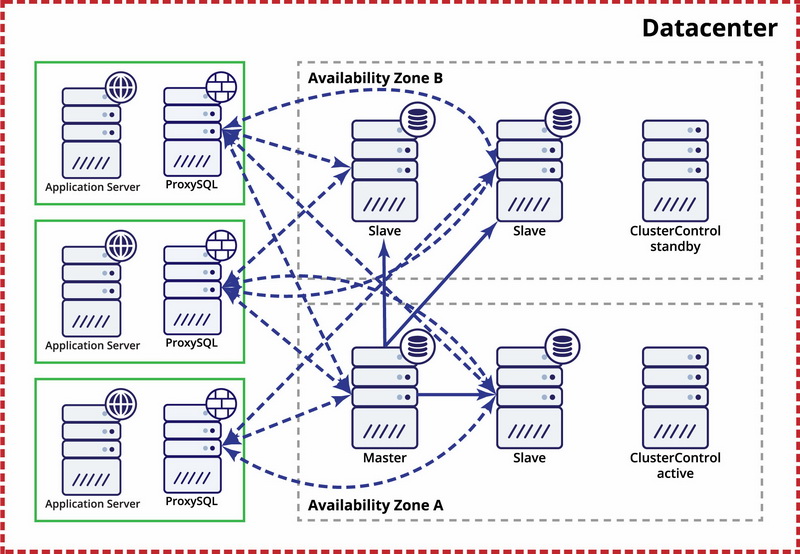
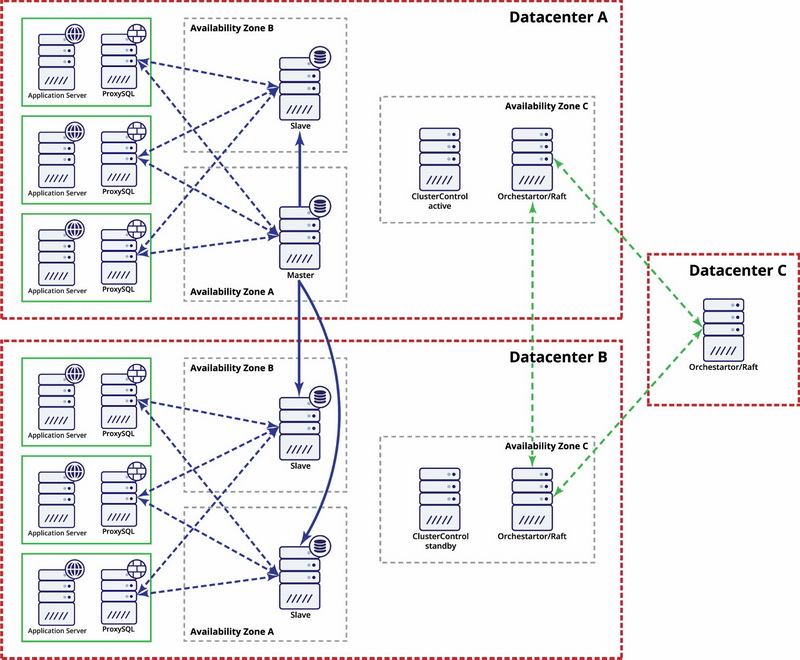
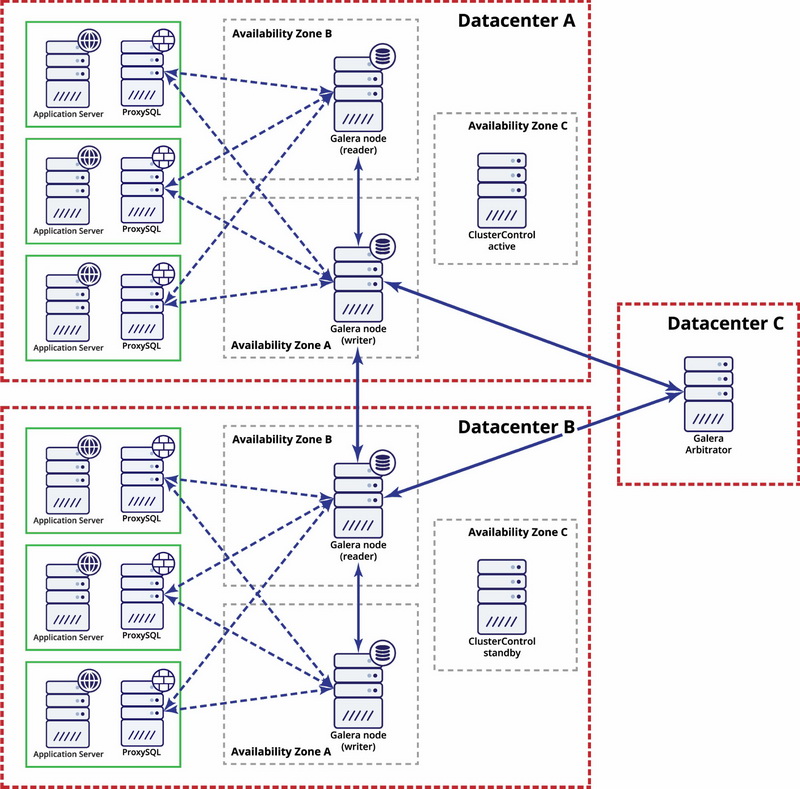
ClusterControl can be used to deploy highly available replication setups. It supports switchover and failover for GTID-based MySQL or MariaDB replication setups. ClusterControl can deploy different types of proxies for traffic routing: ProxySQL, HAProxy and MaxScale. These are integrated to handle topology changes related to failovers or switchovers. In this blog post, we’ll take a look at how this works and what you can expect from each of the proxies.

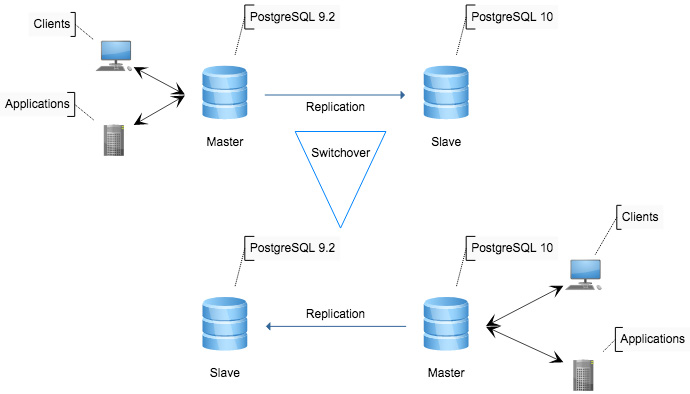
First, let’s go through some definitions and terminology. ClusterControl can be configured to perform a recovery of a failed replication master - it can promote a slave to become the new master, make any required topology changes and restore entire setup’s ability to accept writes. This is what we will call a “failover”. ClusterControl can also perform a master switch - sometimes it’s required to change a master. Typical scenario would be a heavy schema change, which has to be executed in a rolling fashion. Towards the end of the procedure, you’ll have to promote one of the slaves, which already has the change applied, before performing the change on the old master.

The main difference between “failover” and “switchover” is that failover, by definition, is an emergency situation where the master is already unavailable. On the other hand, switchover is a more controllable process over which ClusterControl has full control. If we are talking about failover, there is no way to handle it gracefully as application already lost connections due to master crash. As such, no matter which proxy you will use, application will always have to reconnect.

So, applications need to be able to handle transaction failures and retry them. The other important thing when speaking about failover is the proxy’s ability to check the health of the database servers. Without health checks, the proxy cannot know the status of the server, and therefore cannot decide to failover traffic. ClusterControl automatically configures these healthchecks when deploying the proxy.

Failover

ProxySQL

Let’s take a look at how the failover may look like from the application point of view. We will first connect to the database using ProxySQL version 1.4.6.

root@vagrant:~# while true  ;do time sysbench /root/sysbench/src/lua/oltp_read_write.lua --threads=4 --max-requests=0 --time=3600 --mysql-host=10.0.0.105 --mysql-user=sbtest --mysql-password=pass --mysql-port=6033 --tables=32 --report-interval=1 --skip-trx=on --table-size=10000 --db-ps-mode=disable run ; done
sysbench 1.1.0-651e7fd (using bundled LuaJIT 2.1.0-beta3)

Running the test with following options:
Number of threads: 4
Report intermediate results every 1 second(s)
Initializing random number generator from current time


Initializing worker threads...

Threads started!

[ 1s ] thds: 4 tps: 29.51 qps: 585.28 (r/w/o: 465.27/120.01/0.00) lat (ms,95%): 196.89 err/s: 0.00 reconn/s: 0.00
[ 2s ] thds: 4 tps: 44.61 qps: 784.77 (r/w/o: 603.28/181.49/0.00) lat (ms,95%): 116.80 err/s: 0.00 reconn/s: 0.00
[ 3s ] thds: 4 tps: 46.98 qps: 829.66 (r/w/o: 646.74/182.93/0.00) lat (ms,95%): 121.08 err/s: 0.00 reconn/s: 0.00
[ 4s ] thds: 4 tps: 49.04 qps: 886.64 (r/w/o: 690.50/195.14/1.00) lat (ms,95%): 112.67 err/s: 0.00 reconn/s: 0.00
[ 5s ] thds: 4 tps: 47.98 qps: 887.64 (r/w/o: 689.72/197.92/0.00) lat (ms,95%): 106.75 err/s: 0.00 reconn/s: 0.00
FATAL: mysql_drv_query() returned error 2013 (Lost connection to MySQL server during query) for query 'UPDATE sbtest8 SET k=k+1 WHERE id=5019'
FATAL: `thread_run' function failed: /usr/local/share/sysbench/oltp_common.lua:461: SQL error, errno = 2013, state = 'HY000': Lost connection to MySQL server during query
FATAL: mysql_drv_query() returned error 2013 (Lost connection to MySQL server during query) for query 'DELETE FROM sbtest6 WHERE id=4957'
FATAL: `thread_run' function failed: /usr/local/share/sysbench/oltp_common.lua:490: SQL error, errno = 2013, state = 'HY000': Lost connection to MySQL server during query
FATAL: mysql_drv_query() returned error 2013 (Lost connection to MySQL server during query) for query 'SELECT SUM(k) FROM sbtest23 WHERE id BETWEEN 4986 AND 5085'
FATAL: `thread_run' function failed: /usr/local/share/sysbench/oltp_common.lua:435: SQL error, errno = 2013, state = 'HY000': Lost connection to MySQL server during query
FATAL: mysql_drv_query() returned error 2013 (Lost connection to MySQL server during query) for query 'DELETE FROM sbtest21 WHERE id=5218'
FATAL: `thread_run' function failed: /usr/local/share/sysbench/oltp_common.lua:490: SQL error, errno = 2013, state = 'HY000': Lost connection to MySQL server during query

real    0m5.903s
user    0m0.092s
sys    0m1.252s
sysbench 1.1.0-651e7fd (using bundled LuaJIT 2.1.0-beta3)

Running the test with following options:
Number of threads: 4
Report intermediate results every 1 second(s)
Initializing random number generator from current time


Initializing worker threads...

FATAL: unable to connect to MySQL server on host '10.0.0.105', port 6033, aborting...
FATAL: error 2003: Can't connect to MySQL server on '10.0.0.105' (111)
FATAL: `thread_init' function failed: /usr/local/share/sysbench/oltp_common.lua:352: connection creation failed
FATAL: unable to connect to MySQL server on host '10.0.0.105', port 6033, aborting...
FATAL: error 2003: Can't connect to MySQL server on '10.0.0.105' (111)
FATAL: `thread_init' function failed: /usr/local/share/sysbench/oltp_common.lua:352: connection creation failed
FATAL: unable to connect to MySQL server on host '10.0.0.105', port 6033, aborting...
FATAL: error 2003: Can't connect to MySQL server on '10.0.0.105' (111)
FATAL: `thread_init' function failed: /usr/local/share/sysbench/oltp_common.lua:352: connection creation failed
FATAL: unable to connect to MySQL server on host '10.0.0.105', port 6033, aborting...
FATAL: error 2003: Can't connect to MySQL server on '10.0.0.105' (111)
FATAL: `thread_init' function failed: /usr/local/share/sysbench/oltp_common.lua:352: connection creation failed
FATAL: Threads initialization failed!

real    0m0.021s
user    0m0.012s
sys    0m0.000s
sysbench 1.1.0-651e7fd (using bundled LuaJIT 2.1.0-beta3)

Running the test with following options:
Number of threads: 4
Report intermediate results every 1 second(s)
Initializing random number generator from current time


Initializing worker threads...

Threads started!

[ 1s ] thds: 4 tps: 0.00 qps: 55.81 (r/w/o: 55.81/0.00/0.00) lat (ms,95%): 0.00 err/s: 0.00 reconn/s: 0.00
[ 2s ] thds: 4 tps: 0.00 qps: 0.00 (r/w/o: 0.00/0.00/0.00) lat (ms,95%): 0.00 err/s: 0.00 reconn/s: 0.00
[ 3s ] thds: 4 tps: 0.00 qps: 0.00 (r/w/o: 0.00/0.00/0.00) lat (ms,95%): 0.00 err/s: 0.00 reconn/s: 0.00
[ 4s ] thds: 4 tps: 0.00 qps: 0.00 (r/w/o: 0.00/0.00/0.00) lat (ms,95%): 0.00 err/s: 0.00 reconn/s: 0.00
[ 5s ] thds: 4 tps: 0.00 qps: 0.00 (r/w/o: 0.00/0.00/0.00) lat (ms,95%): 0.00 err/s: 0.00 reconn/s: 0.00
[ 6s ] thds: 4 tps: 0.00 qps: 0.00 (r/w/o: 0.00/0.00/0.00) lat (ms,95%): 0.00 err/s: 0.00 reconn/s: 0.00
[ 7s ] thds: 4 tps: 0.00 qps: 0.00 (r/w/o: 0.00/0.00/0.00) lat (ms,95%): 0.00 err/s: 0.00 reconn/s: 0.00
[ 8s ] thds: 4 tps: 0.00 qps: 0.00 (r/w/o: 0.00/0.00/0.00) lat (ms,95%): 0.00 err/s: 0.00 reconn/s: 0.00
[ 9s ] thds: 4 tps: 0.00 qps: 0.00 (r/w/o: 0.00/0.00/0.00) lat (ms,95%): 0.00 err/s: 0.00 reconn/s: 0.00
[ 10s ] thds: 4 tps: 0.00 qps: 3.00 (r/w/o: 0.00/3.00/0.00) lat (ms,95%): 0.00 err/s: 0.00 reconn/s: 0.00
[ 11s ] thds: 4 tps: 58.99 qps: 1026.91 (r/w/o: 792.93/233.98/0.00) lat (ms,95%): 9977.52 err/s: 0.00 reconn/s: 0.00

As we can see from the above, the new master became available within ~11 seconds of the crash. During this time, ClusterControl promoted one of the slaves to become a new master and it became available for writes.

HAProxy

Below is an excerpt from the output of our sysbench application, when failover happened while we connected via HAProxy. HAProxy was deployed with version 1.5.14.

root@vagrant:~# while true  ;do date ; time sysbench /root/sysbench/src/lua/oltp_read_write.lua --threads=4 --max-requests=0 --time=3600 --mysql-host=10.0.0.105 --mysql-user=sbtest --mysql-password=pass --mysql-port=3307 --tables=32 --report-interval=1 --skip-trx=on --table-size=10000 --db-ps-mode=disable run ; done
Mon Mar 26 13:24:36 UTC 2018
sysbench 1.1.0-651e7fd (using bundled LuaJIT 2.1.0-beta3)

Running the test with following options:
Number of threads: 4
Report intermediate results every 1 second(s)
Initializing random number generator from current time


Initializing worker threads...

Threads started!

[ 1s ] thds: 4 tps: 38.62 qps: 748.66 (r/w/o: 591.21/157.46/0.00) lat (ms,95%): 204.11 err/s: 0.00 reconn/s: 0.00
[ 2s ] thds: 4 tps: 45.25 qps: 797.34 (r/w/o: 619.37/177.97/0.00) lat (ms,95%): 142.39 err/s: 0.00 reconn/s: 0.00
[ 3s ] thds: 4 tps: 46.04 qps: 833.66 (r/w/o: 647.51/186.15/0.00) lat (ms,95%): 155.80 err/s: 0.00 reconn/s: 0.00
[ 4s ] thds: 4 tps: 38.03 qps: 698.50 (r/w/o: 548.39/150.11/0.00) lat (ms,95%): 161.51 err/s: 0.00 reconn/s: 0.00
FATAL: mysql_drv_query() returned error 2013 (Lost connection to MySQL server during query) for query 'INSERT INTO sbtest26 (id, k, c, pad) VALUES (5019, 4641, '59053342586-08172779908-92479743240-43242105725-10632773383-95161136797-93281862044-04686210438-11173993922-29424780352', '31974441818-04649488782-29232641118-20479872868-43849012112')'
FATAL: `thread_run' function failed: /usr/local/share/sysbench/oltp_common.lua:491: SQL error, errno = 2013, state = 'HY000': Lost connection to MySQL server during query
FATAL: mysql_drv_query() returned error 2013 (Lost connection to MySQL server during query) for query 'INSERT INTO sbtest5 (id, k, c, pad) VALUES (4990, 5016, '24532768797-67997552950-32933774735-28931955363-94029987812-56997738696-36504817596-46223378508-29593036153-06914757723', '96663311222-58437606902-85941187037-63300736065-65139798452')'
FATAL: `thread_run' function failed: /usr/local/share/sysbench/oltp_common.lua:491: SQL error, errno = 2013, state = 'HY000': Lost connection to MySQL server during query
FATAL: mysql_drv_query() returned error 2013 (Lost connection to MySQL server during query) for query 'DELETE FROM sbtest25 WHERE id=4996'
FATAL: `thread_run' function failed: /usr/local/share/sysbench/oltp_common.lua:490: SQL error, errno = 2013, state = 'HY000': Lost connection to MySQL server during query
FATAL: mysql_drv_query() returned error 2013 (Lost connection to MySQL server during query) for query 'UPDATE sbtest16 SET k=k+1 WHERE id=5269'
FATAL: `thread_run' function failed: /usr/local/share/sysbench/oltp_common.lua:461: SQL error, errno = 2013, state = 'HY000': Lost connection to MySQL server during query

real    0m4.270s
user    0m0.068s
sys    0m0.928s

...

Mon Mar 26 13:24:47 UTC 2018
sysbench 1.1.0-651e7fd (using bundled LuaJIT 2.1.0-beta3)

Running the test with following options:
Number of threads: 4
Report intermediate results every 1 second(s)
Initializing random number generator from current time


Initializing worker threads...

FATAL: unable to connect to MySQL server on host '10.0.0.105', port 3307, aborting...
FATAL: error 2013: Lost connection to MySQL server at 'reading initial communication packet', system error: 0
FATAL: `thread_init' function failed: /usr/local/share/sysbench/oltp_common.lua:352: connection creation failed
FATAL: unable to connect to MySQL server on host '10.0.0.105', port 3307, aborting...
FATAL: error 2013: Lost connection to MySQL server at 'reading initial communication packet', system error: 2
FATAL: `thread_init' function failed: /usr/local/share/sysbench/oltp_common.lua:352: connection creation failed
FATAL: Threads initialization failed!

real    0m0.036s
user    0m0.004s
sys    0m0.008s

...

Mon Mar 26 13:25:03 UTC 2018
sysbench 1.1.0-651e7fd (using bundled LuaJIT 2.1.0-beta3)

Running the test with following options:
Number of threads: 4
Report intermediate results every 1 second(s)
Initializing random number generator from current time


Initializing worker threads...

Threads started!

[ 1s ] thds: 4 tps: 50.58 qps: 917.42 (r/w/o: 715.10/202.33/0.00) lat (ms,95%): 153.02 err/s: 0.00 reconn/s: 0.00
[ 2s ] thds: 4 tps: 50.17 qps: 956.33 (r/w/o: 749.61/205.72/1.00) lat (ms,95%): 121.08 err/s: 0.00 reconn/s: 0.00

In total, the process took 12 seconds.

MaxScale

Let’s take a look at how MaxScale handles failover. We use MaxScale with version 2.1.9.

root@vagrant:~# while true ; do date ; time sysbench /root/sysbench/src/lua/oltp_read_write.lua --threads=4 --max-requests=0 --time=3600 --mysql-host=10.0.0.106 --mysql-user=myuser --mysql-password=pass --mysql-port=4008 --tables=32 --report-interval=1 --skip-trx=on --table-size=100000 --db-ps-mode=disable run ; done
Mon Mar 26 15:16:34 UTC 2018
sysbench 1.1.0-651e7fd (using bundled LuaJIT 2.1.0-beta3)

Running the test with following options:
Number of threads: 4
Report intermediate results every 1 second(s)
Initializing random number generator from current time


Initializing worker threads...

Threads started!

[ 1s ] thds: 4 tps: 34.82 qps: 658.54 (r/w/o: 519.27/125.34/13.93) lat (ms,95%): 137.35 err/s: 0.00 reconn/s: 0.00
[ 2s ] thds: 4 tps: 35.01 qps: 655.23 (r/w/o: 513.18/142.05/0.00) lat (ms,95%): 207.82 err/s: 0.00 reconn/s: 0.00
[ 3s ] thds: 4 tps: 39.01 qps: 696.16 (r/w/o: 542.13/154.04/0.00) lat (ms,95%): 139.85 err/s: 0.00 reconn/s: 0.00
[ 4s ] thds: 4 tps: 40.91 qps: 724.41 (r/w/o: 557.77/166.63/0.00) lat (ms,95%): 125.52 err/s: 0.00 reconn/s: 0.00
FATAL: mysql_drv_query() returned error 1053 (Server shutdown in progress) for query 'UPDATE sbtest28 SET k=k+1 WHERE id=49992'
FATAL: `thread_run' function failed: /usr/local/share/sysbench/oltp_common.lua:461: SQL error, errno = 1053, state = '08S01': Server shutdown in progress
FATAL: mysql_drv_query() returned error 1053 (Server shutdown in progress) for query 'UPDATE sbtest14 SET k=k+1 WHERE id=59650'
FATAL: `thread_run' function failed: /usr/local/share/sysbench/oltp_common.lua:461: SQL error, errno = 1053, state = '08S01': Server shutdown in progress
FATAL: mysql_drv_query() returned error 1053 (Server shutdown in progress) for query 'UPDATE sbtest12 SET k=k+1 WHERE id=50288'
FATAL: `thread_run' function failed: /usr/local/share/sysbench/oltp_common.lua:461: SQL error, errno = 1053, state = '08S01': Server shutdown in progress
FATAL: mysql_drv_query() returned error 1053 (Server shutdown in progress) for query 'UPDATE sbtest25 SET k=k+1 WHERE id=50105'
FATAL: `thread_run' function failed: /usr/local/share/sysbench/oltp_common.lua:461: SQL error, errno = 1053, state = '08S01': Server shutdown in progress

real    0m5.043s
user    0m0.080s
sys    0m1.044s


Mon Mar 26 15:16:53 UTC 2018
sysbench 1.1.0-651e7fd (using bundled LuaJIT 2.1.0-beta3)

Running the test with following options:
Number of threads: 4
Report intermediate results every 1 second(s)
Initializing random number generator from current time


Initializing worker threads...

Threads started!

[ 1s ] thds: 4 tps: 46.82 qps: 905.61 (r/w/o: 710.34/195.27/0.00) lat (ms,95%): 101.13 err/s: 0.00 reconn/s: 0.00

Failover summary

It is important to clarify that this is not a scientific benchmark - most of the time is used by ClusterControl to perform the failover. Proxies typically need a couple of seconds at most to detect the topology change. We used sysbench as our application. It was configured to run auto-committed transactions, so neither explicit transactions nor prepared statements have been used. Sysbench’s read/write workload is pretty fast. If you have long-running transactions or queries, the failover performance will differ. You can see our scenario as a best case.

ClusterControl
Single Console for Your Entire Database Infrastructure
Find out what else is new in ClusterControl

Switchover

As we mentioned earlier, when executing a switchover ClusterControl has more control of the master. Under some circumstances (like no transactions, no long running writes, etc.), it may be able to perform a graceful master switch, as long as the proxy supports this. Unfortunately, as of now, none of the proxies deployable by ClusterControl can handle graceful switchover. In the past, ProxySQL had this capability therefore we decided to investigate closer and got in touch with ProxySQL creator, René Cannaò. During the investigation we identified a regression which should be fixed in the next release of ProxySQL. In the meantime, to showcase how ProxySQL should behave, we used ProxySQL patched with a small workaround which we compiled from source.

[ 16s ] thds: 4 tps: 39.01 qps: 711.11 (r/w/o: 555.09/156.02/0.00) lat (ms,95%): 173.58 err/s: 0.00 reconn/s: 0.00
[ 17s ] thds: 4 tps: 49.00 qps: 879.06 (r/w/o: 678.05/201.01/0.00) lat (ms,95%): 102.97 err/s: 0.00 reconn/s: 0.00
[ 18s ] thds: 4 tps: 42.86 qps: 768.57 (r/w/o: 603.09/165.48/0.00) lat (ms,95%): 176.73 err/s: 0.00 reconn/s: 0.00
[ 19s ] thds: 4 tps: 28.07 qps: 521.26 (r/w/o: 406.98/114.28/0.00) lat (ms,95%): 235.74 err/s: 0.00 reconn/s: 0.00
[ 20s ] thds: 4 tps: 0.00 qps: 0.00 (r/w/o: 0.00/0.00/0.00) lat (ms,95%): 0.00 err/s: 0.00 reconn/s: 0.00
[ 21s ] thds: 4 tps: 0.00 qps: 0.00 (r/w/o: 0.00/0.00/0.00) lat (ms,95%): 0.00 err/s: 0.00 reconn/s: 0.00
[ 22s ] thds: 4 tps: 0.00 qps: 0.00 (r/w/o: 0.00/0.00/0.00) lat (ms,95%): 0.00 err/s: 0.00 reconn/s: 0.00
[ 23s ] thds: 4 tps: 13.98 qps: 249.59 (r/w/o: 193.68/55.91/0.00) lat (ms,95%): 4055.23 err/s: 0.00 reconn/s: 0.00
[ 24s ] thds: 4 tps: 81.06 qps: 1449.01 (r/w/o: 1123.79/325.23/0.00) lat (ms,95%): 62.19 err/s: 0.00 reconn/s: 0.00
[ 25s ] thds: 4 tps: 52.02 qps: 923.42 (r/w/o: 715.32/208.09/0.00) lat (ms,95%): 390.30 err/s: 0.00 reconn/s: 0.00
[ 26s ] thds: 4 tps: 59.00 qps: 1082.94 (r/w/o: 844.96/237.99/0.00) lat (ms,95%): 164.45 err/s: 0.00 reconn/s: 0.00
[ 27s ] thds: 4 tps: 50.99 qps: 900.75 (r/w/o: 700.81/199.95/0.00) lat (ms,95%): 130.13 err/s: 0.00 reconn/s: 0.00

As you can see, no queries are executed for 4 seconds but no error is returned to the application and after this pause, the traffic starts to flow once more.

To summarize, we have shown that ClusterControl, when used with ProxySQL or MaxScale or HAProxy, can perform a failover with a downtime of 10 - 15 seconds. With respect to a planned master switch, none of the proxies can handle the procedure without errors at the time of writing. However, it is expected that the next ProxySQL version will allow a switchover of a few seconds without any error showing up in the application.


Designing Open Source Databases for High Availability

$
0
0
Tuesday, March 27, 2018 - 21:30

It is said that if you are not designing for failure, then you are heading for failure. How do you design a database system from the ground up to withstand failure? This can be a challenge as failures happen in many different ways, sometimes in ways that would be hard to imagine. This is a consequence of the complexity of today’s database environments.

At Severalnines we’re big fans of high availability databases and have seen our fair share of failure scenarios across the thousands of database deployments we enable every year.

In this webinar replay, we’ll look at the different types of failures you might encounter and what mechanisms can be used to address them. We will also look at some of popular HA solutions used today, and how they can help you achieve different levels of availability.

Webinar Replay: How to Design Open Source Databases for High Availability

$
0
0

Thanks for joining this week’s webinar on how to design open source databases for high availability with Ashraf Sharif, Senior Support Engineer at Severalnines. From discussing high availability concepts through to failover or switch over mechanisms, Ashraf covered all the need-to-know information when it comes to building highly available database infrastructures.

It’s been said that not designing for failure leads to failure; but what is the best way to design a database system from the ground up to withstand failure?

Designing open source databases for high availability can be a challenge as failures happen in many different ways, which sometimes go beyond imagination. This is one of the consequences of the complexity of today’s open source database environments.

At Severalnines we’re big fans of high availability databases and have seen our fair share of failure scenarios across the thousands of database deployment attempts that we come across every year.

In this webinar replay, we look at the different types of failures you might encounter and what mechanisms can be used to address them. And we look at some of popular high availability solutions used today, and how they can help you achieve different levels of availability.

Watch the replay

Agenda

  • Why design for High Availability?
  • High availability concepts
    • CAP theorem
    • PACELC theorem
  • Trade offs
    • Deployment and operational cost
    • System complexity
    • Performance issues
    • Lock management
  • Architecting databases for failures
    • Capacity planning
    • Redundancy
    • Load balancing
    • Failover and switchover
    • Quorum and split brain
    • Fencing
    • Multi datacenter and multi-cloud setups
    • Recovery policy
  • High availability solutions
    • Database architecture determines Availability
    • Active-Standby failover solution with shared storage or DRBD
    • Master-slave replication
    • Master-master cluster
  • Failover and switchover mechanisms
    • Reverse proxy
    • Caching
    • Virtual IP address
    • Application connector

Watch the replay

Speaker

Ashraf Sharif is System Support Engineer at Severalnines. He was previously involved in hosting world and LAMP stack, where he worked as principal consultant and head of support team and delivered clustering solutions for large websites in the South East Asia region. His professional interests are on system scalability and high availability.

How to Measure Database Availability?

$
0
0

Database availability is notoriously hard to measure and report on, although it is an important KPI in any SLA between you and your customer. We often define availability in terms of 9’s (e.g. 99.9% or 99.999%), although there is often a lack of understanding of what these numbers might mean, or how we can measure them.

Is the database available if an instance is up and running, but it is unable to serve any requests? Or if response times are excessively long, so that users consider the service unusable? Is the impact of one longer outage the same as multiple shorter outages? How do partial outages affect database availability, where some users are unable to use the service while others are completely unaffected?  

Not agreeing on precise definitions with your customer might lead to dissatisfaction. The database team might be reporting that they have met their availability goals, while the customer is dissatisfied with the service. In this webinar, we will discuss the different factors that affect database availability. We will then see how you can measure your database availability in a realistic way.

Image: 
Agenda: 
  • Defining availability targets
    • Critical business functions
    • Customer needs
    • Duration and frequency of downtime
    • Planned vs unplanned downtime
    • SLA
  • Measuring the database availability
    • Failover/Switchover time
    • Recovery time
    • Upgrade time
    • Queries latency
    • Restoration time from backup
    • Service outage time
  • Instrumentation and tools to measure database availability:
    • Free & open-source tools
    • CC's Operational Report
    • Paid tools
Date & Time v2: 
Tuesday, April 24, 2018 - 10:00 to 11:15
Tuesday, April 24, 2018 - 12:00 to 13:15

Comparing Replication Solutions from Oracle and MySQL

$
0
0

Databases can fail without warning - either because of a crash caused by a software bug, or the underlying hardware components. The cloud brings another dimension to the issue, because of the ephemeral nature of compute and storage resources. To insulate our database infrastructure from these failures, we build redundancy into our systems. If an instance becomes unavailable, a standby system should be able to take the workload and carry on from there. Replication is a well known and widely adopted method for creating redundant copies of a master database.

In this post, we are going to compare the replication functionality in the two most popular database systems on the planet (according to db-engines) - Oracle and MySQL. We’ll specifically look at Oracle 12c logical replication, and MySQL 5.7. Both technologies offer reliable standby systems to offload production workloads and help in case of disaster. We will take a look at their different architectures, analyze pros and cons and go through the steps on how to setup replication with Oracle and MySQL.

Oracle Data Guard Architecture – How it works

Oracle Data Guard assures high availability, data protection, and disaster recovery of your data. It's probably an Oracle DBA’s first choice for replicating data. The technology was introduced in 1990 (version 7.0) with an essential apply of archive logs on standby databases. Data Guard evolved over the years and now provides a comprehensive set of services that create, maintain, manage, and monitor standby databases.

Data Guard maintains standby databases as copies of the production database. If the primary database stops responding, Data Guard can switch any standby to the production role, thus downtime. Data Guard can be used for backup, restoration, and cluster techniques to provide a high level of data protection and data availability.

Data Guard is a Ship Redo / Apply Redo technology, "redo" is the information needed to recover transactions. A production database referred to as a primary database broadcasts redo to one or more replicas referred to as standby databases. When an insert or update is made to a table, this change is captured by the log writer into an archive log, and replicated to the standby system. Standby databases are in a continuous phase of recovery, verifying and applying redo to maintain synchronization with the primary database. A standby database will also automatically re-synchronize if it becomes temporarily disconnected to the primary due to power outages, network problems, etc.

Oracle Data Guard Net Services

Data Guard Redo Transport Services regulate the transmission of redo from the primary database to the standby database. LGWR (log writer) process submits the redo data to one or more network server (LNS1, LSN2, LSN3, ...LSNn) processes. LNS is reading from the redo buffer in the SGA (Shared Global Area) and passes redo to Oracle Net Services to transmit to the standby database. You can choose the LGWR attributes: synchronous (LogXptMode = 'SYNC') or asynchronous mode (LogXptMode = 'ASYNC'). With such architecture it is possible to deliver the redo data to several standby databases or use it with Oracle RAC (Real Application Cluster). The Remote File Server (RFS) process receives the redo from LNS and writes it to a regular file called a standby redo log (SRL) file.

There are two major types of Oracle Data Guard. Physical with redo apply and Logical standby databases with SQL apply.

Oracle Dataguard Logical Replication architecture

SQL apply requires more processing than redo applies, the process first read the SRL and "mine" the redo by converting it to logical change records, and then builds SQL transactions before applying the SQL to the standby database. There are more moving parts so it requires more CPU, memory and I/O then redo apply.

The main benefit of "SQL apply" is that the database is open to read-write, while the apply process is active.

You can even create views and local indexes. This makes it ideal for reporting tools. The standby database does not have to be a one to one copy of your primary database, and therefore may not be the best candidate for DR purposes.

The key features of this solution are:

  • A standby database that is opened for read-write while SQL apply is active
  • Possible modification lock of data that is being maintained by the SQL apply
  • Able to execute rolling database upgrades

There are drawbacks. Oracle uses a primary-key or unique-constraint/index supplemental logging to logically recognize a modified row in the logical standby database. When database-wide primary-key and unique-constraint/index supplemental logging is enabled, each UPDATE statement also writes the column values necessary in the redo log to uniquely identify the modified row in the logical standby database. Oracle Data Guard supports chained replication, which here is called “cascade” however it’s not typical due to the complexity of the setup.

Oracle recommends that you add a primary key or a non-null unique index to tables in the primary database, whenever possible, to ensure that SQL Apply can efficiently apply redo data updates to the logical standby database. This means it doesn’t work on any setup, you may need to modify your application.

Oracle Golden Gate Architecture – How it works

With Data Guard, as blocks are changed in the database, records are added to the redo log. Then based on the replication mode that you are running, these log records will either be immediately copied to the standby or mined for SQL commands and applied. Golden Gate works in a different way.

Golden Gate only replicates changes after the transaction is committed, so if you have a long running transaction, it can take a while to replicate. The Golden Gate “extract process” keeps transactional changes in memory.

Another big difference is that Oracle Golden Gate enables the exchange and manipulation of data at the transaction level among multiple, heterogeneous platforms. You are not only limited to Oracle database. It gives you the flexibility to extract and replicate selected data records, transactional changes, and changes to DDL (data definition language) across a variety of topologies.

Oracle Golden Gate architecture

The typical Golden Gate flow shows new and changed database data being captured from the source database. The captured data is written to a file called the source trail. The trail is then read by a data pump, sent across the network, and written to a remote trail file by the Collector process. The delivery function reads the remote trail and updates the target database. Each of the components is managed by the Manager process.

MySQL Logical replication – How it works

Replication in MySQL has been around for a long time and has been evolving over the years. There are different ways to enable MySQL replication, including Group Replication, Galera Clusters, asynchronous "Master to Slave". To compare Oracle vs. MySQL architecture, we will focus on replication formats as it is the base for all the various replication types.

First of all, the different replication formats correspond to the binary logging format specified in my.cnf configuration file. Regardless of the format, logs are always stored in a binary way, not viewable with a regular editor. There are three format types: row-based, statement based and mixed. Mixed is the combination of first two. We will take a look at statement and row based.

Statement based – in this case these are the written queries. Not all statements that modify data (such as INSERT DELETE, UPDATE, and REPLACE statements) can be replicated using statement-based replication. LOAD_FILE(), UUID(), UUID_SHORT(), USER(), FOUND_ROWS() etc will be not replicated.

Row-based – in this case, these are changes to records. All changes can be replicated. This is the safest form of replication. Since 5.7.7, it’s the default option.

Now let's take a look what is happening under the hood when replication is enabled.

MySQL replication architecture

First of all, the master database writes changes to a file called binary log or binlog. Writing to binary log is usually a lightweight activity because writes are buffered and sequential. The binary log file stores data that a replication slave will be processing later, the master activity doesn’t depend on them. When the replication starts, mysql will trigger three threads. One on the master, two on the slave. The master has a thread, called the dump thread, that reads the master's binary log and delivers it to the slave.

On the slave, a process called IO thread connects to the master, reads binary log events from the master as they come in and copies them over to a local log file called relay log. The second slave process – SQL thread – reads events from a relay log stored locally on the replication slave and then utilizes them.

MySQL supports chained replication, which is very easy to setup. Slaves which are also masters must be running with --log-bin and --log-slave-update parameters.

To check the status of the replication and get information about threads, you run on the slave:

MariaDB [(none)]> show slave status\G
*************************** 1. row ***************************
               Slave_IO_State: Waiting for master to send event
                 Master_Host: master
                  Master_User: rpl_user
                  Master_Port: 3306
                Connect_Retry: 10
              Master_Log_File: binlog.000005
          Read_Master_Log_Pos: 339
               Relay_Log_File: relay-bin.000002
                Relay_Log_Pos: 635
        Relay_Master_Log_File: binlog.000005
             Slave_IO_Running: Yes
            Slave_SQL_Running: Yes
              Replicate_Do_DB: 
          Replicate_Ignore_DB: 
           Replicate_Do_Table: 
       Replicate_Ignore_Table: 
      Replicate_Wild_Do_Table: 
  Replicate_Wild_Ignore_Table: 
                   Last_Errno: 0
                   Last_Error: 
                 Skip_Counter: 0
          Exec_Master_Log_Pos: 339
              Relay_Log_Space: 938
              Until_Condition: None
               Until_Log_File: 
                Until_Log_Pos: 0
           Master_SSL_Allowed: No
           Master_SSL_CA_File: 
           Master_SSL_CA_Path: 
              Master_SSL_Cert: 
            Master_SSL_Cipher: 
               Master_SSL_Key: 
        Seconds_Behind_Master: 0
Master_SSL_Verify_Server_Cert: No
                Last_IO_Errno: 0
                Last_IO_Error: 
               Last_SQL_Errno: 0
               Last_SQL_Error: 
  Replicate_Ignore_Server_Ids: 
             Master_Server_Id: 1
               Master_SSL_Crl: 
           Master_SSL_Crlpath: 
                   Using_Gtid: Current_Pos
                  Gtid_IO_Pos: 0-1-8
      Replicate_Do_Domain_Ids: 
  Replicate_Ignore_Domain_Ids: 
                Parallel_Mode: conservative
                    SQL_Delay: 0
          SQL_Remaining_Delay: NULL
      Slave_SQL_Running_State: Slave has read all relay log; waiting for the slave I/O thread to update it
1 row in set (0.00 sec)

Setting up Data Guard Logical replication in Oracle

  1. Create a Physical Standby Database

    To create a logical standby database, you first create a physical standby database and then transition it to a logical standby database.

  2. Stop Redo Apply on the Physical Standby Database

    Stopping Redo Apply is necessary to avoid applying changes.

    SQL> ALTER DATABASE RECOVER MANAGED STANDBY DATABASE CANCEL;
  3. Prepare the Primary Database to Support a Logical Standby Database

    Change the VALID_FOR attribute in the original LOG_ARCHIVE_DEST_1 and add LOG_ARCHIVE_DEST_3 for logical database.

    LOG_ARCHIVE_DEST_1=
     'LOCATION=/arch1/severalnines/
      VALID_FOR=(ONLINE_LOGFILES,ALL_ROLES)
      DB_UNIQUE_NAME=severalnines'
    LOG_ARCHIVE_DEST_3=
     'LOCATION=/arch2/severalnines/
      VALID_FOR=(STANDBY_LOGFILES,STANDBY_ROLE)
      DB_UNIQUE_NAME=severalnines'
    LOG_ARCHIVE_DEST_STATE_3=ENABLE

    Build a Dictionary in the Redo Data

    SQL> EXECUTE DBMS_LOGSTDBY.BUILD;
  4. Convert to a Logical Standby Database

    To continue applying redo data to the physical standby database until it is ready to convert to a logical standby database, issue the following SQL statement:

    SQL> ALTER DATABASE RECOVER TO LOGICAL STANDBY db_name;
  5. Adjust Initialization Parameters for the Logical Standby Database

    LOG_ARCHIVE_DEST_1=
      'LOCATION=/arch1/severalnines_remote/
       VALID_FOR=(ONLINE_LOGFILES,ALL_ROLES)
       DB_UNIQUE_NAME=severalnines_remote'
    LOG_ARCHIVE_DEST_2=
      'SERVICE=severalnines ASYNC
       VALID_FOR=(ONLINE_LOGFILES,PRIMARY_ROLE)
       DB_UNIQUE_NAME=severalnines'
    LOG_ARCHIVE_DEST_3=
      'LOCATION=/arch2/severalnines_remote/
    VALID_FOR=(STANDBY_LOGFILES,STANDBY_ROLE)
       DB_UNIQUE_NAME=severalnines_remote'
    LOG_ARCHIVE_DEST_STATE_1=ENABLE
    LOG_ARCHIVE_DEST_STATE_2=ENABLE
    LOG_ARCHIVE_DEST_STATE_3=ENABLE
  6. Open the Logical Standby Database

    SQL> ALTER DATABASE OPEN RESETLOGS;

    Verify the Logical Standby Database Is Performing Properly

    v$data_guard_stats view

    SQL> COL NAME FORMAT A20
    SQL> COL VALUE FORMAT A12
    SQL> COL UNIT FORMAT A30
    SQL> SELECT NAME, VALUE, UNIT FROM V$Data_Guard_STATS;
     NAME                 VALUE        UNIT
    -------------------- ------------ ------------------------------
    apply finish time    +00 00:00:00 day(2) to second(1) interval
    apply lag            +00 00:00:00 day(2) to second(0) interval
    transport lag        +00 00:00:00 day(2) to second(0) interval

    v$logstdby_process view

    SQL> COLUMN SERIAL# FORMAT 9999
    SQL> COLUMN SID FORMAT 9999
    SQL> SELECT SID, SERIAL#, SPID, TYPE, HIGH_SCN FROM V$LOGSTDBY_PROCESS;
       SID   SERIAL#   SPID         TYPE            HIGH_SCN
      ----- -------   ----------- ---------------- ----------
    48        6    11074        COORDINATOR     7178242899
       56       56    10858        READER          7178243497
       46        1    10860        BUILDER         7178242901
       45        1    10862        PREPARER        7178243295
       37        1    10864        ANALYZER        7178242900
       36        1    10866        APPLIER         7178239467
       35        3    10868        APPLIER         7178239463
       34        7    10870        APPLIER         7178239461
       33        1    10872        APPLIER         7178239472
     9 rows selected.

These are the necessary steps to create Oracle Data Guard logical replication. Actions will be slightly different if you perform this operation with non default compatibility set or databases running in Oracle RAC environment.

Setting up MySQL replication

  1. Configure Master database. Set unique server_id, specify different replication logs –log-basename (MariaDB) , activate binary log. Modify my.cnf file with below information.

    log-bin
    server_id=1
    log-basename=master1

    Login to master database and grant replication user to access master data.

    GRANT REPLICATION SLAVE ON *.* TO replication_user
  2. Start both servers with GTIDs enabled.

    gtid_mode=ON
    enforce-gtid-consistency=true
  3. Configure the slave to use GTID-based auto-positioning.

    mysql> CHANGE MASTER TO
         >     MASTER_HOST = host,
         >     MASTER_PORT = port,
         >     MASTER_USER = replication_user,
         >     MASTER_PASSWORD = password,
         >     MASTER_AUTO_POSITION = 1;
  4. If you want to add slave to master with data, then you need to take backup and restore it on slave server.

    mysqldump --all-databases --single-transaction --triggers --routines --host=127.0.0.1 --user=root --password=rootpassword > dump_replication.sql

    Login to slave database and execute:

    slave> tee dump_replication_insert.log
    slave> source dump_replication.sql
    slave> CHANGE MASTER TO MASTER_HOST="host", MASTER_USER=" replication_user ", MASTER_PASSWORD="password ", MASTER_PORT=port, MASTER_AUTO_POSITION = 1;

PostgreSQL Privileges and Security - Locking Down the Public Schema

$
0
0

Introduction

In a previous article we introduced the basics of understanding PostgreSQL schemas, the mechanics of creation and deletion, and reviewed several use cases. This article will extend upon those basics and explore managing privileges related to schemas.

More Terminology Overloading

But there is one preliminary matter requiring clarification. Recall that in the previous article, we dwelt on a possible point of confusion related to overloading of the term “schema”. The specialized meaning of that term in the context of PostgreSQL databases is distinct from how it is generally used in relational database management systems. We have another similar possible terminology kerfuffle for the present topic related to the word “public”.

Upon initial database creation, the newly created Postgresql database includes a pre-defined schema named “public”. It is a schema like any other, but the same word is also used as a keyword that denotes “all users” in contexts where otherwise an actual role name might be used, such as ... wait for it ... schema privilege management. The significance and two distinct uses will be clarified in examples below.

Querying Schema Privileges

Before making this concrete with example code to grant and revoke schema privileges, we need to review how to examine schema privileges. Using the psql command line interface, we list the schemas and associated privileges with the \dn+ command. For a newly-created sampledb database we see this entry for the public schema:

sampledb=# \dn+ 
                          List of schemas
  Name  |  Owner   |  Access privileges   |      Description      
--------+----------+----------------------+------------------------
 public | postgres | postgres=UC/postgres+| standard public schema
        |          | =UC/postgres         |
(1 row)

The first two and the fourth columns are pretty straightforward: as mentioned previously showing the default-created schema named “public”, described as “standard public schema”, and owned by the role “postgres”. (The schema ownership, unless specified otherwise, is set to the role which creates the schema.) That third column listing the access privileges is of interest here. The format of the privilege information provides three items: the privilege grantee, the privileges, and privilege grantor in the format “grantee=privileges/grantor” that is, to the left of the equality sign is the role receiving the privilege(s), immediately to the right of the equality sign is a group of letters specifying the particular privilege(s), and lastly following the slash the role which granted to privilege(s). There may be multiple such privilege information specifications, listed separated by a plus sign since privileges are additive.

For schemas, there are two possible privileges which may be granted separately: U for “USAGE” and C for “CREATE”. The former is required for a role to have the ability to lookup database objects such as tables and views contained in the schema; the latter privilege allows for a role to create database objects in the schema. There are other letters for other privileges relating to different types of database objects, but for schemas, only U and C apply.

Thus to interpret the privilege listing above, the first specification tells us that the postgres user was granted the update and create privileges by itself on the public schema.

Notice that for the second specification above, an empty string appears to the left of the equal sign. This is how privileges granted to all users, by means of the PUBLIC key word mentioned earlier, is denoted.

This latter specification of granting usage and create privileges on the public schema to all users is viewed by some as possibly contrary to general security principles best practices, where one might prefer to start with access restricted by default, requiring the database administrator to explicitly grant appropriate and minimally necessary access privileges. These liberal privileges on the public schema are purposely configured in the system as a convenience and for legacy compatibility.

Note also that except for the permissive privilege settings, the only other thing special about the public schema is that it also listed in the search_path, as we discussed in the previous article. This is similarly for convenience: The search_path configuration and liberal privileges together result in a new database being usable as if there was no such concept as schemas.

Historical Background on the Public Schema

This compatibility concern originates from about fifteen years ago (prior to PostgreSQLversion 7.3, cf. version 7.3 release notes) when the schema feature was not part of PostgreSQL. Configuration of the public schema with liberal privileges and the search_path presence when schemas were introduced in version 7.3 allowed for compatibility of older applications, which are not schema-aware, to function unmodified with the upgraded database feature.

Otherwise there is nothing else particularly special about the public schema: some DBA’s delete it if their use case presents no requirement for it; others lock it down by revoking the default privileges.

Show Me the Code - Revoking Privileges

Let’s do some code to illustrate and expand on what we have discussed so far.

Schema privileges are managed with the GRANT and REVOKE commands to respectively add and withdraw privileges. We’ll try some specific examples for locking down the public schema, but the general syntax is:

REVOKE [ GRANT OPTION FOR ]
    { { CREATE | USAGE } [, ...] | ALL [ PRIVILEGES ] }
    ON SCHEMA schema_name [, ...]
    FROM { [ GROUP ] role_name | PUBLIC } [, ...]
    [ CASCADE | RESTRICT ]

So, as an initial lock down example, let’s remove the create privilege from the public schema. Note that in these examples the lowercase word “public” refers to the schema and could be replaced by any other valid schema name that might exist in the database. The uppercase “PUBLIC” is the special keyword that implies “all users” and could instead be replaced with a specific role name or comma-separated list of role names for more fine-grained access control.

sampledb=# REVOKE CREATE ON SCHEMA public FROM PUBLIC;
REVOKE
sampledb=# \dn+
                          List of schemas
  Name  |  Owner   |  Access privileges   |      Description       
--------+----------+----------------------+------------------------
 public | postgres | postgres=UC/postgres+| standard public schema
        |          | =U/postgres          | 
(1 row)

The only difference in this listing of schema privileges from the first is the absence of the “C” in the second privilege specification, verifying our command was effective: users other than the postgres user may no longer create tables, views, or other objects in the public schema.

Note that the above command revoking create privileges from the public schema is the recommended mitigation for a recently published vulnerability, CVE-2018-1058, which arises from the default privilege setting on the public schema.

A further level of lock down could entail denying lookup access to the schema entirely by removing the usage privilege:

sampledb=# REVOKE USAGE ON SCHEMA public FROM PUBLIC;
REVOKE
sampledb=# \dn+
                          List of schemas
  Name  |  Owner   |  Access privileges   |      Description       
--------+----------+----------------------+------------------------
 public | postgres | postgres=UC/postgres | standard public schema
(1 row)

Since all available schema privileges for non-owner users have been revoked, the entire second privilege specification disappears in the listing above.

What we did with two separate commands could have been succinctly accomplished with a single command specifying all privileges as:

sampledb=# REVOKE ALL PRIVILEGES ON SCHEMA public FROM PUBLIC;
REVOKE

Additionally, it is also possible to revoke privileges from the schema owner:

sampledb=# REVOKE ALL PRIVILEGES ON SCHEMA public FROM postgres;
REVOKE
sampledb=# \dn+
                        List of schemas
  Name  |  Owner   | Access privileges |      Description       
--------+----------+-------------------+------------------------
 public | postgres |                   | standard public schema
(1 row)

but that does not really accomplish anything practical, as the schema owner retains full privileges to owned schemas regardless of explicit assignment simply by virtue of ownership.

The liberal privilege assignment for the public schema is a special artifact associated with initial database creation. Subsequently-created schemas in an existing database do conform with the best practice of starting without assigned privileges. For example, examining schema privileges after creating a new schema named “private” shows the new schema has no privileges:

sampledb=# create schema private;
CREATE SCHEMA
sampledb=# \dn+
                          List of schemas
  Name   |  Owner   |  Access privileges   |      Description       
---------+----------+----------------------+------------------------
 private | postgres |                      | 
 public  | postgres |                      | standard public schema
(2 rows)
ClusterControl
Single Console for Your Entire Database Infrastructure
Find out what else is new in ClusterControl

Show Me the Code - Granting Privileges

The general form of the command to add privileges is:

GRANT { { CREATE | USAGE } [, ...] | ALL [ PRIVILEGES ] }
    ON SCHEMA schema_name [, ...]
    TO role_specification [, ...] [ WITH GRANT OPTION ]
where role_specification can be:
  [ GROUP ] role_name
  | PUBLIC
  | CURRENT_USER
  | SESSION_USER

Using this command we can, for example, allow all roles to lookup database objects in the private schema by adding the usage privilege with

sampledb=# GRANT USAGE ON SCHEMA private TO PUBLIC;
GRANT
sampledb=# \dn+
                          List of schemas
  Name   |  Owner   |  Access privileges   |      Description       
---------+----------+----------------------+------------------------
 private | postgres | postgres=UC/postgres+| 
         |          | =U/postgres          | 
 public  | postgres |                      | standard public schema
(2 rows)

Note how the UC privileges appear for the postgres owner as the first specification, now that we have assigned other-than-default privileges to the schema. The second specification, =U/postgres, corresponds to the GRANT command we just invoked as user postgres granting usage privilege to all users (where, recall, the empty string left of the equal sign implies “all users”).

A specific role, named “user1” for example, can be granted both create and usage privileges to the private schema with:

sampledb=# GRANT ALL PRIVILEGES ON SCHEMA private TO user1;
GRANT
sampledb=# \dn+
                          List of schemas
  Name   |  Owner   |  Access privileges   |      Description       
---------+----------+----------------------+------------------------
 private | postgres | postgres=UC/postgres+| 
         |          | =U/postgres         +| 
         |          | user1=UC/postgres    | 
 public  | postgres |                      | standard public schema
(2 rows)

We have not yet mentioned the “WITH GRANT OPTION” clause of the general command form. Just as it sounds, this clause permits a granted role the power to itself grant the specified privilege to other users, and it is denoted in the privilege listing by asterisks appended to the specific privilege:

sampledb=# GRANT ALL PRIVILEGES ON SCHEMA private TO user1 WITH GRANT OPTION;
GRANT
sampledb=# \dn+
                          List of schemas
  Name   |  Owner   |  Access privileges   |      Description       
---------+----------+----------------------+------------------------
 private | postgres | postgres=UC/postgres+| 
         |          | =U/postgres         +| 
         |          | user1=U*C*/postgres  | 
 public  | postgres |                      | standard public schema
(2 rows)

Conclusion

This wraps up the topic for today. As a final note, though, remember that we have discussed only schema access privileges. While the USAGE privilege allows lookup of database objects in a schema, to actually access the objects for specific operations, such as reading, writing, execution, and etc., the role must also have appropriate privileges for those operations on those specific database objects.

How to Design Highly Available Open Source Database Environments

$
0
0

Introduction - couple of words on “High Availability”.

These days high availability is a must for any serious deployment. Long gone are days when you could schedule a downtime of your database for several hours to perform a maintenance. If your services are not available, you are losing customers and money. Therefore making a database environment highly available has typically one of the highest priorities.

This poses a significant challenge to database administrators. First of all, how do you tell if your environment is highly available or not? How would you measure it? What are the steps you need to take in order to improve availability? How to design your setup to make it highly available from the beginning?

There are many many HA solutions available in the MySQL (and MariaDB) ecosystem, but how do we know which ones we can trust? Some solutions might work under certain specific conditions, but might cause more trouble when applied outside of these conditions. Even a basic functionality like MySQL replication, which can be configured in many ways, can cause significant harm - for instance, circular replication with multiple writeable masters. Although it is easy to set up a ‘multi-master setup’ using replication, it can very easily break and leave us with diverging datasets on different servers. For a database, which is often considered the single source of truth, compromised data integrity can have catastrophic consequences.

In the following chapters, we’ll discuss the requirements for high availability in database setups, and how to design the system from the ground up.

New Webinar: How to Measure Database Availability

$
0
0

Join us on April 24th for Part 2 of our database high availability webinar special!

In this session we will focus on how to measure database availability. It is notoriously hard to measure and report on, although it is an important KPI in any SLA between you and your customer. With that in mind, we will discuss the different factors that affect database availability and see how you can measure your database availability in a realistic way.

It is common enough to define availability in terms of 9s (e.g. 99.9% or 99.999%) - especially here at Severalnines - although there are often different opinions as to what these numbers actually mean, or how they are measured.

Is the database available if an instance is up and running, but it is unable to serve any requests? Or if response times are excessively long, so that users consider the service unusable? Is the impact of one longer outage the same as multiple shorter outages? How do partial outages affect database availability, where some users are unable to use the service while others are completely unaffected?

Not agreeing on precise definitions with your customers might lead to dissatisfaction. The database team might be reporting that they have met their availability goals, while the customer is dissatisfied with the service.

Join us for this webinar during which we will discuss the different factors that affect database availability and see how to measure database availability in a realistic way.

Register for the webinar

Date, Time & Registration

Europe/MEA/APAC

Tuesday, April 24th at 09:00 BST / 10:00 CEST (Germany, France, Sweden)

Register Now

North America/LatAm

Tuesday, April 24th at 09:00 PDT (US) / 12:00 EDT (US)

Register Now

Agenda

  • Defining availability targets
    • Critical business functions
    • Customer needs
    • Duration and frequency of downtime
    • Planned vs unplanned downtime
    • SLA
  • Measuring the database availability
    • Failover/Switchover time
    • Recovery time
    • Upgrade time
    • Queries latency
    • Restoration time from backup
    • Service outage time
  • Instrumentation and tools to measure database availability:
    • Free & open-source tools
    • CC's Operational Report
    • Paid tools

Register for the webinar

Speaker

Bartlomiej Oles is a MySQL and Oracle DBA, with over 15 years experience in managing highly available production systems at IBM, Nordea Bank, Acxiom, Lufthansa, and other Fortune 500 companies. In the past five years, his focus has been on building and applying automation tools to manage multi-datacenter database environments.


New Whitepaper: How to Design Highly Available Open Source Database Environments

$
0
0

We’re happy to announce that our latest technical whitepaper on how to design highly available open source database environments is now available to download.

Written back our colleague Krzysztof Książek, Senior Support Engineer at Severalnines, this new whitepaper is aimed at Database Administrators, System Administrators and others who may be asking themselves questions such as: How do you tell if your environment is highly available or not? How would you measure it? What are the steps you need to take in order to improve availability? How to design your setup to make it highly available from the beginning?

It discusses high availability basics, provides insight into how to design your environment for high availability and provides examples of some of the most common highly available setups.

High availability is a must nowadays for any serious deployment and the days when you could schedule a downtime of your database for several hours to perform a maintenance are long gone. For today’s businesses, unavailable services equal lost customers and money. Making a database environment highly available therefore has to be one of the highest priorities.

Of course, there are many many HA solutions available in the MySQL (and MariaDB) ecosystem, but how do we know which ones we can trust?

Some solutions might work under certain specific conditions, but might cause more trouble when applied outside of these. Even a basic functionality like MySQL replication, which can be configured in many ways, can cause significant harm - for instance, circular replication with multiple write-able masters. Although it is easy to set up a ‘multi-master setup’ using replication, it can very easily break and leave us with diverging datasets on different servers. For a database, which is often considered the single source of truth, compromised data integrity can have catastrophic consequences.

Download our new whitepaper and learn about the requirements for high availability in database setups, and how to design the system from the ground up.

Example of a minimalistic deployment of a Galera cluster within a single datacenter

Capacity Planning for MySQL and MariaDB - Dimensioning Storage Size

$
0
0

Server manufacturers and cloud providers offer different kinds of storage solutions to cater for your database needs. When buying a new server or choosing a cloud instance to run our database, we often ask ourselves - how much disk space should we allocate? As we will find out, the answer is not trivial as there are a number of aspects to consider. Disk space is something that has to be thought of upfront, because shrinking and expanding disk space can be a risky operation for a disk-based database.

In this blog post, we are going to look into how to initially size your storage space, and then plan for capacity to support the growth of your MySQL or MariaDB database.

How MySQL Utilizes Disk Space

MySQL stores data in files on the hard disk under a specific directory that has the system variable "datadir". The contents of the datadir will depend on the MySQL server version, and the loaded configuration parameters and server variables (e.g., general_log, slow_query_log, binary log).

The actual storage and retrieval information is dependent on the storage engines. For the MyISAM engine, a table's indexes are stored in the .MYI file, in the data directory, along with the .MYD and .frm files for the table. For InnoDB engine, the indexes are stored in the tablespace, along with the table. If innodb_file_per_table option is set, the indexes will be in the table's .ibd file along with the .frm file. For the memory engine, the data are stored in the memory (heap) while the structure is stored in the .frm file on disk. In the upcoming MySQL 8.0, the metadata files (.frm, .par, dp.opt) are removed with the introduction of the new data dictionary schema.

It's important to note that if you are using InnoDB shared tablespace for storing table data (innodb_file_per_table=OFF), your MySQL physical data size is expected to grow continuously even after you truncate or delete huge rows of data. The only way to reclaim the free space in this configuration is to export, delete the current databases and re-import them back via mysqldump. Thus, it's important to set innodb_file_per_table=ON if you are concerned about the disk space, so when truncating a table, the space can be reclaimed. Also, with this configuration, a huge DELETE operation won't free up the disk space unless OPTIMIZE TABLE is executed afterward.

MySQL stores each database in its own directory under the "datadir" path. In addition, log files and other related MySQL files like socket and PID files, by default, will be created under datadir as well. For performance and reliability reason, it is recommended to store MySQL log files on a separate disk or partition - especially the MySQL error log and binary logs.

Database Size Estimation

The basic way of estimating size is to find the growth ratio between two different points in time, and then multiply that with the current database size. Measuring your peak-hours database traffic for this purpose is not the best practice, and does not represent your database usage as a whole. Think about a batch operation or a stored procedure that runs at midnight, or once a week. Your database could potentially grow significantly in the morning, before possibly being shrunk by a housekeeping operation at midnight.

One possible way is to use our backups as the base element for this measurement. Physical backup like Percona Xtrabackup, MariaDB Backup and filesystem snapshot would produce a more accurate representation of your database size as compared to logical backup, since it contains the binary copy of the database and indexes. Logical backup like mysqldump only stores SQL statements that can be executed to reproduce the original database object definitions and table data. Nevertheless, you can still come out with a good growth ratio by comparing mysqldump backups.

We can use the following formula to estimate the database size:

Where,

  • Bn - Current week full backup size,
  • Bn-1 - Previous week full backup size,
  • Dbdata - Total database data size,
  • Dbindex - Total database index size,
  • 52 - Number of weeks in a year,
  • Y - Year.

The total database size (data and indexes) in MB can be calculated by using the following statements:

mysql> SELECT ROUND(SUM(data_length + index_length) / 1024 / 1024, 2) "DB Size in MB" FROM information_schema.tables;
+---------------+
| DB Size in MB |
+---------------+
|       2013.41 |
+---------------+

The above equation can be modified if you would like to use the monthly backups instead. Change the constant value of 52 to 12 (12 months in a year) and you are good to go.

Also, don't forget to account for innodb_log_file_size x 2, innodb_data_file_path and for Galera Cluster, add gcache.size value.

Binary Logs Size Estimation

Binary logs are generated by the MySQL master for replication and point-in-time recovery purposes. It is a set of log files that contain information about data modifications made on the MySQL server. The size of the binary logs depends on the number of write operations and the binary log format - STATEMENT, ROW or MIXED. Statement-based binary log are usually much smaller as compared to row-based binary log, because it only consists of the write statements while the row-based consists of modified rows information.

The best way to estimate the maximum disk usage of binary logs is to measure the binary log size for a day and multiply it with the expire_logs_days value (default is 0 - no automatic removal). It's important to set expire_logs_days so you can estimate the size correctly. By default, each binary log is capped around 1GB before MySQL rotates the binary log file. We can use a MySQL event to simply flush the binary log for the purpose of this estimation.

Firstly, make sure event_scheduler variable is enabled:

mysql> SET GLOBAL event_scheduler = ON;

Then, as a privileged user (with EVENT and RELOAD privileges), create the following event:

mysql> USE mysql;
mysql> CREATE EVENT flush_binlog
ON SCHEDULE EVERY 1 HOUR STARTS CURRENT_TIMESTAMP ENDS CURRENT_TIMESTAMP + INTERVAL 2 HOUR
COMMENT 'Flush binlogs per hour for the next 2 hours'
DO FLUSH BINARY LOGS;

For a write-intensive workload, you probably need to shorten down the interval to 30 minutes or 10 minutes before the binary log reaches 1GB maximum size, then round the output up to an hour. Then verify the status of the event by using the following statement and look at the LAST_EXECUTED column:

mysql> SELECT * FROM information_schema.events WHERE event_name='flush_binlog'\G
       ...
       LAST_EXECUTED: 2018-04-05 13:44:25
       ...

Then, take a look at the binary logs we have now:

mysql> SHOW BINARY LOGS;
+---------------+------------+
| Log_name      | File_size  |
+---------------+------------+
| binlog.000001 |        146 |
| binlog.000002 | 1073742058 |
| binlog.000003 | 1073742302 |
| binlog.000004 | 1070551371 |
| binlog.000005 | 1070254293 |
| binlog.000006 |  562350055 | <- hour #1
| binlog.000007 |  561754360 | <- hour #2
| binlog.000008 |  434015678 |
+---------------+------------+

We can then calculate the average of our binary logs growth which is around ~562 MB per hour during peak hours. Multiply this value with 24 hours and the expire_logs_days value:

mysql> SELECT (562 * 24 * @@expire_logs_days);
+---------------------------------+
| (562 * 24 * @@expire_logs_days) |
+---------------------------------+
|                           94416 |
+---------------------------------+

We will get 94416 MB which is around ~95 GB of disk space for our binary logs. Slave's relay logs are basically the same as the master's binary logs, except that they are stored on the slave side. Therefore, this calculation also applies to the slave relay logs.

Spindle Disk or Solid State?

There are two types of I/O operations on MySQL files:

  • Sequential I/O-oriented files:
    • InnoDB system tablespace (ibdata)
    • MySQL log files:
      • Binary logs (binlog.xxxx)
      • REDO logs (ib_logfile*)
      • General logs
      • Slow query logs
      • Error log
  • Random I/O-oriented files:
    • InnoDB file-per-table data file (*.ibd) with innodb_file_per_table=ON (default).

Consider placing random I/O-oriented files in a high throughput disk subsystem for best performance. This could be flash drive - either SSDs or NVRAM card, or high RPM spindle disks like SAS 15K or 10K, with hardware RAID controller and battery-backed unit. For sequential I/O-oriented files, storing on HDD with battery-backed write-cache should be good enough for MySQL. Take note that performance degradation is likely if the battery is dead.

We will cover this area (estimating disk throughput and file allocation) in a separate post.

Capacity Planning and Dimensioning

Capacity planning can help us build a production database server with enough resources to survive daily operations. We must also provision for unexpected needs, account for future storage and disk throughput needs. Thus, capacity planning is important to ensure the database has enough room to breath until the next hardware refresh cycle.

It's best to illustrate this with an example. Considering the following scenario:

  • Next hardware cycle: 3 years
  • Current database size: 2013 MB
  • Current full backup size (week N): 1177 MB
  • Previous full backup size (week N-1): 936 MB
  • Delta size: 241MB per week
  • Delta ratio: 25.7% increment per week
  • Total weeks in 3 years: 156 weeks
  • Total database size estimation: ((1177 - 936) x 2013 x 156)/936 = 80856 MB ~ 81 GB after 3 years

If you are using binary logs, sum it up from the value we got in the previous section:

  • 81 + 95 = 176 GB of storage for database and binary logs.

Add at least 100% more room for operational and maintenance tasks (local backup, data staging, error log, operating system files, etc):

  • 176 + 176 = 352 GB of total disk space.

Based on this estimation, we can conclude that we would need at least 352 GB of disk space for our database for 3 years. You can use this value to justify your new hardware purchase. For example, if you want to buy a new dedicated server, you could opt for 6 x 128 SSD RAID 10 with battery-backed RAID controller which will give you around 384 GB of total disk space. Or, if you prefer cloud, you could get 100GB of block storage with provisioned IOPS for our 81GB database usage and use the standard persistent block storage for our 95GB binary logs and other operational usage.

Happy dimensioning!

My Favorite PostgreSQL Queries and Why They Matter

$
0
0

Databases, tables, normalization, and a solid backup plan allow us to store and maintain data.

Those combined best practices, in turn, afford us interaction with that data. In today's data-driven world, data is valuable. Not only valuable, data is oftentimes critical to end-user solutions provided by products and services. Extracting insight, answering questions, and meaningful metrics from data by way of querying and data manipulation is an integral component of SQL in general.

PostgreSQL is no different.

This foundational crux is critical for success in any data-driven aspect.

Below, I present a combination of 8 differing queries or types of queries I have found interesting and engaging to explore, study, learn, or otherwise manipulate data sets.

They are not listed in any order of importance.

Most will probably be familiar old friends. Perhaps some will become new acquaintances.

Sample tables and data used are not as important as the actual construction of the queries themselves and what each query returns, offers, or provides. Many of them are mock and derived for demonstration purposes and should not be taken literally in their values.

1. Left join, mind any nulls on the right...

Suppose in this example, we have a running sale of two months and are getting a total of both combined.

Yet, for some reason, the second month did not pull its weight and we want to target what days month one picked up the slack.

These sales are represented as tables payment and fake_month for this demonstration.

To note:

  • We will only check for totals greater than 2000.
  • We will limit the output to just 10 rows.

To start, we have this Common Table Expression (CTE) 'generating' the fake_month table for us, and query that follows.

dvdrental=> WITH fake_month AS(
SELECT setup::date
FROM generate_series('2007-02-01', '2007-02-28', INTERVAL '1 day') AS setup
)
SELECT date_part('day', p.payment_date)::INT AS legit,
SUM(p.amount),
date_part('day', fk.setup)::INT AS fake
FROM payment AS p
LEFT JOIN fake_month AS fk
ON date_part('day', fk.setup)::INT = date_part('day', p.payment_date)::INT
GROUP BY legit, fake
HAVING SUM(p.amount) > 2000
LIMIT 10;
legit | sum | fake
-------+---------+------
1 | 2808.24 | 1
2 | 2550.05 | 2
6 | 2077.14 | 6
8 | 2227.84 | 8
9 | 2067.86 | 9
17 | 3630.33 | 17
18 | 3977.74 | 18
19 | 3908.59 | 19
20 | 3888.98 | 20
21 | 3786.14 | 21
(10 rows)

Looks as if both months contributed there. So is this solved?

Before we consider this solved, let's visit the ORDER BY clause.

Of course, you can ORDER BY ASC or DESC.

However, you can also ORDER BY NULLS first or last and that changes things up a bit.

Let's rewrite this query and use ORDER BY NULLS first on the legit column.

For brevity, I'll remove the CTE from the output, just know it is still there and being used.

SELECT date_part('day', p.payment_date)::INT AS legit,
SUM(p.amount),
date_part('day', fk.setup)::INT AS fake
FROM payment AS p
LEFT JOIN fake_month AS fk
ON date_part('day', fk.setup)::INT = date_part('day', p.payment_date)::INT
GROUP BY legit, fake
HAVING SUM(p.amount) > 2000
ORDER BY legit NULLS first
LIMIT 10;
legit | sum | fake
-------+---------+------
1 | 2808.24 | 1
2 | 2550.05 | 2
6 | 2077.14 | 6
8 | 2227.84 | 8
9 | 2067.86 | 9
17 | 3630.33 | 17
18 | 3977.74 | 18
19 | 3908.59 | 19
20 | 3888.98 | 20
21 | 3786.14 | 21
(10 rows)

No difference there at all.

What if we ORDER BY NULLS first on the fake column? The one on the right side of the JOIN?

Let's see.

SELECT date_part('day', p.payment_date)::INT AS legit,
SUM(p.amount),
date_part('day', fk.setup)::INT AS fake
FROM payment AS p
LEFT JOIN fake_month AS fk
ON date_part('day', fk.setup)::INT = date_part('day', p.payment_date)::INT
GROUP BY legit, fake
HAVING SUM(p.amount) > 2000
ORDER BY fake NULLS first
LIMIT 10;
legit | sum | fake
-------+---------+------
29 | 2717.60 |
30 | 5723.89 |
1 | 2808.24 | 1
2 | 2550.05 | 2
6 | 2077.14 | 6
8 | 2227.84 | 8
9 | 2067.86 | 9
17 | 3630.33 | 17
18 | 3977.74 | 18
19 | 3908.59 | 19
(10 rows)

Now we are getting somewhere. We can see for days 29 & 30, the fake column has been ordered from the top of the results set.

Due to ORDER BY fake NULLS first.

This solves our question, to what days 'sale 2' slacked off.

Are you wondering...

"Can we just filter with WHERE fake IS NULL?"

Like this:

SELECT date_part('day', p.payment_date)::INT AS legit,
SUM(p.amount),
date_part('day', fk.setup)::INT AS fake
FROM payment AS p
LEFT JOIN fake_month AS fk
ON date_part('day', fk.setup)::INT = date_part('day', p.payment_date)::INT
WHERE date_part('day', fk.setup) IS NULL
GROUP BY legit, fake
HAVING SUM(p.amount) > 2000
LIMIT 10;
legit | sum | fake
-------+---------+------
29 | 2717.60 |
30 | 5723.89 |
(2 rows)

Yes that works. So why not just use that query instead? Why it matters?

I feel using LEFT JOIN and ORDER BY NULLS first for the table on the right side of the JOIN, is a great way to explore unfamiliar tables and data sets.

By confirming what, if any, data is ‘missing’ on that side of the join condition first; enhances clarity and awareness, allowing you to then filter out the results set with the WHERE <column_name> IS NULL clause, finalizing things up.

Of course, familiarity with the tables and datasets could potentially eliminate the need for the LEFT JOIN presented here.

It's a worthy query for anyone utilizing PostgreSQL to at least try, during exploration.

2. String Concatenation

Concatenation, the joining or appending of two strings, provides a presentation option for results sets. Many 'things' can be concatenated.

However, as noted in the documentation, the string concatenation operator ('||') accepts non-string input, as long as one is a string.

Let' see some examples with the below queries:

postgres=> SELECT 2||' times'||' 2 equals: '|| 2*2;
?column?
---------------------
2 times 2 equals: 4
(1 row)

We can see, numbers and strings all can be concatenated together as mentioned above.

The '||' operator is but one of those available in PostgreSQL.

The concat() function accepts multiple arguments, concatenating them all on return.

Here's an example of that function in action:

postgres=> SELECT concat('Josh ','Otwell') AS first_name;
first_name
-------------
Josh Otwell
(1 row)

We can pass in more than two arguments if desired:

postgres=> SELECT concat('Josh','','Otwell') AS first_name;
first_name
-------------
Josh Otwell
(1 row)

Let's note something real quick with these next examples:

postgres=> SELECT CONCAT('Josh',NULL,'Otwell') AS first_name;
first_name
------------
JoshOtwell
(1 row)
postgres=> SELECT 'Josh '||NULL||'Otwell' AS first_name;
first_name
------------
(1 row)
postgres=> SELECT NULL||'Josh '||'Otwell' AS first_name;
first_name
------------
(1 row)
postgres=> SELECT CONCAT(NULL,'Josh','Otwell') AS first_name;
first_name
------------
JoshOtwell
(1 row)

Observe that the concat() function ignores NULL no matter where placed in the list of parameters, while the string concatenation operator does not.

NULL is returned if present anywhere in the string to concatenate.

Just be aware of that.

Instead of manually including within the string to be concatenated, PostgreSQL also includes a concat_ws() function that accepts a string separator as the first parameter.

We will visit it with these queries:

postgres=> SELECT concat_ws('-',333,454,1919) AS cell_num;
cell_num
--------------
333-454-1919
(1 row)
postgres=> SELECT concat_ws('','Josh','Otwell') AS first_name;
first_name
-------------
Josh Otwell
(1 row)

concat_ws() accepts either numbers or strings as arguments and as stated above, uses the first argument as the separator.

How does concat_ws() treat NULL?

postgres=> SELECT concat_ws('-',333,NULL,1919) AS cell_num;
cell_num
----------
333-1919
(1 row)
postgres=> SELECT concat_ws(NULL,333,454,1919) AS cell_num;
cell_num
----------
(1 row)

NULL is ignored unless it is the separator argument given to concat_ws().

Then, all arguments are ignored and NULL is returned instead.

Concatenation is cool...

Now that we have an idea of how concatenation works, let's look at a couple of examples of it.

Back to the mock DVD rental database

Suppose we need to compile a list of customers first and last names, along with their email address to send out a memo for updating their account.

I will limit the output to just 10 rows for brevity's sake, but still demonstrating the || operator.

dvdrental=> SELECT first_name||''||last_name||'''s email address is: '||email AS name_and_email
FROM customer
LIMIT 10;
name_and_email
--------------------------------------------------------------------------
Jared Ely's email address is: jared.ely@sakilacustomer.org
Mary Smith's email address is: mary.smith@sakilacustomer.org
Patricia Johnson's email address is: patricia.johnson@sakilacustomer.org
Linda Williams's email address is: linda.williams@sakilacustomer.org
Barbara Jones's email address is: barbara.jones@sakilacustomer.org
Elizabeth Brown's email address is: elizabeth.brown@sakilacustomer.org
Jennifer Davis's email address is: jennifer.davis@sakilacustomer.org
Maria Miller's email address is: maria.miller@sakilacustomer.org
Susan Wilson's email address is: susan.wilson@sakilacustomer.org
Margaret Moore's email address is: margaret.moore@sakilacustomer.org
(10 rows)

Notice we had to escape the single quote used with apostrophe s, using an additional single quote to show possession of the email address for each customer.

Why you should know?

There may be times when concatenating data presents you with better insight and understanding into the data set you are working with. Along with reporting options, concatenating shared datasets with others' could potentially make them (the data) more readable and digestible.

3. Supplying IN values list with Subquery's

A Subquery has numerous powerful uses. Of those, providing an IN list of values to check for membership is a common one.

Here's a quick use.

Suppose we have customer and payments tables in a mock DVD rental store and want to reward our top five highest spending customers who rented movies during the days of April 10 - 13.

Imagine that's a special target period. So if the customer spent more than $30, we want to acknowledge them.

Bear in mind, there are other available options for solving this type of question (i.e., joins, capturing results from multiple selects, etc...), yet, sub-queries can handle it as well.

We will start out with the whole shebang here. This complete query returns everything we want for this particular question.

dvdrental=> SELECT first_name, last_name, email
FROM customer
WHERE customer_id IN (
SELECT customer_id FROM (
SELECT DISTINCT customer_id, SUM(amount)
FROM payment
WHERE extract(month from payment_date) = 4
AND extract(day from payment_date) BETWEEN 10 AND 13
GROUP BY customer_id
HAVING SUM(amount) > 30
ORDER BY SUM(amount) DESC
LIMIT 5) AS top_five);

This example actually contains nested subquery's, one of which is a Derived Table.

Let's start by drilling into the innermost subquery, that Derived Table.

This subquery is a standalone SELECT statement all its own, returning a customer_id and a SUM() on the amount column.

Only those customers meeting the criteria checked by the WHERE and HAVING clauses make the cut, being further thinned out with LIMIT 5;

Why the next subquery you ask?

Can we not just use the WHERE customer_id IN portion of the outermost SELECT here?

Let's see with a hands-on approach.

I will remove the AS top_five from the subquery and try the outermost query with it now:

dvdrental=> SELECT first_name, last_name, email
FROM customer
WHERE customer_id IN
(SELECT DISTINCT customer_id, SUM(amount)
FROM payment
WHERE extract(month from payment_date) = 4
AND extract(day from payment_date) BETWEEN 10 AND 13
GROUP BY customer_id
HAVING SUM(amount) > 30
ORDER BY SUM(amount) DESC
LIMIT 5);
ERROR: subquery has too many columns
LINE 3: WHERE customer_id IN (

Here, IN membership is being tested with only the customer_id column, yet the Derived Table returns two columns and PostgreSQL lets us know.

One remedy is to use another subquery. Selecting only the customer_id from the Derived Table results set, creates the next inner nested subquery.

Now the IN predicate contains multiple rows of one column's values to check membership against the WHERE clause for customer_id to make the final results set.

Why it matters?

Utilizing subquery's in this manner is powerful due to the fact of the number of values that could potentially be tested with the IN() predicate.

Imagine if there were a 100? Or more?

'Hard-coding' all of them in the IN() list could become problematic and error-prone as the volume of values increases.

4. generate_series()

This set returning function, is handy and super fun to use and explore. I have used generate_series() in above examples, but it deserves a talk of its own. Focusing more on the function and capabilities.

I find generate_series() useful for comparative queries where some, or all data is missing.

Or only partial data is available at the time I am exploring. One handy use is populating tables with 'dummy data'.

To start, we will create a simple table:

trial=> CREATE TABLE tbl_1(
trial(> tb_id SERIAL PRIMARY KEY,
trial(> some_day DATE,
trial(> an_amt NUMERIC(4,2));
CREATE TABLE

Then use generate_series() as the VALUES for our INSERT statement:

trial=> INSERT INTO tbl_1(some_day, an_amt)
VALUES(
generate_series('2018-04-01','2018-04-15',INTERVAL '1 day'),
generate_series(2.43, 34.20, 1.03));
INSERT 0 31

Then create a second table

trial=> CREATE TABLE tbl_2(
tb2_id SERIAL PRIMARY KEY,
some_day2 DATE,
an_amt2 NUMERIC(4,2));
CREATE TABLE

Also, populate it using generate_series() in the INSERT statement:

trial=> INSERT INTO tbl_2(some_day2, an_amt2)
VALUES(
generate_series('2018-05-16','2018-05-31',INTERVAL '1 day'),
generate_series(15.43, 31., 1.03));
INSERT 0 16

Why it matters?

To reiterate, generate_series() is so useful for creating mock or practice data.

I have found mimicking month or day ranges for comparison is exceptional with generate_series(). Refer to section 1 and the CTE there, demonstrates this use.

Creating a set of complete data with generate_series() and using to compare against stored data to determine if any data is missing holds great value as well.

5. Query's with the COUNT() aggregate function.

This simple, yet effective aggregate function should be in anyone's arsenal. Especially when exploring tables or data sets for the first time.

I mean, do you really want to 'SELECT everything' from a table with 1M rows?

Determine with COUNT(*) how many records are present before you load up.

Let's find out how many rows the film table has in this mock DVD rental table:

dvdrental=> SELECT COUNT(*)
dvdrental-> FROM film;
count
-------
1000
(1 row)

While not quite as extensive as 1M+ rows, I'm sure you see the usefulness.

To return the number of specific rows, COUNT(*) can be filtered with a WHERE clause.

Let's see how many films have a 'G' rating:

dvdrental=> SELECT COUNT(*)
dvdrental-> FROM film
dvdrental-> WHERE rating = 'G';
count
-------
178
(1 row)

There is another form of COUNT() to be aware of. COUNT(some_expression).

The differences between them are:

  • COUNT(*) returns the total of all input rows (including NULLS and duplicates).
  • COUNT(some_expression) counts the number of non-NULL input rows.

When used in conjunction with the DISTINCT keyword, COUNT() will eliminate duplicate entries and return only unique values.

Let's see that in action using COUNT() with DISTINCT to determine how many unique types of ratings are present:

dvdrental=> SELECT COUNT(DISTINCT rating) FROM film;
count
-------
5
(1 row)

With this query, we know there are 5 types of ratings.

Why it matters?

Depending on what is being tracked or targeted, knowing how many of something exists can be important. Therefore, utilizing COUNT(*) or COUNT(some_expression) assists with these types of challenges.

Just remember COUNT(*) does not ignore NULL. All rows, duplicate and NULL values included, are returned as part of the final number.

6. UPDATE multiple rows with a CASE expression.

Suppose we have this table:

trial=> SELECT * FROM reward_members;
rm_id | expense_amt | member_status
-------+-------------+---------------
1 | 1245.33 | gold
2 | 1300.49 | gold
3 | 900.20 | bronze
4 | 2534.44 | platinum
5 | 600.19 | bronze
6 | 1001.55 | silver
7 | 1097.99 | silver
8 | 3033.33 | platinum
(8 rows)

We need to rename the member_status column and add 'group' to the end of the current name present for each record.

For starters, multiple individual UPDATE statements will accomplish this no problem.

But, so can a single CASE expression.

trial=> UPDATE reward_members
SET member_status = (
CASE member_status
WHEN 'gold' THEN 'gold_group'
WHEN 'bronze' THEN 'bronze_group'
WHEN 'platinum' THEN 'platinum_group'
WHEN 'silver' THEN 'silver_group'
END
)
WHERE member_status IN ('gold', 'bronze','platinum', 'silver');
UPDATE 8

Let's query the table again to see the changes:

trial=> SELECT * FROM reward_members;
rm_id | expense_amt | member_status
-------+-------------+----------------
1 | 1245.33 | gold_group
2 | 1300.49 | gold_group
3 | 900.20 | bronze_group
4 | 2534.44 | platinum_group
5 | 600.19 | bronze_group
6 | 1001.55 | silver_group
7 | 1097.99 | silver_group
8 | 3033.33 | platinum_group
(8 rows)

All update were successful.

Why it matters?

You can imagine how many round trips this would take to the server if multiple individual UPDATE statements had been run. In truth, only 4 for this example. But still, the potential for many is always there.

Yet, using an UPDATE with CASE expression, we are sending only one query instead.

7. COPY and \copy

PostgreSQL provides COPY, a command for exporting data between files and tables.

Be sure and visit the provided link to see the abundant number of options available with COPY.

An important note concerning COPY. SUPERUSER role privilege is required to execute this command.

The psql meta-command \copy is an alternative for those users not deemed this role attribute. We will visit that command in turn shortly.

First, let's run a COPY command to export certain columns to a CSV file on the local machine.

Assume we have this query result to for export:

trial=# SELECT expense_amt, member_status
trial-# FROM reward_members
trial-# WHERE member_status = 'gold_group';
expense_amt | member_status
-------------+---------------
1245.33 | gold_group
1300.49 | gold_group
(2 rows)

With COPY, we can use that SELECT statement to complete this export.

trial=# COPY (SELECT expense_amt, member_status
FROM reward_members
WHERE member_status = 'gold_group')
TO '/home/linux_user_here/awards_to_honor.csv'
DELIMITER ','
CSV HEADER;
COPY 2

*Note: Per the documentation, the query must be within parenthesis.

Let's now check the contents of that file:

$ cat awards_to_honor.csv
expense_amt,member_status
1245.33,gold_group
1300.49,gold_group

We can see the first line contains the HEADER (which are the column names) and both lines have the expense_amt and member_status data for both columns returned from the WHERE clause filter.

Another important caveat I discovered from executing the above COPY command.

The user must have privileges to write to the file at the OS level.

In my case, fixed with:

$ sudo chown postgres awards_to_honor.csv

You can avoid this issue by instead writing to a system file the current user has access to such as /tmp (shown below.)

trial=# COPY (SELECT expense_amt, member_status
FROM reward_members
WHERE member_status = 'gold_group')
TO '/tmp/awards_to_honor.csv'
DELIMITER ','
CSV HEADER;
COPY 2

However, one of my test roles without the SUPERUSER attribute, ran into problems writing to the /tmp file.

See below for confirmation:

trial=# SET role log_user; -- changing from postgres user to log_user
SET

Now attempting the same COPY command, writing to the /tmp folder

trial=> COPY (SELECT expense_amt, member_status
FROM reward_members
WHERE member_status = 'gold_group')
TO '/tmp/awards_to_honor2.csv'
DELIMITER ','
CSV HEADER;
ERROR: must be superuser to COPY to or from a file
HINT: Anyone can COPY to stdout or from stdin. psql's \copy command also works for anyone.

Perhaps a better measure, as suggested in the HINT:, for roles without the SUPERUSER attribute, is the psql \copy meta-command.

Let's carry-out a similar type of command with \copy instead using the same role, without the need for that SUPERUSER attribute.

trial=> \copy (SELECT expense_amt, member_status
FROM reward_members
WHERE member_status = 'silver_group')
TO '/home/linux_user_here/more_awards.csv'
DELIMITER ','
CSV HEADER;
COPY 2

No problems there.

And the files' contents,

$ cat more_awards.csv
expense_amt,member_status
1001.55,silver_group
1097.99,silver_group

Also works for the /tmp folder:

trial=> \copy (SELECT expense_amt, member_status
FROM reward_members
WHERE member_status = 'silver_group')
TO '/tmp/more_awards.csv'
DELIMITER ','
CSV HEADER;
COPY 2

Same contents present in the written file as well:

trial=> \! cat /tmp/more_awards.csv
expense_amt,member_status
1001.55,silver_group
1097.99,silver_group

Why it matters?

Importing data into PostgreSQL via files is a surefire bulk upload method. Although all are not covered in this blog post, COPY and \copy both, offer several options for working with different file formats and extensions.

On the same token, exporting data from tables, or specific columns is easily handled with both of these commands as well.

8. psql \help meta-command

You're in a psql command-line session. Curious about the CREATE INDEX command syntax?

No need and going to a browser or another document.

Try this instead:

trial=> \help CREATE INDEX
Command: CREATE INDEX
Description: define a new index
Syntax:
CREATE [ UNIQUE ] INDEX [ CONCURRENTLY ] [ [ IF NOT EXISTS ] name ] ON table_name [ USING method ]
( { column_name | ( expression ) } [ COLLATE collation ] [ opclass ] [ ASC | DESC ] [ NULLS { FIRST | LAST } ] [, ...] )
[ WITH ( storage_parameter = value [, ... ] ) ]
[ TABLESPACE tablespace_name ]
[ WHERE predicate ]

To know what help text is available, you can run \help by itself and get a list of available options.

I won't list them all out here, just know that option is available.

Why it matters?

The fact this meta-command is super easy to use, powerful, and convenient are enough pros to mention it here. It's saved me tons of time spent searching throughout other documentation. And of course, being a newbie, I use it quite often!

Conclusion

This is not an exhaustive list. Nor the 'be all end all' of queries and data manipulation.

Only my take on those that pique my interest and speak to me as I continue to learn and grow into a SQL Developer role. I hope through this blog post, you will find use cases for the above queries and commands, implementing those where you see fit.

How to Achieve GDPR Compliance: Documenting Our Experience (II)

$
0
0

Introduction

The General Data Protection Regulation (GDPR) is just around the corner, and we’re sharing with you the things we’re doing to make sure we’re ready. As the GDPR will be taking effect on May 25th, 2018, we’ve spent the past few months, along with organizations all over the world, preparing to ensure we comply with the expectations highlighted within the regulation. For details on our initial phases of preparation and research read, How to Achieve GDPR Compliance: Documenting Our Experience (I).

In case you didn’t know, the GDPR is a new regulation for the processing of personal data of data subjects residing in European Union countries. Essentially, it is meant to protect the rights of residents in EU countries in regards to the fair and lawful processing of their personal information. One very important concept outlined in the Regulation is “Privacy and the Protection of Personal Data as a Fundamental Right”. This can be interpreted in variations but essentially it means that data subjects have a fundamental right to protect and to protection of their privacy and personal data being processed by companies, organizations, or third parties. These data subjects have final say as to whether or not they consent to the processing of their personal data, and if there are errors , they have the right to request corrections or deletion.

Like thousands of other businesses, the new regulation impacts us directly, and so we thought this would be a good opportunity to share with our readers and others what we are doing to prepare for the GDPR.

Action Items Checklist

In our previous blog on GDPR we covered many of the actions items below. So at this stage our action items look something like this:

Action Items

  • Assign designated Data Protection Officers
  • Identify core compliance team
  • Identify appropriate EU Supervisory authority and contact
  • Identify internal legal agreements (for employees & contractors)
  • Hold initial GDPR Introductory meeting
  • Assemble a Data Storage Inventory
  • Perform and document an existing privacy and security analysis
  • Carry out data protection impact assessment for high risk activities
  • Data Processor and Controller Agreements
  • Create operational & technical roadmap
  • Identify certifications and compliance recognition

Notes on Data Inventory

One of the first things to do, after getting the GDPR team together and identifying action items for GDPR compliance, was to begin a data inventory. We began with identifying the “what, where, how, and why” for all of our data processing activities, with the help of a knowledgeable representative from each department within the company. Then it was time to generate a comprehensive data inventory. We were sure to add a column for third parties and partners who might act as either data controllers or data processors on our behalf. And we were careful to be overinclusive at this stage to avoid letting anything slip through the cracks.The data inventory served as the foundation for many of our action items moving forward like, performing a privacy and security analysis, identifying high risk activities, and it will be guiding the creation of our operational and technical roadmap.

Privacy and Security Analysis

The goal of the privacy and security analysis is twofold: One, to identify potential high-risk activities we may be performing; and two, to document all company-wide processing activities to the best of our abilities (this will come into play later, when creating our operational and technical roadmap).

As for determining which activities we deem to be “high-risk” we first needed to come to an understanding, as a team, of the definition of “high-risk”. With the help of examples described in the GDPR documentation we were able to agree that high-risk processing activities are any of the following:

  1. Processing activities that are likely to result in “a risk for the rights and freedom” of the individual.
  2. Where there is potential for “accidental or unlawful destruction, loss, alteration, unauthorised disclosure of, or access to personal data transmitted, stored or otherwise processed.
  3. Where data processing activities involve “new technologies, or are of a new kind and where no data protection impact assessment has been carried out.

We then used these definitions in conjunction with our data inventory to identify which of our activities (if any) met any of these definitions of high-risk.

DPIA’s for High Risk Activities

In the GDPR it states that for any high-risk processing activities a company must perform a Data Protection Impact Assessment (DPIA). Therefore, a templated DPIA document was in order, should any high-risk activity be identified or later discovered. This ensured a standardized way of reporting on processing activities and gave our departmental GRPR committee members easy access to the necessary tools, when the time comes to perform a DPIA.

The regulation identifies some of the necessary items to be addressed in each DPIA, including, purpose of processing, necessity of processing (how much of the specific processing is done in the name of the described purpose), potential risk, and measures to address risk. Keep in mind that each DPIA we would perform would be done for a very specific processing activity, keeping all potentially “high-risk” processing activities clearly documented and accurately assessed.

Create data processor and controller agreements

Another component described in the regulation is to ensure that any controller or processor of personal data is aware of and in compliance with the GDPR. Therefore, we took some time to develop agreements for data processors and controllers to both recognize our compliance with the GDPR and to ensure their understanding of compliance with the regulation and how we expect any processing on our behalf to be handled by them. We found no ready-made templates for these agreement, so we made some addendums to existing agreements and if you are a company who may not have access to relevant legal services you may want to consider the same. (disclaimer: not official legal advice)

Obstacles

At this stage in our GDPR journey we discovered a few obstacles worth noting. For one, while we work with many enterprise companies, we run as a rather lean organization. There are benefits for companies like us outlined in the regulation, like seemingly lesser expectations from a documentation standpoint. However, we still wanted to make sure we have everything in place to keep enterprise clients satisfied with our privacy policies and operation. That said, rather than taking the easy route and forgoing some of the documentation steps, we decided to proceed with our due diligence and assess our processing activities just like the big players.

Secondly, there is a vagueness surrounding a fundamental component of the GDPR, in that it highlights processing activities with the “potential of risk to the rights and freedoms” of an individual as high-risk activities. Additionally, it describes a fundamental truth, that privacy and the protection of privacy is a fundamental right. So I was left with the question, Is the processing of all personal data then considered high-risk? After all there is potential of risk in all processing of data, is there not? In any case, we decided to be over-vigilant in cases where the question arose, to be sure that any risk is properly addressed, without overdoing it of course.

What's Next

Next steps in our GDPR journey will be to create and document our operational and technical roadmap, identify certifications and compliance recognition, and come May 25th we will have everything in place to be in compliance with the General Data Protection Regulation. Stay tuned in the coming weeks for our third and final blog on our GDPR journey.

GDPR Definitions

Data Controller - the entity that determines the purposes, conditions and means of the processing of personal data
Data Processor - the entity that processes data on behalf of the Data Controller

ref: eugdpr.org

GDPR Resources

How to Make Your MySQL or MariaDB Database Highly Available on AWS and Google Cloud

$
0
0

Running databases on cloud infrastructure is getting increasingly popular these days. Although a cloud VM may not be as reliable as an enterprise-grade server, the main cloud providers offer a variety of tools to increase service availability. In this blog post, we’ll show you how to architect your MySQL or MariaDB database for high availability, in the cloud. We will be looking specifically at Amazon Web Services and Google Cloud Platform, but most of the tips can be used with other cloud providers too.

Both AWS and Google offer database services on their clouds, and these services can be configured for high availability. It is possible to have copies in different availability zones (or zones in GCP), in order to increase your chances to survive partial failure of services within a region. Although a hosted service is a very convenient way of running a database, note that the service is designed to behave in a specific way and that may or may not fit your requirements. So for instance, AWS RDS for MySQL has a pretty limited list of options when it comes to failover handling. Multi-AZ deployments come with 60-120 seconds failover time as per the documentation. In fact, given the “shadow” MySQL instance has to start from a “corrupted” dataset, this may take even longer as more work could be required on applying or rolling back transactions from InnoDB redo logs. There is an option to promote a slave to become a master, but it is not feasible as you cannot reslave existing slaves off the new master. In the case of a managed service, it is also intrinsically more complex and harder to trace performance problems. More insights on RDS for MySQL and its limitations in this blog post.

On the other hand, if you decide to manage the databases, you are in a different world of possibilities. A number of things that you can do on bare metal are also possible on EC2 or Compute Engine instances. You do not have the overhead of managing the underlying hardware, and yet retain control on how to architect the system. There are two main options when designing for MySQL availability - MySQL replication and Galera Cluster. Let’s discuss them.

MySQL Replication

MySQL replication is a common way of scaling MySQL with multiple copies of the data. Asynchronous or semi-synchronous, it allows to propagate changes executed on a single writer, the master, to replicas/slaves - each of which would contain the full data set and can be promoted to become the new master. Replication can also be used for scaling reads, by directing read traffic to replicas and offloading the master in this way. The main advantage of replication is the ease of use - it is so widely known and popular (it’s also easy to configure) that there are numerous resources and tools to help you manage and configure it. Our own ClusterControl is one of them - you can use it to easily deploy a MySQL replication setup with integrated load balancers, manage topology changes, failover/recovery, and so on.

One major issue with MySQL replication is that it is not designed to handle network splits or master’s failure. If a master goes down, you have to promote one of the replicas. This is a manual process, although it can be automated with external tools (e.g. ClusterControl). There is also no quorum mechanism and there is no support for fencing of failed master instances in MySQL replication. Unfortunately, this may lead to serious issues in distributed environments - if you promoted a new master while your old one comes back online, you may end up writing to two nodes, creating data drift and causing serious data consistency issues.

We’ll look into some examples later in this post, that shows you how to detect network splits and implement STONITH or some other fencing mechanism for your MySQL replication setup.

Galera Cluster

We saw in the previous section that MySQL replication lacks fencing and quorum support - this is where Galera Cluster shines. It has a quorum support built-in, it also has a fencing mechanism which prevents partitioned nodes from accepting writes. This makes Galera Cluster more suitable than replication in multi-datacenter setups. Galera Cluster also supports multiple writers, and is able to resolve write conflicts. You are therefore not limited to a single writer in a multi-datacenter setup, it is possible to have a writer in every datacenter which reduces the latency between your application and database tier. It does not speed up writes as every write still has to be sent to every Galera node for certification, but it’s still easier than to send writes from all application servers across WAN to one single remote master.

As good as Galera is, it is not always the best choice for all workloads. Galera is not a drop-in replacement for MySQL/InnoDB. It shares common features with “normal” MySQL -  it uses InnoDB as storage engine, it contains the entire dataset on every node, which makes JOINs feasible. Still, some of the performance characteristics of Galera (like the performance of writes which are affected by network latency) differ from what you’d expect from replication setups. Maintenance looks different too: schema change handling works slightly different. Some schema designs are not optimal: if you have hotspots in your tables, like frequently updated counters, this may lead to performance issues. There is also a difference in best practices related to batch processing - instead of executing queries in large transactions, you want your transactions to be small.

Proxy tier

It is very hard and cumbersome to build a highly available setup without proxies. Sure, you can write code in your application to keep track of database instances, blacklist unhealthy ones, keep track of the writeable master(s), and so on. But this is much more complex than just sending traffic to a single endpoint - which is where a proxy comes in. ClusterControl allows you to deploy ProxySQL, HAProxy and MaxScale. We will give some examples using ProxySQL, as it gives us good flexibility in controlling database traffic.

ProxySQL can be deployed in a couple of ways. For starters, it can be deployed on separate hosts and Keepalived can be used to provide Virtual IP. The Virtual IP will be moved around should one of the ProxySQL instances fail. In the cloud, this setup can be problematic as adding an IP to the interface usually is not enough. You would have to modify Keepalived configuration and scripts to work with elastic IP (or static -however it might be called by your cloud provider). Then one would use cloud API or CLI to relocate this IP address to another host. For this reason, we’d suggest to collocate ProxySQL with the application. Each application server would be configured to connect to the local ProxySQL, using Unix sockets. As ProxySQL uses an angel process, ProxySQL crashes can be detected/restarted within a second. In case of hardware crash, that particular application server will go down along with ProxySQL. The remaining application servers can still access their respective local ProxySQL instances. This particular setup has additional features. Security - ProxySQL, as of version 1.4.8, does not have support for client-side SSL. It can only setup SSL connection between ProxySQL and the backend. Collocating ProxySQL on the application host and using Unix sockets is a good workaround. ProxySQL also has the ability to cache queries and if you are going to use this feature, it makes sense to keep it as close to the application as possible to reduce latency. We would suggest to use this pattern to deploy ProxySQL.

Typical setups

Let’s take a look at examples of highly available setups.

Single datacenter, MySQL replication

The assumption here is that there are two separate zones within the datacenter. Each zone has redundant and separate power, networking and connectivity to reduce the likelihood of two zones failing simultaneously. It is possible to set up a replication topology spanning both zones.

Here we use ClusterControl to manage the failover. To solve the split-brain scenario between availability zones, we collocate the active ClusterControl with the master. We also blacklist slaves in the other availability zone to make sure that automated failover won’t result in two masters being available.

Multiple datacenters, MySQL replication

In this example we use three datacenters and Orchestrator/Raft for quorum calculation. You might have to write your own scripts to implement STONITH if master is in the partitioned segment of the infrastructure. ClusterControl is used for node recovery and management functions.

Multiple datacenters, Galera Cluster

In this case we use three datacenters with a Galera arbitrator in the third one - this makes possible to handle whole datacenter failure and reduces a risk of network partitioning as the third datacenter can be used as a relay.

For further reading, take a look at the “How to Design Highly Available Open Source Database Environments” whitepaper and watch the webinar replay “Designing Open Source Databases for High Availability”.

Ten Tips for Going into Production with PostgreSQL

$
0
0

Going into production is a very important task that must be carefully thought and planned beforehand. Some not so good decisions may be easily corrected afterwards, but some others not. So it is always better to spend that extra time in reading the official docs, books and research made by others early, than be sorry later. This is true for most computer systems deployments, and PostgreSQL is no exception.

System Initial Planning

Some decisions must be taken early on, before the system goes live. The PostgreSQL DBA must answer a number of questions: Will the DB run on bare metal, VMs or even containerized? Will it run on the organization’s premises or in the cloud? Which OS will be used? Is the storage going to be of spinning disks type or SSDs? For each scenario or decision, there are pros and cons and the final call will be made in cooperation with the stakeholders according to the organization’s requirements. Traditionally people used to run PostgreSQL on bare metal, but this has changed dramatically in the recent years with more and more cloud providers offering PostgreSQL as a standard option, which is a sign of the wide adoption and a result of increasing popularity of PostgreSQL. Independently of the specific solution, the DBA must ensure that the data will be safe, meaning that the database will be able to survive crashes, and this is the No1 criterion when making decisions about hardware and storage. So this brings us to the first tip!

Tip 1

No matter what the disk controller or disk manufacturer or cloud storage provider advertises, you should always make sure that the storage does not lie about fsync. Once fsync returns OK, the data should be safe on the medium no matter what happens afterwards (crash, power failure, etc). One nice tool that will help you test the reliability of your disks’ write-back cache is diskchecker.pl.

Just read the notes: https://brad.livejournal.com/2116715.html and do the test.

Use one machine to listen to events and the actual machine to test. You should see:

 verifying: 0.00%
 verifying: 10.65%
…..
 verifying: 100.00%
Total errors: 0

at the end of the report on the tested machine.

The second concern after reliability should be about performance. Decisions about system (CPU, memory), used to be much more vital since it was quite hard to change them later. But in today’s, in the cloud era, we can be more flexible about the systems that the DB runs on. The same is true for storage, especially in the early life of a system and while the sizes are still small. When the DB gets past the TB figure in size, then it gets harder and harder to change basic storage parameters without the need to entirely copy the database - or even worse, to perform a pg_dump, pg_restore. The second tip is about system performance.

Tip 2

Similarly to always testing the manufacturers’ promises regarding reliability, the same you should do about hardware performance. Bonnie++ is the most popular storage performance benchmark for Unix-like systems. For overall system testing (CPU, Memory and also storage) nothing is more representative than the DB’s performance. So the basic performance test on your new system would be running pgbench, the official PostgreSQL benchmark suite based on TCP-B.

Getting started with pgbench is fairly easy, all you have to do is:

postgres@debianpgsql1:~$ createdb pgbench
postgres@debianpgsql1:~$ pgbench -i pgbench
NOTICE:  table "pgbench_history" does not exist, skipping
NOTICE:  table "pgbench_tellers" does not exist, skipping
NOTICE:  table "pgbench_accounts" does not exist, skipping
NOTICE:  table "pgbench_branches" does not exist, skipping
creating tables...
100000 of 100000 tuples (100%) done (elapsed 0.12 s, remaining 0.00 s)
vacuum...
set primary keys...
done.
postgres@debianpgsql1:~$ pgbench pgbench
starting vacuum...end.
transaction type: <builtin: TPC-B (sort of)>
scaling factor: 1
query mode: simple
number of clients: 1
number of threads: 1
number of transactions per client: 10
number of transactions actually processed: 10/10
latency average = 2.038 ms
tps = 490.748098 (including connections establishing)
tps = 642.100047 (excluding connections establishing)
postgres@debianpgsql1:~$

You should always consult pgbench after any important change that you wish to assess and compare the results.

System Deployment, Automation and Monitoring

Once you go live it is very important to have your main system components documented and reproducible, to have automated procedures for creating services and recurring tasks and also have the tools to perform continuous monitoring.

Tip 3

One handy way to start using PostgreSQL with all its advanced enterprise features is ClusterControl by Severalnines. One can have an enterprise-class PostgreSQL cluster, just by hitting a few clicks. ClusterControl provides all those aforementioned services and many more. Setting up ClusterControl is fairly easy, just follow the instructions on the official documentation. Once you have prepared your systems (typically one for running CC and one for PostgreSQL for a basic setup) and done the SSH setup, then you must enter the basic parameters (IPs, Port nos, etc), and if all goes well you should see an output like the following:

And in the main clusters screen:

You can login to your master server and start creating your schema! Of course you can use as a basis the cluster you just created to further build up your infrastructure (topology). A generally good idea is to have a stable server file system layout and a final configuration on your PostgreSQL server and user/app databases before you start creating clones and standbys (slaves) based on your just created brand new server.

PostgreSQL layout, parameters and settings

At cluster initialization phase the most important decision is whether to use data checksums on data pages or not. If you want maximum data safety for your valued (future) data, then this is the time to do it. If there is a chance that you may want this feature in the future and you neglect to do it at this stage, you won’t be able to change it later (without pg_dump/pg_restore that is). This is the next tip:

Tip 4

In order to enable data checksums run initdb as follows:

$ /usr/lib/postgresql/10/bin/initdb --data-checksums <DATADIR>

Note that this should be done at the time of tip 3 we described above. If you already created the cluster with ClusterControl you’ll have to rerun pg_createcluster by hand, as at the time of this writing there is no way to tell the system or CC to include this option.

Another very important step before you go into production is planning for the server file system layout. Most modern linux distros (at least the debian-based ones) mount everything on / but with PostgreSQL normally you don’t want that. It is beneficial to have your tablespace(s) on separate volume(s), to have one volume dedicated for the WAL files and another one for pg log. But the most important is to move the WAL to its own disk. This brings us to the next tip.

Tip 5

With PostgreSQL 10 on Debian Stretch, you can move your WAL to a new disk with the following commands (supposing the new disk is named /dev/sdb ):

# mkfs.ext4 /dev/sdb
# mount /dev/sdb /pgsql_wal
# mkdir /pgsql_wal/pgsql
# chown postgres:postgres /pgsql_wal/pgsql
# systemctl stop postgresql
# su postgres
$ cd /var/lib/postgresql/10/main/
$ mv pg_wal /pgsql_wal/pgsql/.
$ ln -s /pgsql_wal/pgsql/pg_wal
$ exit
# systemctl start postgresql

It is extremely important to setup correctly the locale and encoding of your databases. Overlook this at the createdb phase and you’ll regret this dearly, as your app/DB moves into the i18n, l10n territories. The next tip shows just how to do that.

Tip 6

You should read the official docs and decide on your COLLATE and CTYPE (createdb --locale=) settings (responsible for sort order and character classification) as well as the charset (createdb --encoding=) setting. Specifying UTF8 as the encoding will enable your database to store multi-language text.

ClusterControl
Single Console for Your Entire Database Infrastructure
Find out what else is new in ClusterControl

PostgreSQL High Availability

Since PostgreSQL 9.0, when streaming replication became a standard feature, it became possible to have one or more readonly hot standbys, thus enabling the possibility to direct the read-only traffic to any of the available slaves. New plans exist for multimaster replication but at the point of this writing (10.3) it is only possible to have one read-write master, at least in the official open source product. For the next tip which deals with exactly this.

Tip 7

We will use our ClusterControl PGSQL_CLUSTER created in Tip 3. First we create a second machine which will act as our readonly slave (hot standby in PostgreSQL terminology). Then we click on Add Replication slave, and select our master and the new slave. After the job finishes you should see this output:

And the cluster now should look like:

Note the green “ticked” icon on the “SLAVES” label next to “MASTER”. You can verify that the streaming replication works, by creating a database object (database, table, etc) or inserting some rows in a table on the master and see the change on the standby.

The presence of the read-only standby enables us to perform load balancing for the clients doing select-only queries between the two servers available, the master and the slave. This takes us to tip 8.

Tip 8

You can enable load balancing between the two servers using HAProxy. With ClusterControl this fairly easy to do. You click to Manage->Load Balancer. After choosing your HAProxy server, ClusterControl will install everything for you: xinetd on all instances you specified and HAProxy on your HAProxy designated server. After the job has completed successfully you should see:

Note the HAPROXY green tick next to the SLAVES. Now you can test that HAProxy works:

postgres@debianpgsql1:~$ psql -h localhost -p 5434
psql (10.3 (Debian 10.3-1.pgdg90+1))
SSL connection (protocol: TLSv1.2, cipher: ECDHE-RSA-AES256-GCM-SHA384, bits: 256, compression: off)
Type "help" for help.
postgres=# select inet_server_addr();
 inet_server_addr
------------------
 192.168.1.61
(1 row)
--
-- HERE STOP PGSQL SERVER AT  192.168.1.61
--
postgres=# select inet_server_addr();
FATAL:  terminating connection due to administrator command
SSL connection has been closed unexpectedly
The connection to the server was lost. Attempting reset: Succeeded.
postgres=# select inet_server_addr();
 inet_server_addr
------------------
 192.168.1.60
(1 row)
postgres=#

Tip 9

Besides configuring for HA and load balancing, it is always beneficial to have some sort of connection pool in front of the PostgreSQL server. Pgpool and Pgbouncer are two projects coming from the PostgreSQL community. Many enterprise application servers provide their own pools as well. Pgbouncer has been very popular due to its simplicity, speed and the “transaction pooling” feature, by which, connection to the server is freed once the transaction ends, making it reusable for subsequent transactions which might come from the same session or a different one. The transaction pooling setting breaks some session pooling features, but in general the conversion to a “transaction pooling”-ready setup is easy and the cons are not so important in the general case. A common setup is to configure the app server’s pool with semi-persistent connections: A rather larger pool of connections per user or per app (which connect to pgbouncer) with long idle timeouts. This way connection time from the app is minimal while pgbouncer will help keep connections to the server as few as possible.

One thing that will most probably be of concern once you go live with PostgreSQL is understanding and fixing slow queries. The monitoring tools we mentioned in the previous blog like pg_stat_statements and also the screens of tools like ClusterControl will help you identify and possibly suggest ideas for fixing slow queries. However once you identify the slow query you’ll need to run EXPLAIN or EXPLAIN ANALYZE in order to see exactly the costs and times involved in the query plan. The next tip is about a very useful tool in order to do that.

Tip 10

You must run your EXPLAIN ANALYZE on your database, and then copy the output and paste it on the depesz’s explain analyze online tool and click submit. Then you will see three tabs: HTML, TEXT and STATS. HTML contains cost, time and number of loops for every node in the plan. The STATS tab shows per node type statistics. You should observe the “% of query” column, so that you know where your query exactly suffers.

As you get more familiar with PostgreSQL you’ll find many more tips on your own!

ClusterControl Tips & Tricks - Using socat on CentOS/RHEL for Streaming Backups

$
0
0

There are several ways to perform remote-to-remote data copy - socat, netcat, rsync, scp, sftp. ClusterControl was using netcat for remote copy purposes, however we have flipped that decision to use socat. This blog post describes the reasons behind it.

A Brief History

ClusterControl introduced support for streaming backup back since v1.2.9 using netcat, replacing the older backup-and-copy method using secure copy (scp). Streaming backup is a much better option because it doesn't consume disk space on the backup node and streaming happens on-the-fly, consuming only the disk space of the remote destination where the backup files are to be stored. Secure copy, on the other hand, requires setting up proper SSH keys and encryption adds performance overhead to the transfer process. This is unnecessary if you already have an isolated network for the database servers (encryption is also possible with socat or ncat).

Netcat is a better way of streaming files over the network due to its lightweight process, simpler implementation and speed if compared to rsync, scp or sftp. By default, ClusterControl uses port 9999 for this purpose, which is configurable via ClusterControl -> Backup page if the Storage Location dropdown is "Store on Controller":

Introduction to netcat/socat

Netcat (also known as nc) is a computer networking utility for reading from and writing to network connections using TCP or UDP. It is quite simple to build a very basic client/server model using nc. On one console, start nc listening on a specific port for a connection. For example:

$ nc -l 1234

Netcat is now listening on port 1234 for a connection. On a second console (or a second machine), connect to the machine and port being listened on:

$ nc 127.0.0.1 1234

There should now be a connection between the ports. Anything typed in the second console will be concatenated to the first, and vice-versa. After the connection has been set up, nc does not really care which side is being used as a server and which side is being used as a client. The connection may be terminated using an EOF ('^D').

There are currently three most popular versions of netcat for RHEL based operating system:

  • netcat (also known as nc) - The original project. Default in CentOS/RHEL 6.
  • nmap-ncat (also known as ncat) - A better version of netcat developed and maintained by the nmap project. It has support for multiple protocols, simultaneous connections and SSL. Default in CentOS/RHEL 7.
  • socat - Also a better version of netcat similar to nmap-ncat. Available in EPEL for CentOS/RHEL.

There are also a rewritten version of GNU's and OpenBSD's version which support additional features. For example, OpenBSD's netcat supports TLS.

Netcat Issue on CentOS/RHEL

To create a backup on a database node and store it remotely using netcat, ClusterControl triggers the backup command on the target database node and streams the output by initiating two endpoints on source and destination hosts:

$ nc -dl 9999 # on destination (the storage node)
$ {backup command} | nc 192.168.100.10 9999 # on source (the backup node)

However, the program "nc" in CentOS/RHEL 7 is an alias of nmap-ncat, which is a different version of the original netcat:

$ ls -l /usr/bin/nc
lrwxrwxrwx 1 root root 4 Feb 13  2017 /usr/bin/nc -> ncat

On CentOS/Red Hat 6, "nc" is the original netcat project. Both are practically similar, however the command line options are not compatible between each other. Consider the following command to start the listening host for standard netcat:

$ nc -dl 9999

If the netcat version is the nmap-ncat version, which is the default installed on CentOS/RHEL 7, you would see the following error instead:

Ncat: Invalid -d delay "l" (must be greater than 0). QUITTING.

The -d in nmap-ncat is a delay flag option, which in netcat means detach from stdin. Depending on the options used, this could potentially break the communication between nodes if they are running on different CentOS/RHEL version. One solution is to detect the installed netcat version, whether it's nmap-ncat or netcat and execute the correct listening command. However, ClusterControl prefers to use socat instead, as described in the next section.

Workaround

ClusterControl automatically favors socat if it is installed. Despite not being part of the standard OS package repository, you can have it installed via EPEL repository or manual installation from Socat official page. Socat is also a dependency package for Percona XtraDB Cluster which you can verify by using the following command:

$ yum deplist Percona-XtraDB-Cluster-server-57
...  
dependency: socat
...

Starting from ClusterControl v1.4.2, all database deployments performed by ClusterControl will have socat installed. ClusterControl will start socat to listen on the destination backup host with the following command:

$ socat -u tcp-listen:9999,reuseaddr stdout > {destination path on receiver host}

While on the source host (the host where the backup is performed), the following backup command is executed (depending on the backup options configured via ClusterControl UI):

$ ulimit -n 256000 && LC_ALL=C /usr/bin/innobackupex --defaults-file=/etc/my.cnf --galera-info --parallel 1 --stream=xbstream --no-timestamp . | gzip -6 - | socat - TCP4:192.168.1.100:9999

By using socat, ClusterControl doesn't need to verify what type of netcat version is installed or need to fire different commands for each version. It also allows us to use more advanced options like reuseaddr. This improves the usability of the streaming process across multiple operating system versions.

We hope that will be of help to anyone out there trying to automate their backup streaming process.

Happy clustering!

PS.: To get started with ClusterControl, click here!


Database Automation Behind Sweden’s New Electronic Identity Freja eID

$
0
0

Severalnines is excited to announce its newest customer Verisec AB, an international IT security company on the cutting edge of digital security, creating solutions that make systems secure and easily accessible for industries like banking, government and businesses worldwide.

Verisec is the creator of the Freja eID platform, a scalable and secure authentication and identity management platform. It provides electronic identities on mobile phones, that allows users to log in, sign and approve transactions and agreements with fingerprints or PIN. It also lets users monitor and control their digital activities, which helps avoid ID theft and fraud. The eID is officially approved by the Swedish E-identification board with the quality mark “Svensk e-legitimation”.

In the case study, you can learn how the sensitive nature of an identity service raises the bar on the underlying data management - from regulatory compliance, security, and tight SLAs with resolution of service interruptions or performance problems within narrow time windows. In addition, the case study will show how Verisec’s entire lifecycle could be automated via ClusterControl.

Read the case study to learn more.

ClusterControl
Single Console for Your Entire Database Infrastructure
Find out what else is new in ClusterControl

About ClusterControl

ClusterControl is the all-inclusive open source database management system for users with mixed environments that removes the need for multiple management tools. ClusterControl provides advanced deployment, management, monitoring, and scaling functionality to get your MySQL, MongoDB, and PostgreSQL databases up-and-running using proven methodologies that you can depend on to work. At the core of ClusterControl is it’s automation functionality that let’s you automate many of the database tasks you have to perform regularly, like deploying new databases, detecting anomalies, recovering nodes from failures, adding and scaling new nodes, running backups and upgrades, and more.

About Severalnines

Severalnines provides automation and management software for database clusters. We help companies deploy their databases in any environment, and manage all operational aspects to achieve high-scale availability.

Severalnines' products are used by developers and administrators of all skills levels to provide the full 'deploy, manage, monitor, scale' database cycle, thus freeing them from the complexity and learning curves that are typically associated with highly available database clusters. Severalnines is often called the “anti-startup” as it is entirely self-funded by its founders. The company has enabled over 12,000 deployments to date via its popular product ClusterControl. Currently counting BT, Orange, Cisco, CNRS, Technicolor, AVG, Ping Identity and Paytrail as customers. Severalnines is a private company headquartered in Stockholm, Sweden with offices in Singapore, Japan and the United States.

Top Backup Tools for PostgreSQL

$
0
0

PostgreSQL has the reputation of being rock solid from its beginnings, and over the years has accumulated a set of impressive features. However the peace of mind that your on-disk data is ACID compliant — if not complemented by an equivalent well thought backup strategy — can be easily shattered.

Backup Types

Before diving into the available tools, let’s look at the available PostgreSQL backup types and what their characteristics are:

SQL dumps (or logical)

  • Does not block readers or writers.
  • Geared towards small sets of data because of the negative impact on system load and the long time required for both backup and restore operations. The performance may be increased with the –no-sync flag, but refer to the man page for the risks associated with disabling the wait for writes.
  • A post-restore ANALYZE is required in order to optimize the statistics.
  • Global objects such as roles and tablespaces can only be backed up using pg_dumpall utility. Note that tablespace directories must be manually created prior to starting the restore.
  • Supports parallelism at the expense of increased system load. Read man pg_dump for its caveats and special requirements e.g. synchronized snapshots.
  • Dumps can be loaded in newer versions of PostgreSQL, or even another machine architecture, however they are not guaranteed to be backwards compatible between major versions so some manual editing of the dump file may be required.

Filesystem (or physical)

  • Requires the database to be shut down.
  • Faster than logical backups.
  • Includes cluster data.
  • Can only be restored on the same major version of PostgreSQL.

Continuous archiving (or Point In Time Recovery or PITR)

  • Suitable for very large databases where logical or physical backups would take too long.
  • Some directories inside the data directory can be excluded to speed up the process.

Snapshots

  • Requires operating system support — for example LVM works quite well which is also confirmed by NetBackup for PostgreSQL Agent.
  • Suitable for applications where both data directory and the database must be in sync e.g. LAMP applications, provided that the two snapshots are synchronized.
  • Not recommended when the database files are stored across multiple filesystems (must snapshot all filesystems simultaneously).

Cloud

All cloud providers implement backups in their PostgreSQL offering. Logical backups can be performed as usual, while physical backups and PITR are available through the cloud service offerings since access to the data store is not available (see for example Amazon Aurora for PostgreSQL). Therefore, backing up PostgreSQL in the cloud will need to be a topic for another blog.

Agent base

  • Requires an agent installed on targets.
  • Can do block-level backups e.g. COMMVAULT (installation supported on Windows only).

Features

While PostgreSQL provides out of the box the tools required to perform logical, physical, and PITR backups, specialized backup applications rely on the native PostgreSQL and operating system tools to fill the need of implementing a backup strategy that addresses the following points:

  • automation
  • frequency
  • retention period
  • integrity
  • ease of use

Additionally, PostgreSQL backup tools attempt to provide features common to generic backup tools such as:

  • incremental backups for saving storage space
  • backup catalogs
  • ability to store backups on premise or in the cloud
  • alerting and notification
  • comprehensive reporting
  • access control
  • encryption
  • graphical interface and dashboards
  • backups of remote hosts
  • adaptive throughput in order to minimize load on the targets
  • handling multiple hosts in parallel
  • backup orchestration e.g. jobs chaining
  • REST APIs

Lab Setup

For this exercise I’ve setup a command-and-control host that where I’ll be installing the backup tools, that also runs two PostgreSQL instances — 9.6 and 10 — installed from PGDG repositories:

[root@cc ~]# ps -o user,pid,ppid,args --forest -U postgres
USER       PID  PPID COMMAND
postgres  4535     1 /usr/pgsql-10/bin/postmaster -D /var/lib/pgsql/10/data/
postgres  4538  4535  \_ postgres: logger process
postgres  4540  4535  \_ postgres: checkpointer process
postgres  4541  4535  \_ postgres: writer process
postgres  4542  4535  \_ postgres: wal writer process
postgres  4543  4535  \_ postgres: autovacuum launcher process
postgres  4544  4535  \_ postgres: stats collector process
postgres  4545  4535  \_ postgres: bgworker: logical replication launcher
postgres  4481     1 /usr/pgsql-9.6/bin/postmaster -D /var/lib/pgsql/9.6/data/
postgres  4483  4481  \_ postgres: logger process
postgres  4485  4481  \_ postgres: checkpointer process
postgres  4486  4481  \_ postgres: writer process
postgres  4487  4481  \_ postgres: wal writer process
postgres  4488  4481  \_ postgres: autovacuum launcher process
postgres  4489  4481  \_ postgres: stats collector process

[root@cc ~]# netstat -npeelt | grep :543
tcp   0  0  127.0.0.1:5432  0.0.0.0:*  LISTEN  26  79972  4481/postmaster
tcp   0  0  127.0.0.1:5433  0.0.0.0:*  LISTEN  26  81801  4535/postmaster
tcp6  0  0  ::1:5432        :::*       LISTEN  26  79971  4481/postmaster
tcp6  0  0  ::1:5433        :::*       LISTEN  26  81800  4535/postmaster

I’ve also setup two remote PostgreSQL instances running the same versions 9.6 and respectively 10:

[root@db-1 ~]# ps -o user,pid,ppid,args --forest -U postgres
USER       PID  PPID COMMAND
postgres 10972     1 /usr/pgsql-9.6/bin/postmaster -D /var/lib/pgsql/9.6/data/
postgres 10975 10972  \_ postgres: logger process
postgres 10977 10972  \_ postgres: checkpointer process
postgres 10978 10972  \_ postgres: writer process
postgres 10979 10972  \_ postgres: wal writer process
postgres 10980 10972  \_ postgres: autovacuum launcher process
postgres 10981 10972  \_ postgres: stats collector process

[root@db-1 ~]# netstat -npeelt | grep :5432
tcp   0  0  0.0.0.0:5432  0.0.0.0:*  LISTEN  26  34864  10972/postmaster
tcp6  0  0  :::5432       :::*       LISTEN  26  34865  10972/postmaster


[root@db-2 ~]# ps -o user,pid,ppid,args --forest -U postgres
USER       PID  PPID COMMAND
postgres 10829     1 /usr/pgsql-10/bin/postmaster -D /var/lib/pgsql/10/data/
postgres 10831 10829  \_ postgres: logger process
postgres 10833 10829  \_ postgres: checkpointer process
postgres 10834 10829  \_ postgres: writer process
postgres 10835 10829  \_ postgres: wal writer process
postgres 10836 10829  \_ postgres: autovacuum launcher process
postgres 10837 10829  \_ postgres: stats collector process
postgres 10838 10829  \_ postgres: bgworker: logical replication launcher

[root@db-2 ~]# netstat -npeelt | grep :5432
tcp   0  0  0.0.0.0:5432  0.0.0.0:*  LISTEN  26  34242  10829/postmaster
tcp6  0  0  :::5432       :::*       LISTEN  26  34243  10829/postmaster

Next, use pgbench to create a data set:

pgbench=# \dt+
                          List of relations
 Schema |       Name       | Type  |  Owner   |  Size   | Description
--------+------------------+-------+----------+---------+-------------
 public | pgbench_accounts | table | postgres | 128 MB  |
 public | pgbench_branches | table | postgres | 40 kB   |
 public | pgbench_history  | table | postgres | 0 bytes |
 public | pgbench_tellers  | table | postgres | 40 kB   |
(4 rows)

Tools

A list of common backup tools can be found in the PostgreSQL Wiki — Backup section. I’ve augmented the list with products I’ve come across over the years and from a recent Internet search.

Amanda

Amanda is agent based, open source, and supports PostgreSQL out of the box via the ampgsql API. As of this writing, the version 3.5.1 does not support tablespaces (see man ampgsql).

Zmanda provides an enterprise version which is also open source, however not directly available for download as a trial.

Amanda requires a dedicated backup host as the server and client packages exclude each other:

[root@cc ~]# rpm -qp --conflicts ./amanda-backup_client-3.5.1-1.rhel7.x86_64.rpm
amanda-backup_server
[root@cc ~]# rpm -qp --conflicts ./amanda-backup_server-3.5.1-1.rhel7.x86_64.rpm
amanda-backup_client

Follow the basic configuration guide to setup the server and client then configure the PostgreSQL API.

Here’s a git diff from my lab:

  • Server:

    • increase the server backup space:

      --- a/etc/amanda/omiday/amanda.conf
      				+++ b/etc/amanda/omiday/amanda.conf
      				@@ -13,7 +13,7 @@ amrecover_changer "changer"
      
      				tapetype "TEST-TAPE"
      				define tapetype TEST-TAPE {
      				1.  length 100 mbytes
      				2.  length 500 mbytes
      					filemark 4 kbytes
      				}
      • define the PostgreSQL target (and disable sample backup):

        --- a/etc/amanda/omiday/disklist
        +++ b/etc/amanda/omiday/disklist
        @@ -1,3 +1,2 @@
        -localhost /etc simple-gnutar-local
        +#localhost /etc simple-gnutar-local
        +10.1.9.243 /var/lib/pgsql/9.6/data dt_ampgsql
  • Client:

    • config:

      --- /dev/null
      +++ b/etc/amanda/omiday/amanda-client.conf
      @@ -0,0 +1,5 @@
      +property "PG-DATADIR""/var/lib/pgsql/9.6/data"
      +property "PG-ARCHIVEDIR""/var/lib/pgsql/9.6/archive"
      +property "PG-HOST""/tmp"
      +property "PG-USER""amandabackup"
      +property "PG-PASSFILE""/etc/amanda/pg_passfile"
      • authentication file:

        --- /dev/null
        +++ b/etc/amanda/pg_passfile
        @@ -0,0 +1 @@
        +/tmp:*:*:amandabackup:pass
    • authorize the server:

      --- a/var/lib/amanda/.amandahosts
      +++ b/var/lib/amanda/.amandahosts
      @@ -1,2 +1,3 @@
      localhost amandabackup amdump
      localhost.localdomain amandabackup amdump
      +10.1.9.231 amandabackup amdump
    • PostgreSQL authentication:

      --- a/var/lib/pgsql/9.6/data/pg_hba.conf
      +++ b/var/lib/pgsql/9.6/data/pg_hba.conf
      @@ -79,7 +79,8 @@
      # "local" is for Unix domain socket connections only
      local   all             all                                     trust
      # IPv4 local connections:
      -host    all             all             127.0.0.1/32            ident
      +host    all             all             127.0.0.1/32            trust
      +host    all             amandabackup    10.1.9.243/32           trust
      # IPv6 local connections:
      host    all             all             ::1/128                 ident
      # Allow replication connections from localhost, by a user with the
    • PostgreSQL config:

      --- a/var/lib/pgsql/9.6/data/postgresql.conf
      +++ b/var/lib/pgsql/9.6/data/postgresql.conf
      @@ -178,6 +178,7 @@ dynamic_shared_memory_type = posix  # the default is the first option
      
      #wal_level = minimal                   # minimal, replica, or logical
                                             # (change requires restart)
      +wal_level = replica
      #fsync = on                            # flush data to disk for crash safety
                                                      # (turning this off can cause
                                                      # unrecoverable data corruption)
      @@ -215,10 +216,12 @@ dynamic_shared_memory_type = posix        # the default is the first option
      
      #archive_mode = off            # enables archiving; off, on, or always
                                    # (change requires restart)
      +archive_mode = on
      #archive_command = ''          # command to use to archive a logfile segment
                                    # placeholders: %p = path of file to archive
                                    #               %f = file name only
                                    # e.g. 'test ! -f /mnt/server/archivedir/%f && cp %p /mnt/server/archivedir/%f'
      +archive_command = 'test ! -f /var/lib/pgsql/9.6/archive/%f && cp %p /var/lib/pgsql/9.6/archive/%f'
      #archive_timeout = 0           # force a logfile segment switch after this
                                    # number of seconds; 0 disables

Once completed the above configuration, run the backup:

[amandabackup@cc ~]$ amdump omiday

And verify:

[amandabackup@cc ~]$ amreport omiday
Hostname: cc
Org     : omiday
Config  : omiday
Date    : April 14, 2018

These dumps were to tape MyData01.
The next tape Amanda expects to use is: MyData02.


STATISTICS:
                        Total       Full      Incr.   Level:#
                        --------   --------   --------  --------
Estimate Time (hrs:min)     0:00
Run Time (hrs:min)          0:00
Dump Time (hrs:min)         0:00       0:00       0:00
Output Size (meg)            0.1        0.0        0.1
Original Size (meg)         16.0        0.0       16.0
Avg Compressed Size (%)      0.5        --         0.5
DLEs Dumped                    1          0          1  1:1
Avg Dump Rate (k/s)         33.7        --        33.7

Tape Time (hrs:min)         0:00       0:00       0:00
Tape Size (meg)              0.1        0.0        0.1
Tape Used (%)                0.0        0.0        0.0
DLEs Taped                     1          0          1  1:1
Parts Taped                    1          0          1  1:1
Avg Tp Write Rate (k/s)    830.0        --       830.0


USAGE BY TAPE:
Label                 Time         Size      %  DLEs Parts
MyData01              0:00          83K    0.0     1     1


NOTES:
planner: tapecycle (3) <= runspercycle (3)
planner: Last full dump of 10.1.9.243:/var/lib/pgsql/9.6/data on tape MyData04 overwritten in 3 runs.
taper: tape MyData01 kb 83 fm 1 [OK]


DUMP SUMMARY:
                                                               DUMPER STATS   TAPER STATS
HOSTNAME     DISK                    L ORIG-KB  OUT-KB  COMP%  MMM:SS   KB/s MMM:SS   KB/s
-------------------------------------- ---------------------- -------------- -------------
10.1.9.243   /var/lib/pgsql/9.6/data 1   16416      83    0.5    0:02   33.7   0:00  830.0

(brought to you by Amanda version 3.5.1)

Restoring from backup involves more manual steps as explained in the restore section.

According to the Amanda Enterprise FAQ the following enhancement would apply to our PostgreSQL example:

  • management console for automation of backup, retention policies, and schedules
  • backup to Amazon S3 cloud storage

Barman

Barman is a disaster recovery solution for PostgreSQL maintained by 2ndQuadrant. It is designed to manage backups for multiple databases and has the ability to restore to a previous point in time using the PITR feature of PostgreSQL.

Barman’s features at a glance:

  • handles multiple targets
  • support for different PostgreSQL versions
  • zero data loss
  • streaming and/or standard archiving of WALs
  • local or remote recovery
  • simplified point in time recovery

As noted in the Barman Manual, support for incremental backups, parallel jobs, data deduplication, and network compression is available only when using the rsync option. Also, streaming WALs from a standby using the archive_command isn’t currently supported.

After following the instructions in the manual for setting up the environment we can verify:

-bash-4.2$ barman list-server
db1 - master
db2 - replica

-bash-4.2$ barman check db1
Server db1:
      PostgreSQL: OK
      is_superuser: OK
      PostgreSQL streaming: OK
      wal_level: OK
      replication slot: OK
      directories: OK
      retention policy settings: OK
      backup maximum age: OK (no last_backup_maximum_age provided)
      compression settings: OK
      failed backups: OK (there are 0 failed backups)
      minimum redundancy requirements: OK (have 0 backups, expected at least 0)
      pg_basebackup: OK
      pg_basebackup compatible: OK
      pg_basebackup supports tablespaces mapping: OK
      archive_mode: OK
      archive_command: OK
      continuous archiving: OK
      pg_receivexlog: OK
      pg_receivexlog compatible: OK
      receive-wal running: OK
      archiver errors: OK

-bash-4.2$ barman check db2
Server db2:
      PostgreSQL: OK
      is_superuser: OK
      PostgreSQL streaming: OK
      wal_level: OK
      replication slot: OK
      directories: OK
      retention policy settings: OK
      backup maximum age: OK (no last_backup_maximum_age provided)
      compression settings: OK
      failed backups: OK (there are 0 failed backups)
      minimum redundancy requirements: OK (have 0 backups, expected at least 0)
      pg_basebackup: OK
      pg_basebackup compatible: OK
      pg_basebackup supports tablespaces mapping: OK
      archive_mode: OK
      archive_command: OK
      continuous archiving: OK
      pg_receivexlog: OK
      pg_receivexlog compatible: OK
      receive-wal running: OK
      archiver errors: OK

Everything checks OK, so we can test by backing up the two hosts:

-bash-4.2$ barman backup db1
Starting backup using postgres method for server db1 in /var/lib/barman/db1/base/20180414T091155
Backup start at LSN: 0/240001B0 (000000010000000000000024, 000001B0)
Starting backup copy via pg_basebackup for 20180414T091155
Copy done (time: 2 seconds)
Finalising the backup.
This is the first backup for server db1
WAL segments preceding the current backup have been found:
      000000010000000000000023 from server db1 has been removed
Backup size: 201.9 MiB
Backup end at LSN: 0/26000000 (000000010000000000000025, 00000000)
Backup completed (start time: 2018-04-14 09:11:55.783708, elapsed time: 2 seconds)
Processing xlog segments from file archival for db1
      000000010000000000000023
      000000010000000000000024
      000000010000000000000025.00000028.backup
Processing xlog segments from streaming for db1
      000000010000000000000024

-bash-4.2$ barman backup db2
Starting backup using postgres method for server db2 in /var/lib/barman/db2/base/20180414T091225
Backup start at LSN: 0/B0000D0 (00000001000000000000000B, 000000D0)
Starting backup copy via pg_basebackup for 20180414T091225
Copy done (time: 3 seconds)
Finalising the backup.
This is the first backup for server db2
WAL segments preceding the current backup have been found:
      000000010000000000000009 from server db2 has been removed
      00000001000000000000000A from server db2 has been removed
Backup size: 196.8 MiB
Backup end at LSN: 0/D000000 (00000001000000000000000C, 00000000)
Backup completed (start time: 2018-04-14 09:12:25.619005, elapsed time: 3 seconds)
Processing xlog segments from file archival for db2
      00000001000000000000000B
      00000001000000000000000C.00000028.backup
Processing xlog segments from streaming for db2
      00000001000000000000000B

List the backup catalog:

-bash-4.2$ barman list-backup all
db1 20180414T091155 - Sat Apr 14 09:11:58 2018 - Size: 217.9 MiB - WAL Size: 0 B
db2 20180414T091225 - Sat Apr 14 09:12:28 2018 - Size: 212.8 MiB - WAL Size: 0 B

Displaying the contents for a particular backup:

-bash-4.2$ barman list-files db1 20180414T091155 | head
/var/lib/barman/db1/base/20180414T091155/backup.info
/var/lib/barman/db1/base/20180414T091155/data/backup_label
/var/lib/barman/db1/base/20180414T091155/data/PG_VERSION
/var/lib/barman/db1/base/20180414T091155/data/postgresql.auto.conf
/var/lib/barman/db1/base/20180414T091155/data/pg_ident.conf
/var/lib/barman/db1/base/20180414T091155/data/postgresql.conf
/var/lib/barman/db1/base/20180414T091155/data/pg_hba.conf

When Barman was configured for synchronous WAL streaming we can verify the replication status:

-bash-4.2$ barman replication-status db1
Status of streaming clients for server 'db1':
Current LSN on master: 0/26000528
Number of streaming clients: 1

1. Async WAL streamer
   Application name: barman_receive_wal
   Sync stage      : 3/3 Remote write
   Communication   : TCP/IP
   IP Address      : 10.1.9.231 / Port: 37278 / Host: -
   User name       : streaming_barman
   Current state   : streaming (async)
   Replication slot: barman
   WAL sender PID  : 2046
   Started at      : 2018-04-14 09:04:03.019323+00:00
   Sent LSN   : 0/26000528 (diff: 0 B)
   Write LSN  : 0/26000528 (diff: 0 B)
   Flush LSN  : 0/26000000 (diff: -1.3 KiB)

Further enhancements can be added using the provided hook scripts.

Finally, for command line lovers, Barman comes with full TAB completion.

EDB Backup and Recovery Tool (BART)

EDB BART is a closed source proprietary application provided by EnterpriseDB. It combines the PostgreSQL native Filesystem Level Backup and PITR into an easy to use tool providing the following features:

  • retention policies
  • incremental backups
  • complete, hot, physical backups of multiple Postgres Plus Advanced Server and PostgreSQL database servers
  • backup and recovery management of the database servers on local or remote hosts
  • centralized catalog for backup data
  • store backup data in compressed format
  • checksum verification

While the trial version for the latest version v2.1 is not freely available, the article Data Backup Made Easy and the product documentation guide offer some information for those curious to learn more.

ClusterControl
Single Console for Your Entire Database Infrastructure
Find out what else is new in ClusterControl

pgBackRest

pgBackRest implements a full system backup that doesn’t rely on the common tools tar and rsync. It is currently hosted and made available by CrunchyData under an MIT license. See Recognition for details on its origins.

It offers all the features one would expect from a PostgreSQL centric tool:

  • high backup/restore throughput
  • full, incremental, and differential backups
  • retention policies
  • backup and restore integrity verification through file checksums and integration with PostgreSQL page checksums.
  • ability to resume backups
  • streaming compression and checksums
  • Amazon S3 cloud storage support
  • Encryption

..and much more. Refer to the project page for details.

The installation requires a 64-bit Linux/Unix system and it is outlined in the user guide. The guide also introduces the reader to the main concepts, very useful to those new to PostgreSQL or storage technology.

Although the guide uses command examples for Debian/Ubuntu the pgBackRest is available in the PGDG yum repository, and the installer will pull in all the dependencies:

Installing:

pgbackrest       x86_64  2.01-1.rhel7     pgdg10  36k

Installing       for     dependencies:
perl-DBD-Pg      x86_64  2.19.3-4.el7     base    195k
perl-DBI         x86_64  1.627-4.el7      base    802k
perl-Digest-SHA  x86_64  1:5.85-4.el7     base    58k
perl-JSON-PP     noarch  2.27202-2.el7    base    55k
perl-Net-Daemon  noarch  0.48-5.el7       base    51k
perl-PlRPC       noarch  0.2020-14.el7    base    36k
perl-XML-LibXML  x86_64  1:2.0018-5.el7   base    373k
perl-version     x86_64  3:0.99.07-2.el7  base    84k

Let’s setup two clusters, pg96 and pg10, each having one node:

  • control node (“repository” in the guide):

    [root@cc ~]# cat /etc/pgbackrest.conf
    [global]
    repo1-path=/var/lib/pgbackrest
    repo1-retention-full=2
    start-fast=y
    
    [pg96]
    pg1-path=/var/lib/pgsql/9.6/data
    pg1-host=db1
    pg1-host-user=postgres
    
    [pg10]
    pg1-path=/var/lib/pgsql/10/data
    pg1-host=db2
    pg1-host-user=postgres
  • cluster #1:

    [root@db-1 ~]# cat /etc/pgbackrest.conf
    [global]
    log-level-file=detail
    repo1-host=repository
    
    [pg96]
    pg1-path=/var/lib/pgsql/9.6/data
  • cluster #2:

    [root@db-2 ~]# cat /etc/pgbackrest.conf
    [global]
    log-level-file=detail
    repo1-host=repository
    
    [pg10]
    pg1-path=/var/lib/pgsql/10/data

Next, run backups and display the backup catalog:

-bash-4.2$ pgbackrest --stanza=pg96 info
stanza: pg96
   status: ok

   db (current)
      wal archive min/max (9.6-1): 00000001000000000000003D / 00000001000000000000003D

      full backup: 20180414-120727F
            timestamp start/stop: 2018-04-14 12:07:27 / 2018-04-14 12:08:01
            wal start/stop: 00000001000000000000003D / 00000001000000000000003D
            database size: 185.6MB, backup size: 185.6MB
            repository size: 12.1MB, repository backup size: 12.1MB
-bash-4.2$ pgbackrest --stanza=pg10 info
stanza: pg10
   status: ok

   db (current)
      wal archive min/max (10-1): 000000010000000000000012 / 000000010000000000000012

      full backup: 20180414-120810F
            timestamp start/stop: 2018-04-14 12:08:10 / 2018-04-14 12:08:38
            wal start/stop: 000000010000000000000012 / 000000010000000000000012
            database size: 180.5MB, backup size: 180.5MB
            repository size: 11.6MB, repository backup size: 11.6MB

pgBackRest supports parallelizing of backup and restore — following the example in the guide, we are backing with one CPU and then update the config to use 2 CPUs:

--- a/etc/pgbackrest.conf
+++ b/etc/pgbackrest.conf
@@ -2,6 +2,7 @@
repo1-path=/var/lib/pgbackrest
repo1-retention-full=2
start-fast=y
+process-max=2

[pg96]
pg1-host=db1

The result:

-bash-4.2$ pgbackrest --stanza=pg96 info
stanza: pg96
    status: ok

    db (current)
        wal archive min/max (9.6-1): 00000001000000000000003D / 000000010000000000000041

        full backup: 20180414-120727F
            timestamp start/stop: 2018-04-14 12:07:27 / 2018-04-14 12:08:01
            wal start/stop: 00000001000000000000003D / 00000001000000000000003D
            database size: 185.6MB, backup size: 185.6MB
            repository size: 12.1MB, repository backup size: 12.1MB

        incr backup: 20180414-120727F_20180414-121434I
            timestamp start/stop: 2018-04-14 12:14:34 / 2018-04-14 12:14:52
            wal start/stop: 00000001000000000000003F / 00000001000000000000003F
            database size: 185.6MB, backup size: 8.2KB
            repository size: 12.1MB, repository backup size: 431B
            backup reference list: 20180414-120727F

        incr backup: 20180414-120727F_20180414-121853I
            timestamp start/stop: 2018-04-14 12:18:53 / 2018-04-14 12:19:08
            wal start/stop: 000000010000000000000041 / 000000010000000000000041
            database size: 185.6MB, backup size: 8.2KB
            repository size: 12.1MB, repository backup size: 429B
            backup reference list: 20180414-120727F

With 2 CPUs the backup ran almost 20% faster which can make a big difference when running against a large data set.

Conclusion

PostgreSQL centric backup tools offer, as expected, more options than general purpose tools. Most PostgreSQL backup tools offer the same core functionality, but their implementation introduces limitations that can only be discovered by carefully following the documentation to test drive the product.

In addition, ClusterControl offers an array of backup and restore features that you can use as part of your database management setup.

A Guide to Pgpool for PostgreSQL - Part One

$
0
0

Pgpool is less actual today, than it used to be 10 years ago, when it was the default part of a production PostgreSQL set up. Often when somebody was talking about PostgreSQL cluster, they were referring to postgreSQL behind pgpool and not to the PostgreSQL instance itself (which is the right term). Pgpool is recognised between most influential Postgres players: postgresql community, commandprompt, 2ndquadrant, EDB, citusdata, postgrespro (ordered by age, not influence). I realize the level of recognition in my links is very different - I just want to emphasize the overall impact of pgpool in the postgres world. Some of the most known current postgres “vendors” were found after the pgpool was already famous. So what makes it so famous?

Just the list of most in-demand offered features makes it look great:

  • native replication
  • connection pooling
  • load balancing for read scalability
  • high availability (watchdog with virtual IP, online recovery & failover)

Well, let’s make a sandbox and play. My sample setup is master slave mode. I would assume it is the most popular today, because you typically use streaming replication together with load balancing. Replication mode is barely used these days. Most DBAs skip it in favour to streaming replication and pglogical, and previously to slony.

The replication mode has many interesting settings and surely interesting functionality. But most DBAs have master/multi slave setup by the time they get to pgpool. So they are looking for automatic failover and load balancer, and pgpool offers it out of the box for existing master/multi slave environments. Not to mention that as from Postgres 9.4, streaming replication works with no major bugs and from 10 hash indexes replication is supported, so there are barely anything to stop you from using it. Also streaming replication is asynchronous by default (configurable to synchronous and even not “linear” synchronization complicated setups, while native pgpool replication is synchronous (which means slower data changes) with no choice option. Also additional limitations apply. Pgpool manual itself suggests to prefer when possible streaming replication over pgpool native one). And so this is my choice here.

Ah, but first we need to install it - right?

Installation (of higher version on ubuntu).

First checking the ubuntu version with lsb_release -a. For me repo is:

root@u:~# sudo add-apt-repository 'deb http://apt.postgresql.org/pub/repos/apt/ xenial-pgdg main'
wget --quiet -O - https://www.postgresql.org/media/keys/ACCC4CF8.asc | \
>   sudo apt-key add -
OK
root@u:~# sudo apt-get update

Lastly installation itself:

sudo apt-get install pgpool2=3.7.2-1.pgdg16.04+1

Config:

I user default config from recommended mode:

zcat /usr/share/doc/pgpool2/examples/pgpool.conf.sample-stream.gz > /etc/pgpool2/pgpool.conf

Starting:

If you missed config, you see:

2018-03-22 13:52:53.284 GMT [13866] FATAL:  role "nobody" does not exist

Ah true - my bad, but easily fixable (doable blindly with one liner if you want the same user for all healthchecks and recovery):

root@u:~# sed -i s/'nobody'/'pgpool'/g /etc/pgpool2/pgpool.conf

And before we go any further, let’s create database pgpool and user pgpool in all clusters (In my sandbox they are master, failover and slave, so I need to run it on master only):

t=# create database pgpool;
CREATE DATABASE
t=# create user pgpool;
CREATE ROLE

At last - starting:

postgres@u:~$ /usr/sbin/service pgpool2 start
postgres@u:~$ /usr/sbin/service pgpool2 status
pgpool2.service - pgpool-II
   Loaded: loaded (/lib/systemd/system/pgpool2.service; enabled; vendor preset: enabled)
   Active: active (running) since Mon 2018-04-09 10:25:16 IST; 4h 14min ago
     Docs: man:pgpool(8)
  Process: 19231 ExecReload=/bin/kill -HUP $MAINPID (code=exited, status=0/SUCCESS)
 Main PID: 8770 (pgpool)
    Tasks: 10
   Memory: 5.5M
      CPU: 18.250s
   CGroup: /system.slice/pgpool2.service
           ├─ 7658 pgpool: wait for connection reques
           ├─ 7659 pgpool: wait for connection reques
           ├─ 7660 pgpool: wait for connection reques
           ├─ 8770 /usr/sbin/pgpool -n
           ├─ 8887 pgpool: PCP: wait for connection reques
           ├─ 8889 pgpool: health check process(0
           ├─ 8890 pgpool: health check process(1
           ├─ 8891 pgpool: health check process(2
           ├─19915 pgpool: postgres t ::1(58766) idl
           └─23730 pgpool: worker proces

Great - so we can proceed to the first feature - let’s check load balancing. It has some requirements to be used, supports hints (e.g. to balance in same session), has black-and-white-listed functions, has regular expressions based redirect preference list. It is sophisticated. Alas goingf thoroughly over all that functionality would be out of the scope of this blog, thus we will check the simplest demos:

First, something very simple will show which node is used for select (in my setup, master spins on 5400, slave on 5402 and failover on 5401, while pgpool itself is on 5433, as I have another cluster running and did not want to interfere with it):

vao@u:~$ psql -h localhost -p 5433 t -c "select current_setting('port') from ts limit 1"
 current_setting
-----------------
 5400
(1 row)

Then in loop:

vao@u:~$ (for i in $(seq 1 99); do psql -h localhost -p 5433 t -c "select current_setting('port') from ts limit 1" -XAt; done) | sort| uniq -c
      9 5400
     30 5401
     60 5402

Great. It definitely balances load between nodes, but seems to balance not equally - maybe it’s so smart it knows the weight of each statement? Let’s check the distribution with expected results:

t=# show pool_nodes;
 node_id | hostname  | port | status | lb_weight |  role   | select_cnt | load_balance_node | replication_delay
---------+-----------+------+--------+-----------+---------+------------+-------------------+-------------------
 0       | localhost | 5400 | up     | 0.125000  | primary | 122        | false             | 0
 1       | localhost | 5401 | up     | 0.312500  | standby | 169        | false             | 0
 2       | localhost | 5402 | up     | 0.562500  | standby | 299        | true              | 0
(3 rows)

No - pgpool does not analyze the weight of statements - it was a DBA with her settings again! The settings (see the lb_weight attribute) reconciles with actual query destination targets. You can easily change it (as we did here) by changing the corresponding setting, eg:

root@u:~$ grep weight /etc/pgpool2/pgpool.conf
backend_weight0 =0.2
backend_weight1 = 0.5
backend_weight2 = 0.9
root@u:~# sed -i s/'backend_weight2 = 0.9'/'backend_weight2 = 0.2'/ /etc/pgpool2/pgpool.conf
root@u:~# grep backend_weight2 /etc/pgpool2/pgpool.conf
backend_weight2 = 0.2
root@u:~# pgpool reload
root@u:~$ (for i in $(seq 1 9); do psql -h localhost -p 5433 t -c "select current_setting('port') from ts limit 1" -XAt; done) | sort| uniq -c
      6 5401
      3 5402
ClusterControl
Single Console for Your Entire Database Infrastructure
Find out what else is new in ClusterControl

Great! The next great feature offered is connection pooling. With 3.5 the “thundering herd problem” is solved by serializing accept() calls, greatly speeding up “client connection” time. And yet this feature is pretty straightforward. It does not offer several levels of pooling or several pools configured for the same database (pgpool lets you to choose where to run selects with database_redirect_preference_list of load balancing though), or other flexible features offered by pgBouncer.

So short demo:

t=# select pid,usename,backend_type, state, left(query,33) from pg_stat_activity where usename='vao' and pid <> pg_backend_pid();
 pid  | usename |  backend_type  | state |     left
------+---------+----------------+-------+--------------
 8911 | vao     | client backend | idle  |  DISCARD ALL
 8901 | vao     | client backend | idle  |  DISCARD ALL
 7828 | vao     | client backend | idle  |  DISCARD ALL
 8966 | vao     | client backend | idle  |  DISCARD ALL
(4 rows)
Hm - did I set up this little number of children?
t=# pgpool show num_init_children;
 num_init_children
-------------------
 4
(1 row)

Ah, true, I changed them lower than default 32, so the output would not take several pages. Well then, let’s try exceeding the number of sessions (below I open postgres sessions async in loop, so the 6 sessions would be requested at more or less the same time):

vao@u:~$ for i in $(seq 1 6); do (psql -h localhost -p 5433 t -U vao -c "select pg_backend_pid(), pg_sleep(1), current_setting('port'), clock_timestamp()"&);  done
vao@u:~$  pg_backend_pid | pg_sleep | current_setting |        clock_timestamp
----------------+----------+-----------------+-------------------------------
           8904 |          | 5402            | 2018-04-10 12:46:55.626206+01
(1 row)

 pg_backend_pid | pg_sleep | current_setting |        clock_timestamp
----------------+----------+-----------------+-------------------------------
           9391 |          | 5401            | 2018-04-10 12:46:55.630175+01
(1 row)

 pg_backend_pid | pg_sleep | current_setting |       clock_timestamp
----------------+----------+-----------------+------------------------------
           8911 |          | 5400            | 2018-04-10 12:46:55.64933+01
(1 row)

 pg_backend_pid | pg_sleep | current_setting |        clock_timestamp
----------------+----------+-----------------+-------------------------------
           8904 |          | 5402            | 2018-04-10 12:46:56.629555+01
(1 row)

 pg_backend_pid | pg_sleep | current_setting |        clock_timestamp
----------------+----------+-----------------+-------------------------------
           9392 |          | 5402            | 2018-04-10 12:46:56.633092+01
(1 row)

 pg_backend_pid | pg_sleep | current_setting |       clock_timestamp
----------------+----------+-----------------+------------------------------
           8910 |          | 5402            | 2018-04-10 12:46:56.65543+01
(1 row)

It lets sessions to come by three - expected, as one is taken by the above session (selecting from pg_stat_activity) so 4-1=3. As soon as pg_sleep finishes its one second nap and session is closed by postgres, the next one is let in. So after the first three ends, the next three step in. What happens to the rest? They are queued until the next connection slot frees up. Then the process described next to serialize_accept happens and client gets connected.

Huh? Just session pooling in session mode? Is it all?.. No, here the caching steps in! Look.:

postgres=# /*NO LOAD BALANCE*/ select 1;
 ?column?
----------
        1
(1 row)

Checking the pg_stat_activity:

postgres=# select pid, datname, state, left(query,33),state_change::time(0), now()::time(0) from pg_stat_activity where usename='vao' and query not like '%DISCARD%';
  pid  | datname  | state |               left                | state_change |   now
-------+----------+-------+-----------------------------------+--------------+----------
 15506 | postgres | idle  | /*NO LOAD BALANCE*/ select 1, now | 13:35:44     | 13:37:19
(1 row)

Then run the first statement again and observe state_change not changing, which means you don’t even get to the database to get a known result! Of course if you put some mutable function, results won’t be cached. Experiment with:

postgres=# /*NO LOAD BALANCE*/ select 1, now();
 ?column? |             now
----------+------------------------------
        1 | 2018-04-10 13:35:44.41823+01
(1 row)

You will find that state_change changes as does the result.

Last point here - why /*NO LOAD BALANCE*/ ?.. to be sure we check pg_stat_activity on master and run query on master as well. Same you can use /*NO QUERY CACHE*/ hint to avoid getting a cached result.

Already much for a short review? But we did not even touch the HA part! And many users look towards pgpool specifically for this feature. Well, this is not the end of the story, this is the end of part one. Part two is coming, where we will briefly cover HA and some other tips on using pgpool...

The Best ETL Tools for Migrating to PostgreSQL

$
0
0

What is ETL?

ETL refers to Extract, Transform and Load, it is a 3 step process applied to extract the data from various sources (which can exist in various forms), cleanse, and load in to a target database for analytics. ETL is a popular process in the data warehousing world where-in data from various data sources are integrated and loaded into a target database for performing analytics and reporting for business. In simple core terms, ETL is used to extract the data from a data source like a database or a file and then cleansed, transformed according to the business requirements and then loaded into the target database.

The ETL process exists in the form of various tools. There a quite a few popular ETL tools out there which are widely used by businesses to address different data migration requirements. Though these tools exist, there is no guarantee that the data migration requirements will be fulfilled straight away, which is why DBAs and Developers often opt to build custom ETLs to get through real-time complex data migration challenges.

Why ETL?

Whenever there is a requirement for data migration, the first thing that DBAs or Developers look for is an ETL tool. Data can exist in different forms; in RDBMS Database, flat files, CSVs etc., and the requirement would be to migrate, integrate all of this data into a single database or if the target database is different, data transformation process would become critical. These challenges can be addressed by ETL tools which can save costs and business time. In today’s world the lack of ETL specific tools can cost organizations significant development effort and money to build an efficient automated process for data migration. Thanks to the open source world, there are some popular open source ETL tools which can address complex real-time data migration challenges.

Whilst there are various reasons to migrate the data, I would like to focus on two typical requirements for data migration...

  • Migrate the data from different sources (Database, flat files and CSVs) to one single database in a data warehousing environment presumably an open source database which would significantly reduce the TCO for building the DWH environments. This would be a viable option as the real-time applications will be using the existing commercial databases and the DWH will be hosting the data on an open-source database
  • Migrate off the real-time databases and applications from commercial databases to open source databases like PostgreSQL for much lower cost of data operations for businesses.

My focus in this blog would be to identify ETL tools which can help perform data migrations to PostgreSQL database.

Why Migrate to PostgreSQL?

PostgreSQL is a feature-rich, enterprise class, open source database which is the first option businesses are opting for their various real-time data operation requirements and has implementations across various mission critical environments. After realizing the potential of this highly reliable and efficient RDBMS database, more and more businesses are opting to migrate their databases and applications to it. Migrating the existing databases to PostgreSQL brings significant reductions in IT costs due to which, “Migrations to PostgreSQL” is quite a common requirement these days and there comes the requirement for data migration which is where a hunt begins for an ETL tool.

As said above, there are quite a number of commercial and open-source ETL tools existing and pretty much all the tools support PostgreSQL.

ClusterControl
Single Console for Your Entire Database Infrastructure
Find out what else is new in ClusterControl

What Are the Top ETL Tools?

Ora2pg

Ora2pg is THE OPTION if you are intending to migrate the data from Oracle database to PostgreSQL. It is a Perl-based open source tool specially developed to migrate schema, data from Oracle databases to PostgreSQL and understands both databases very well and can migrate any size data. Migrating bigger size large objects can be expensive in terms of time and hardware.

Pros: Ora2pg is a very popular tool used for specifically migrating Oracle databases to PostgreSQL. Supports Windows and Linux operating systems and uses textual interface. This tool understands both databases very well and is quite reliable from functionality perspective. When we migrated data in a production environment, the data analysis (or data sanity) exercise resulted in “0” data defects which is quite remarkable. Pretty efficient in migrating data types like Date/Timestamp and Large Objects. Easy to schedule jobs via shell script in the background. Developer’s response for any issues on github is good.

Cons: Ora2pg’s installation procedure, which includes installing Perl modules, Oracle and Postgres clients, might become a complex affair depending on the OS version and even more complex when doing the same on Windows OS. There might be significant performance challenges when migrating big size tables with “Large Objects” in parallel (this means one ora2pg job with multiple threads) which can lead to significant data migration strategy change.

Talend

Talend is a very popular ETL tool used to migrate data from any source (database or file) to any database. This tool supports PostgreSQL database and many businesses use this tool to migrate data to PostgreSQL. There are both commercial and open-source versions of this tool and the open-source one should be helpful for data migrations.

Pros: Talend is a java based ETL tool used for data integrations and supports PostgreSQL. An easy to install tool comes with a GUI with both open-source and commercial versions. Can run on any platform that supports Java. Developers can write custom Java code which can be integrated into Talend. It is no big deal if you have to instruct a developer or a DBA to use this tool to migrate the data to PostgreSQL. Can migrate or integrate data from multiple sources like a database or a file.

Cons: Scheduling jobs might be a challenge. Can mostly be used to migrate tables of reasonable size with not many optimization options around performance improvement. May not be a great option to migrate huge size tables with millions of rows. Might bring in basic operational challenges. Needs Java expertise to handle this tool especially when integrating the custom code. Not easy to gain comfort levels on this tool within a short time. It is not possible to script and schedule the data migration jobs.

SQLINES

Sqlines is another open-source ETL tool which can migrate the data to and from any database. This is another good option to migrate data to PostgreSQL databases from pretty much any commercial or open source database. I am personally impressed by this tool. It is developed using C/C++ and is very simple to use with no complexities around the installation process (just download and untar the installer and you are done!). Since this is an C/C++ based tool, there could be big performance wins when migrating big size databases. I would say this tool is evolving and the subscription costs for the support are very reasonable.

Pros: As mentioned above, I am impressed with the fact that this tool is built based on C/C++ which is a huge plus. Quite easy and simple to install and set-up. Uses textual interface which makes it really easy to schedule jobs via bash scripts. Can handle big size data volumes. Support from the developers is good at a very reasonable cost. Developers are open to take your ideas and implement which makes it an even better option.

Cons: Not many people know about this tool and it is evolving. There are not many configuration options to play around. There is some way to go for this tool to become competitive which is not far away. You might run into basic operational challenges.

Pentaho

Pentaho is another data migration and integration tool which again has commercial and open-source versions which can migrate data from any data source to any database. This is also an option to migrate data to PostgreSQL. This tool supports a wide range of databases and operates on an bigger space with data visualization capabilities as well.

Pros: Pentaho is an Java based tool, it operates in GUI mode and can run on operating systems like Windows, Unix and Linux. Operates on a much bigger space and is very good at data transformation and visualisation purposes. As mentioned above, supports wide range of data stores.

Cons: is not an simple tool which can just extract data and load the same into the target database. Data migration process can be complex and time consuming. Heavily focuses on data transformation, cleansing, integration and visualization. The tool is not a good choice to just migrate data from one database to another database without any data transformations or cleansing exercises. Performance can be a challenge when migrating large data volumes.

Custom-built ETL: It is not an exaggeration to say that custom ETLs is one of the most common ways to accomplish an end-to-end efficient and highly performant ETL process. DBAs, Developers landing into this situation is not a surprise. It would be impossible for a single ETL to understand the data complexity, data shape, environmental challenges. Example: When you are migrating data from multiple different databases in a data centre with complex data models to a PostgreSQL database hosted in another data centre or public cloud. In such situation just hunting for the best ETL can end up in a wild-goose chase. So, going for custom ETL is the way to go if you are to build an environment specific and data specific ETL process.

Pros: A very good alternative for organizations with complex environments and complex data wherein it is just not possible to find an ETL which addresses all your data migration concerns. Can be very beneficial in terms of functionality and performance. Can reduce time and cost when it comes to fixing bugs and defects in the tool. Critical, complex and heavy bound ETL operations can be made highly performant and reliable as the developers have full control over the tool. Flexibility has no boundaries. Is an good option when you are looking at capabilities beyond ETL tools and can address any level of complexity. If you chose technologies like Java or Python to build custom ETL, they blend very well with PostgreSQL.

Cons: Building an custom ETL can be extremely time consuming. Significant design and development efforts are required to address all the data migration requirements and other data challenges. Below are some of the challenges which custom ETLs must keep up with, which might require significant development effort and time for enhancements:

  • Environmental changes
  • Infrastructure and database architectural changes impacting ETL operations
  • Data type changes
  • Data volume growth which significantly impacts data migration performance
  • Schema structure or design changes
  • Any critical code change to the ETL, must be subjected to Development and Testing before going to production, this can take up significant time

In general, ETL developments are not considered as the critical part of the project budget as they are not part of regular business applications or database development process. It is not a surprise if businesses do not chose to build an custom ETL as budget, resource or time challenges crop up.

What is the Best ETL Tool?

Well, there is no straightforward answer. It all depends on your requirements and the environment. Choosing an ETL for migrating data to PostgreSQL depends on various factors, you will need to understand the factors impacting data migration. Below are most of them...

  • Understand your data
  • Complexity of the data
  • Data types
  • Data source
  • Data size
  • How is the source data? in a database? in a flat file? Structured or unstructured? etc.. etc..
  • What steps will your data-migration exercise will involve? Your expectations from the tool.

If you know the above, then, you will almost be in a position to choose an ETL tool. Analysing the above factors would help you evaluate the characteristics and capabilities of each ETL tool. Technical experts performing data migration would generally look at an ETL tool which is efficient, flexible and highly performant.

At the end-of-the-day it is not a surprise if you end up selecting multiple ETL tools or even end up developing a custom tool yourself.

To be honest, it is difficult to recommend just one ETL tool without knowing your data requirements. Instead, I would suggest a tool should have the following characteristics to design an efficient and highly performant data migration process...

  • Must be using textual interface with enough configuration options
  • Must be able to migrate large amounts of data efficiently by effectively utilizing multiple CPUs and the memory
  • It would be good if the tool can be installed across multiple operating systems. Some PostgreSQL specific tools support only Windows which can pose challenges from costs, efficiency and performance perspective
  • Must be able to understand the source data and the target database
  • Must have flexible configuration options with enough control to plug the tool into a bash or python script, customize and schedule multiple jobs in parallel
  • An optimal testing process must be designed to understand the tool’s data migration capabilities

There are GUI tools out there which are easy to setup and migrate the data in one-click. These tools are good for migrating data of reasonable size in non-cloud environment and are highly dependent on infrastructure and hardware capacity. There will be not much options other than increasing the infra capability for faster data migration and options for running multiple jobs are also bleak.

When migrating data to PostgreSQL, I would start looking at Talend or SQLines. If I need to migrate the data from Oracle, then, I would look at Ora2pg.

An Expert’s Guide to Slony Replication for PostgreSQL

$
0
0

What is Slony?

Slony-I (referred to as just ‘Slony’ from here on out) is a third-party replication system for PostgreSQL that dates back to before version 8.0, making it one of the older options for replication available. It operates as a trigger-based replication method that is a ‘master to multiple slaves’ solution.

Slony operates by installing triggers on each table to be replicated, on both master and slaves, and every time the table gets an INSERT, UPDATE, or DELETE, it logs which record gets changed, and what the change is. Outside processes, called the ‘slon daemons’, connect to the databases as any other client and fetch the changes from the master, then replay them on all slave nodes subscribed to the master. In a well performing replication setup, this asynchronous replication can be expected to be anywhere 1 to 20 seconds lagged behind the master.

As of this writing, the latest version of Slony is at version 2.2.6, and supports PostgreSQL 8.3 and above. Support continues to this day with minor updates, however if a future version of PostgreSQL changes fundamental functionality of transactions, functions, triggers, or other core features, the Slony project may decide to discontinue large updates to support such drastic new approaches.

PostgreSQL’s mascot is an elephant known as ‘Slonik’, which is Russian for ‘little elephant’. Since this replication project is about many PostgreSQL databases replicating with each other, the Russian word for elephants (plural) is used: Slony.

Concepts

  • Cluster: An instance of Slony replication.
  • Node: A specific PostgreSQL database as Slony replication node, which operates as either a master or slave for a replication set.
  • Replication Set: A group of tables and / or sequences to be replicated.
  • Subscribers: A subscriber is a node that is subscribed to a replication set, and receives replication events for all tables and sequences within that set from the master node.
  • Slony Daemons: The main workers that execute replication, a Slony daemon is kicked off for every node in the replication set and establishes various connections to the node it manages, as well as the master node.

How it is Used

Slony is installed either by source or through the PGDG (PostgreSQL Global Development Group) repositories which are available for Red Hat and Debian based linux distributions. These binaries should be installed on all hosts that will contain either a master or slave node in the replication system.

After installation, a Slony replication cluster is set up by issuing a few commands using the ‘slonik’ binary. ‘slonik’ is a command with a simple, yet unique syntax of its own to initialize and maintain a slony cluster. It is the main interface for issuing commands to the running Slony cluster that is in charge of replication.

Interfacing with Slony can be done by either writing custom slonik commands, or compiling slony with the --with-perltools flag, which provides the ‘altperl’ scripts that help generate these slonik scripts needed.

Creating a Slony Replication Cluster

A ‘Replication Cluster’ is a collection of databases that are part of replication. When creating a replication cluster, an init script needs to be written that defines the following:

  • The name of the Slony cluster desired
  • The connection information for each node part of replication, each with an immutable node number.
  • Listing all tables and sequences to be replicated as part of a ‘replication set’.

An example script can be found in Slony’s official documentation.

When executed, slonik will connect to all nodes defined and create the Slony schema on each. When the Slony daemons are kicked off, they will then clear out all data in the replicated tables on the slave (if there is any), and copy over all data from the master to the slave(s). From that point on, the daemons will continually replicate changes recorded on the master to all subscribed slaves.

Clever configurations

While Slony is initially a Master-to-Multiple-Slave replication system, and has mainly been used in that way, there are several other features and clever usages that make Slony more useful than a simple replication solution. The highly customizable nature of Slony keeps it relevant for a variety of situations for administrators that can think outside of the box.

Cascading Replication

Slony nodes can be set up to cascade replication down a chain of different nodes. If the master node is known to take an extremely heavy load, each additional slave will increase that load slightly. With cascading replication, a single slave node connected to the master can be configured as a ‘forwarding node’, which will then be responsible to sending replication events to more slaves, keeping the load on the master node to a minimum.

Cascading Replication with Slony

Data processing on a slave node

Unlike PostgreSQL’s built in replication, the slave nodes are not actually ‘read only’, only the tables that are being replicated are locked down as ‘read only’. This means on a slave node, data processing can take place by creating new tables not part of replication to house processed data. Tables part of replication can also have custom indexes created depending on the access patterns that may differ from the slave and the master.

Read only tables on the slaves can still have custom trigger based functions executed on data changes, allowing more customization with the data.

Data Processing on a Slony Slave Node

Minimal downtime Upgrades

Upgrading major versions of PostgreSQL can be extremely time consuming. Depending on data size and table count, an upgrade including the ‘analyze’ process post-upgrade could take several days even. Since Slony can replicate data between PostgreSQL clusters of different versions, it can be used to set up replication between an older version as the master and a newer version as the slave. When the upgrade is to happen, simply perform a ‘switchover’, making the slave the new master, and the old master becomes the slave. When the upgrade is marked a success, decommission the Slony replication cluster and shut down the old database.

Upgrade PostgreSQL with Minimal Downtime using Slony

High Availability with frequent server maintenance

Like the minimal downtime for upgrades, server maintenance can be done easily with no downtime by performing a ‘switchover’ between two or more nodes, allowing a slave to be rebooted with updates / other maintenance. When the slave comes back online, it will re-connect to the replication cluster and catch up on all the replicated data. End users connecting to the database may have long transactions disrupted, but downtime itself would be seconds as the switchover happens, rather than however long it takes to reboot / update the host.

Log Shipping

Though not likely to be popular solution, a Slony slave can be set up as a ‘log shipping’ node, where all data it receives through replication can be written to SQL files, and shipped. This can be used for a variety of reasons, such as writing to an external drive and transporting to a slave database manually, and not over a network, compressed and kept archived for future backups, or even have an external program parse the SQL files and modify the contents.

Multiple database data sharing

Since any number of tables can be replicated at will, Slony replication sets can be set up to share specific tables between databases. While similar access can be achieved through Foreign Data Wrappers (which have improved in recent PostgreSQL releases), it may be a better solution to use Slony depending on the usage. If a large amount of data is needed to be fetched from one host to another, having Slony replicate that data means the needed data will already exist on the requesting node, eliminating long transfer time.

ClusterControl
Single Console for Your Entire Database Infrastructure
Find out what else is new in ClusterControl

Delayed Replication

Usually replication is desired to be as quick as possible, but there can be some scenarios where a delay is desired. The slon daemon for a slave node can be configured with a lag_interval, meaning it won’t receive any replication data until the data is old as specified. This can be useful for quick access to lost data if something goes wrong, for example if a row is deleted, it will exist on the slave for 1 hour for quick retrieval.

Things to Know:

  • Any DDL changes to tables that are part of replication must be executed using the slonik execute command.
  • Any table to be replicated must have either a primary key, or a UNIQUE index without nullable columns.
  • Data that is replicated from the master node is replicated after any data may have been functionally generated. Meaning if data was generated using something like ‘random()’, the resulting number is stored and replicated on the slaves, rather than ‘random()’ being run again on the slave returning a different result.
  • Adding Slony replication will increase server load slightly. While efficiently written, each table will have a trigger that logs each INSERT, UPDATE, and DELETE to a Slony table, expect about 2-10% server load increase, depending on database size and workload.

Tips and Tricks:

  • Slony daemons can run on any host that has access to all other hosts, however the highest performing configuration is to have the daemons run on the nodes they are managing. For example, the master daemon running on the master node, the slave daemon running on the slave node.
  • If setting up a replication cluster with a very large amount of data, the initial copy can take quite a long time, meaning all changes that happen from kickoff till the copy is done could mean even longer to catch up and be in sync. This can be solved by either adding a few tables at a time to replication (very time consuming), or by creating a data directory copy of the master database to the slave, then doing a ‘subscribe set’ with the OMIT COPY option set to true. With this option, Slony will assume that the slave table is 100% identical to the master, and not clear it out and copy data over.
  • The best scenario for this is to create a Hot Standby using the built in tools for PostgreSQL , and during a maintenance window with zero connections modifying data, bring the standby online as a master, validate data matches between the two, initiate the slony replication cluster with OMIT COPY = true, and finally re-enable client connections. This may take time to do the setup for the Hot Standby, but the process won’t cause huge negative impact to clients.

Community and Documentation

The community for Slony can found in the mailing lists, located at http://lists.slony.info/mailman/listinfo/slony1-general, which also includes archives.

Documentation is available on the official website, http://slony.info/documentation/, and provides help with log analysis, and syntax specification for interfacing with slony.

Viewing all 1259 articles
Browse latest View live


<script src="https://jsc.adskeeper.com/r/s/rssing.com.1596347.js" async> </script>