Quantcast
Channel: Severalnines
Viewing all 1263 articles
Browse latest View live

Key Things to Monitor in MongoDB

$
0
0

Enhancing system performance, especially for computer structures, requires a process of getting a good overview of performance. This process is generally called monitoring. Monitoring is an essential part of database management and the detailed performance information of your MongoDB will not only help you to gauge its functional state; but also give a clue on anomalies, which is helpful when doing maintenance. It is essential to identify unusual behaviours and fix them before they escalate into more serious failures.

Some of the types of failures that could arise are...

  • Lag or slowdown
  • Resource inadequacy
  • System hiccup

Monitoring is often centered on analyzing metrics. Some of the key metrics you will want to monitor include...

  • Performance of the database
  • Utilization of resources (CPU usage, available memory and Network usage)
  • Emerging setbacks
  • Saturation and limitation of the resources
  • Throughput operations

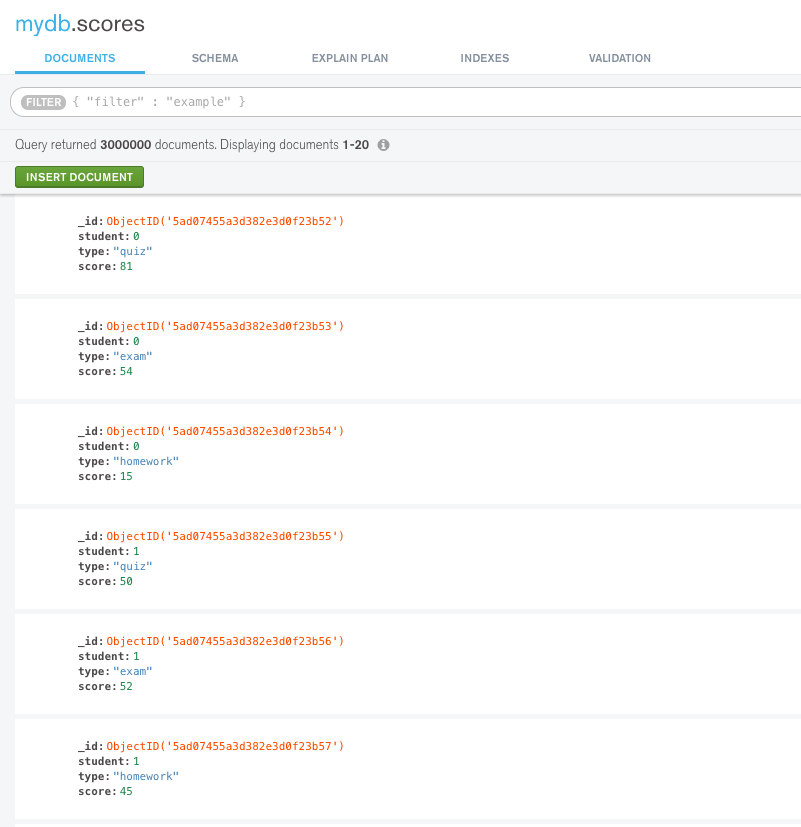
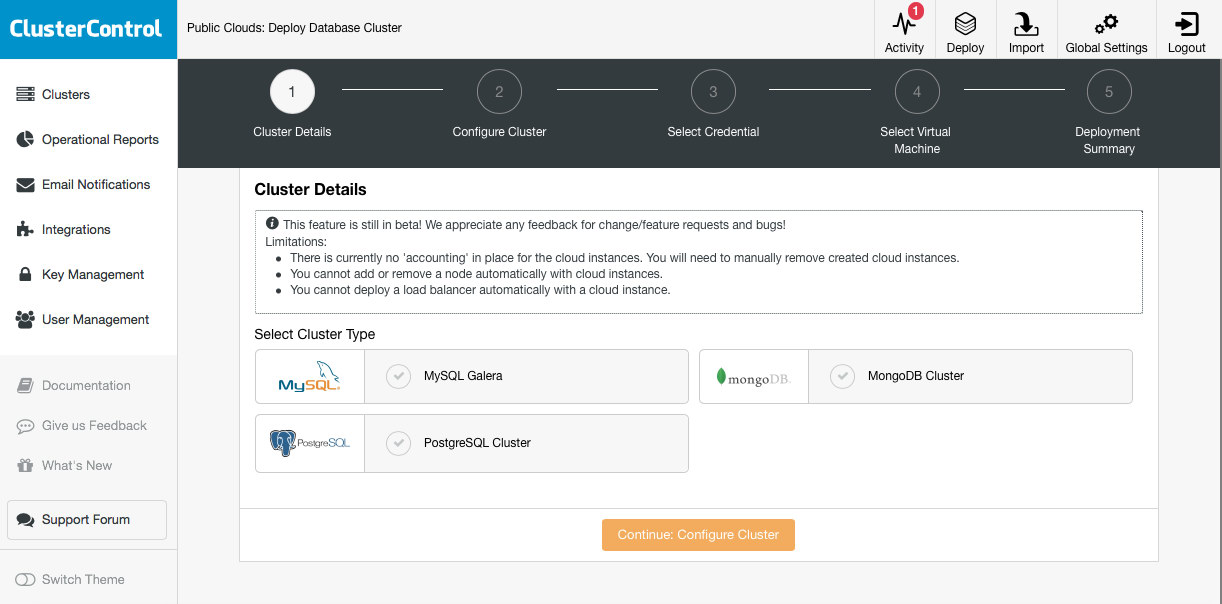
In this blog we are going to discuss, in detail, these metrics and look at available tools from MongoDB (such as utilities and commands.) We will also look at other software tools such as Pandora, FMS Open Source, and Robo 3T. For the sake of simplicity, we are going to use the Robo 3T software in this article to demonstrate the metrics.

Performance of the Database

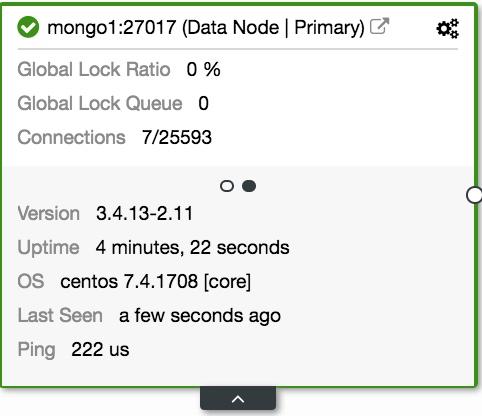
The first and foremost thing to check on a database is its general performance, for example, whether the server is active or not. If you run this command db.serverStatus() on a database in Robo 3T, you will be presented with this information showing the state of your server.
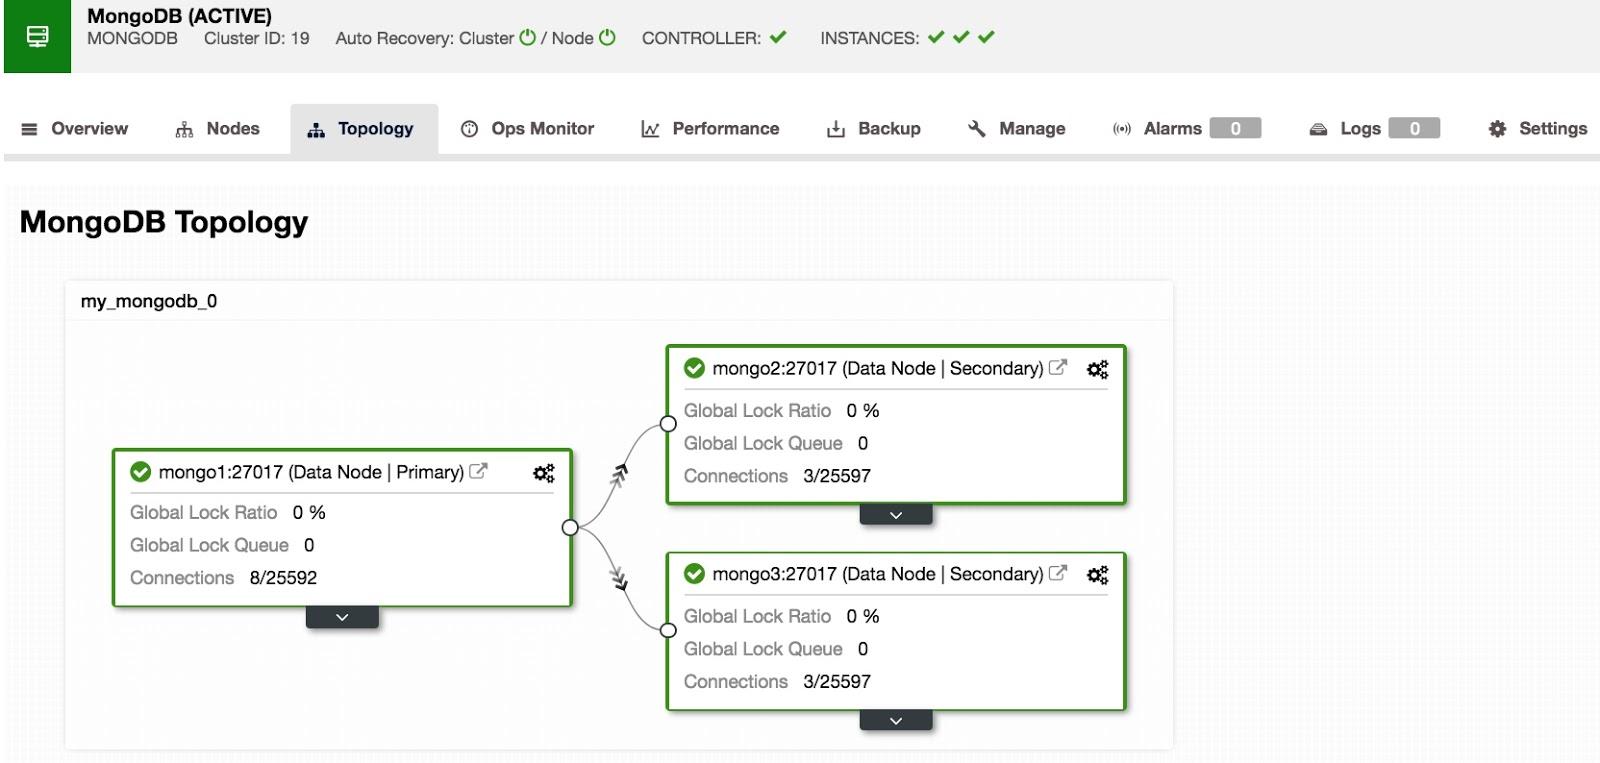
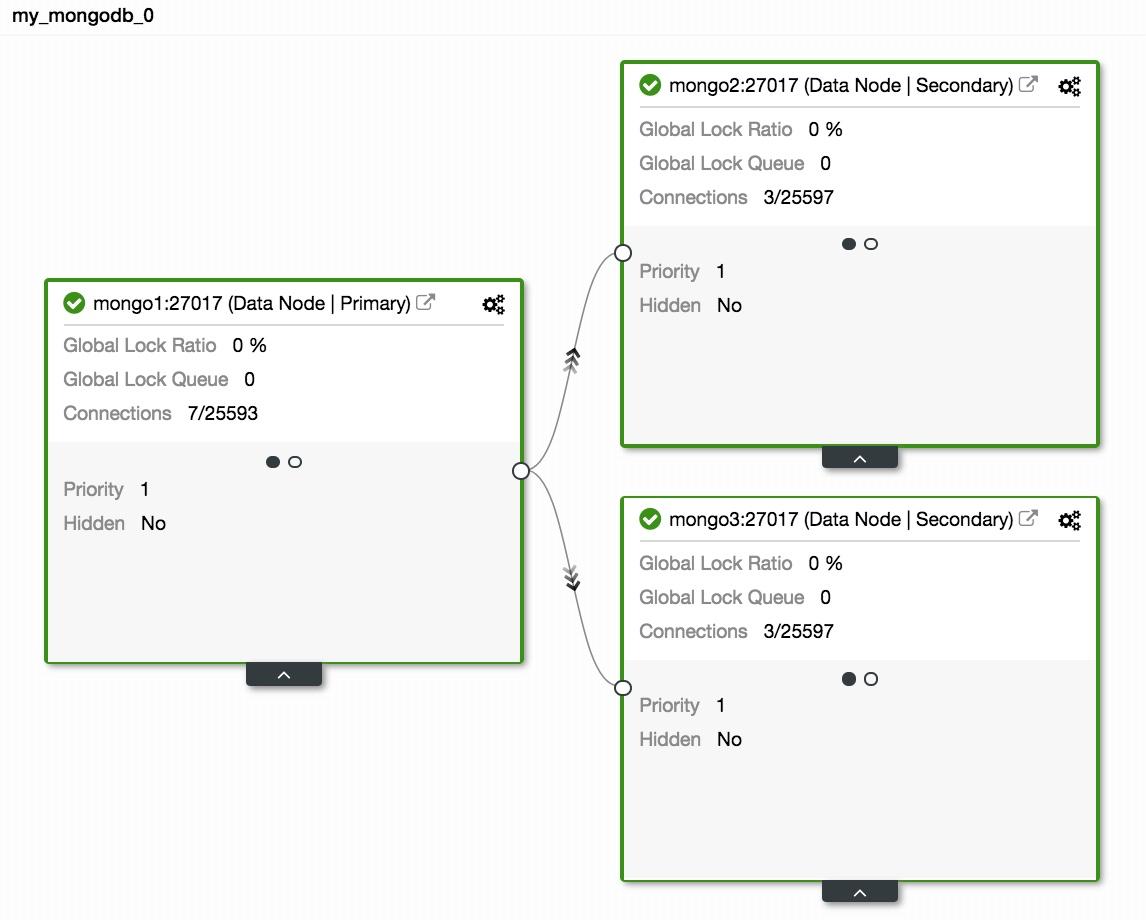
Replica sets

Replica set is a group of mongod processes that maintain the same data set. If you are using replica sets especially in the production mode, operation logs will provide a foundation for the replication process. All the write operations are tracked using nodes, that is a primary node and a secondary node, which store a limited-size collection. On the primary node, the write operations are applied and processed. However, if the primary node fails before they are copied to the operation logs, then the secondary writing is made but in this case the data might not be replicated.

Key metrics to keep an eye on...

Replication Lag

This defines how far the secondary node is behind the primary node. An optimal state requires the gap be as minute as possible. On a normal operating system, this lag is estimated to be 0. If the gap is too wide then data integrity will be compromised once the secondary node is promoted to primary. In this case you can set a threshold, for example 1 minute, and if it is exceeded an alert is set. Common causes of wide replication lag include...

  1. Shards that may have an insufficient write capacity which is often associated with resources saturation.
  2. The secondary node is providing data at a slower rate than the primary node.
  3. Nodes may also be hindered in some way from communicating, possibly due to a poor network.
  4. Operations on the primary node could also be slower, thereby blocking replication. If this happens you can run the following commands:
    1. db.getProfilingLevel(): if you get a value of 0, then your db operations are optimal.
      If the value is 1, then it corresponds to slow operations which can be consequently due to slow queries.
    2. db.getProfilingStatus(): in this case we check the value of slowms, by default it is 100ms. If the value is larger than this, then you might be having heavy write operations on the primary or inadequate resources on the secondary. In order to solve this, you can scale the secondary so it has as much resources as the primary.

Cursors

If you make a read request for example find, you will be provided with a cursor which is a pointer to the data set of the result. If you run this command db.serverStatus() and navigate to the metrics object then cursor, you will see this…

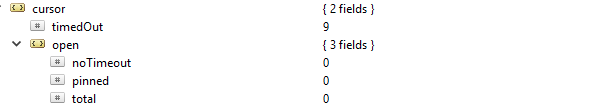
In this case, the cursor.timeOut property was updated incrementally to 9 because there were 9 connections that died without closing the cursor. The consequence is that it will remain open on the server and hence consuming memory, unless it is reaped by the default MongoDB setting. An alert to you should be identifying non-active cursors and reaping them off in order to save on memory. You can also avoid non-timeout cursors because they often hold on to resources, thereby slowing down the internal system performance. This can be achieved by setting the value of the cursor.open.noTimeout property to a value of 0.

Journaling

Considering the WiredTiger Storage Engine, before data is recorded, it is first written to the disk files. This is referred to as journaling. Journaling ensures the availability and durability of data on an event of failure from which a recovery can be carried out.

For the purpose of recovery, we often use checkpoints (especially for the WiredTiger storage system) to recover from the last checkpoint. However, if MongoDB shuts down unexpectedly, then we use the journaling technique to recover any data that was processed or provided after the last checkpoint.

Journaling should not be turned off in the first case, since it only takes like 60 seconds to create a new checkpoint. Hence if a failure occurs, MongoDB can replay the journal to recover data lost within these seconds.

Journaling generally narrows the time interval from when data is applied to memory until it is durable on disk. The storage.journal object has a property that describes the commiting frequency, that is, commitIntervalMs which is often set to a value of 100ms for WiredTiger. Tuning it to a lower value will enhance frequent recording of writes hence reducing instances of data loss.

Locking Performance

This can be caused by multiple read and write requests from many clients. When this happens there is a need to keep consistency and avoid write conflicts. In order to achieve this MongoDB uses multi-granularity-locking which allows locking operations to occur at different levels, such as global, database, or collection level.

If you have poor schema design patterns, then you will be vulnerable to locks being held for long durations. This is often experienced when making two or more different write operations to a single document in the same collection, with a consequence of blocking each other. For the WiredTiger storage engine we can use the ticket system where read or write requests come from something like a queue or thread.

By default the concurrent number of read and write operations are defined by the parameters wiredTigerConcurrentWriteTransactions and wiredTigerConcurrentReadTransactions which are both set to a value of 128.

If you scale this value too high then you will end up being limited by CPU resources. To increase throughput operations, it would be advisable to scale horizontally by providing more shards.

Severalnines
 
Become a MongoDB DBA - Bringing MongoDB to Production
Learn about what you need to know to deploy, monitor, manage and scale MongoDB

Utilization of Resources

This generally describes usage of available resources such as the CPU capacity/ processing rate and RAM. The performance, especially for the CPU can change drastically in accordance to unusual traffic loads. Things to check on include...

  1. Number of connections
  2. Storage
  3. Cache

Number of Connections

If the number of connections is higher than what the database system can handle then there will be a lot of queuing. Consequently, this will overwhelm performance of the database and make your setup run slowly. This number can result in driver issues or even complications with your application.

If you monitor a certain number of connections for some period and then notice that that value has peaked, it is always a good practice to set an alert if the connection exceeds this number.

If the number is getting too high then you can scale up in order to cater to this rise. To do this you have to know the number of connections available within a given period, otherwise, if the available connections are not enough, then requests will not be handled in a timely fashion.

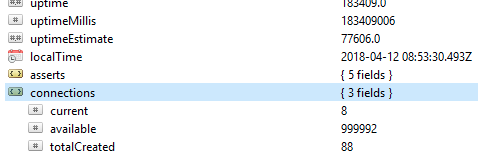
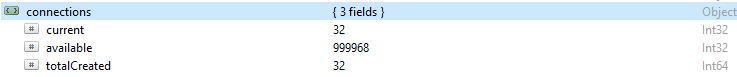
By default MongoDB provides support for up to 1 million connections. With your monitoring, always ensure the current connections never get too close to this value. You can check the value in the connections object.

Storage

Every row and data record in MongoDB is referred to as a document. Document data is in BSON format. On a given database, if you run the command db.stats(), you will be presented with this data.

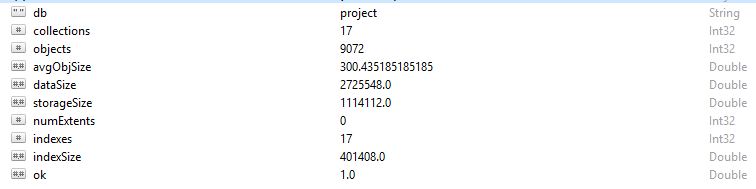
  • StorageSize defines the size of all data extents in the database.
  • IndexSize outlines the size of all indexes created within that database.
  • dataSize is a measure of the total space taken by the documents in the database.

You can sometimes see a change in memory, especially if a lot of data has been deleted. In this case you should set up an alert in order to ensure it was not due to malicious activity.

Sometimes, the overall storage size may shoot up while the database traffic graph is constant and in this case, you should check your application or database structure to avoid having duplicates if not needed.

Like the general memory of a computer, MongoDB also has caches in which active data is temporarily stored. However, an operation may request for data which is not in this active memory, hence making a request from the main disk storage. This request or situation is referred to as page fault. Page fault requests come with a limitation of taking longer time to execute, and can be detrimental when they occur frequently. To avoid this scenario, ensure the size of your RAM is always enough to cater to the data sets you are working with. You should also ensure you have no schema redundancy or unnecessary indices.

Cache

Cache is a temporal data storage item for frequently accessed data. In WiredTiger the file system cache and storage engine cache are often employed. Always ensure that your working set does not bulge beyond the available cache, otherwise, the page faults will increase in number causing some performance issues.

At some point you may decide to modify your frequent operations, but the changes are sometimes not reflected in the cache. This unmodified data is referred to as “Dirty Data.” It exists because it has not yet been flushed to disk. Bottlenecks will result if the amount of “Dirty Data” grows to some average value defined by slow writing to the disk. Adding more shards will help to reduce this number.

CPU Utilization

Improper indexing, poor schema structure and unfriendly designed queries will require more CPU attention hence will obviously increase its utilization.

Throughput operations

To a large extent getting enough information on these operations can enable one to avoid consequential setbacks such as errors, saturation of resources, and functional complications.

You should always take note of the number of read and write operations to the database, that is, a high-level view of the cluster’s activities. Knowing the number of operations generated for the requests will enable you to calculate the load that the database is expected to handle. The load can then be handled either scaling up your database or scaling out; depending on the type of resources you have. This allows you to easily gauge the quotient ratio in which the requests are accumulating to the rate at which they are being processed. Furthermore, you can optimize your queries appropriately in order to improve the performance.

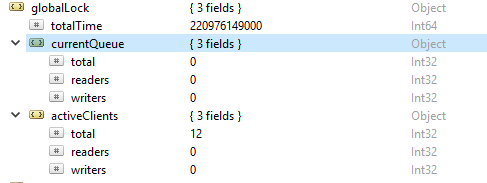
In order to check the number of read and write operations, run this command db.serverStatus(), then navigate to the locks.global object, the value for the property r represents the number of read requests and w number of writes.

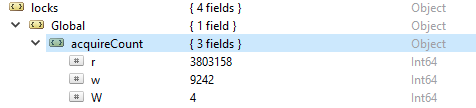
More often the read operations are more than the write operations. Active client metrics are reported under globalLock.

ClusterControl
Single Console for Your Entire Database Infrastructure
Find out what else is new in ClusterControl

Saturation and Limitation of Resources

Sometimes the database may fail to keep in pace with the rate of writing and reading, as portrayed by an increasing number of queued requests. In this case, you have to scale up your database by providing more shards to enable MongoDB to address the requests fast enough.

Emerging Setbacks

MongoDB log files always give a general overview on assert exceptions returned. This result will give you a clue on the possible causes of errors. If you run the command, db.serverStatus(), some of the error alerts you will note include:

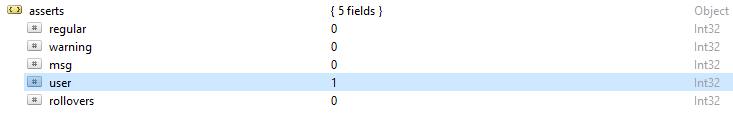
  1. Regular asserts: these are as a result of an operation failure. For example in a schema if a string value is provided to an integer field hence resulting in failure reading the BSON document.
  2. Warning asserts: these are often alerts on some issue but are not having much impact on its operation. For example when you upgrade your MongoDB you might be alerted using deprecated functions.
  3. Msg asserts: they are as a result of internal server exceptions such as slow network or if the server is not active.
  4. User asserts: like regular asserts, these errors arise when executing a command but they are often returned to the client. For example if there are duplicate keys, inadequate disk space or no access to write into the database. You will opt to check your application to fix these errors.

An Overview of Database Indexing for MongoDB

$
0
0

What is Indexing?

Indexing is an important concept in database world. Main advantage of creating index on any field is faster access of data . It optimizes the process of database searching and accessing. Consider this example to understand this.

When any user asks for a specific row from the database, what will DB system do? It will start from the first row and check whether this is the row that the user wants? If yes, then return that row, otherwise continue searching for the row till the end.

Generally, when you define an index on a particular field, the DB system will create a ordered list of that field’s value and store it in a different table. Each entry of this table will point to the corresponding values in the original table. So when the user tries to search for any row, it will first search for the value in the index table using binary search algorithm and return the corresponding value from the original table. This process will take less time because we are using binary search instead of linear search.

In this article, we will focus in MongoDB Indexing and understand how to create and use indexes in MongoDB.

How to Create an Index in MongoDB Collection?

To create index using Mongo shell, you can use this syntax:

db.collection.createIndex( <key and index type specification>, <options> )

Example:

To create index on name field in myColl collection:

db.myColl.createIndex( { name: -1 } )

Types of MongoDB Indexes

  1. Default _id Index

    This is the default index which will be created by MongoDB when you create a new collection. If you don’t specify any value for this field, then _id will be primary key by default for your collection so that a user can’t insert two documents with same _id field values. You can’t remove this index from the _id field.

  2. Single Field Index

    You can use this index type when you want to create a new index on any field other than _id field.

    Example:

    db.myColl.createIndex( { name: 1 } )

    This will create a single key ascending index on name field in myColl collection

  3. Compound Index

    You can also create an index on multiple fields using Compound indexes. For this index, order of the fields in which they are defined in the index matters. Consider this example:

    db.myColl.createIndex({ name: 1, score: -1 })

    This index will first sort the collection by name in ascending order and then for each name value, it will sort by score values in descending order.

  4. Multikey Index

    This index can be used to index array data. If any field in a collection has an array as its value then you can use this index which will create separate index entries for each elements in array. If the indexed field is an array, then MongoDB will automatically create Multikey index on it.

    Consider this example:

    {
    ‘userid’: 1,
    ‘name’: ‘mongo’,
    ‘addr’: [
        {zip: 12345, ...},
    {zip: 34567, ...}
    ]
    }

    You can create a Multikey index on addr field by issuing this command in Mongo shell.

    db.myColl.createIndex({ addr.zip: 1 })
  5. Geospatial Index

    Suppose you have stored some coordinates in MongoDB collection. To create index on this type fields(which has geospatial data), you can use a Geospatial index. MongoDB supports two types of geospatial indexes.

    • 2d Index: You can use this index for data which is stored as points on 2D plane.

      db.collection.createIndex( { <location field> : "2d" } )
    • 2dsphere Index: Use this index when your data is stored as GeoJson format or coordinate pairs(longitude, latitude)

    db.collection.createIndex( { <location field> : "2dsphere" } )
  6. Text Index

    To support queries which includes searching for some text in the collection, you can use Text index.

    Example:

    db.myColl.createIndex( { address: "text" } )
  7. Hashed Index

    MongoDB supports hash-based sharding. Hashed index computes the hash of the values of the indexed field. Hashed index supports sharding using hashed sharded keys. Hashed sharding uses this index as shard key to partition the data across your cluster.

    Example:

    db.myColl.createIndex( { _id: "hashed" } )
ClusterControl
Single Console for Your Entire Database Infrastructure
Find out what else is new in ClusterControl

Properties of Index

  1. Unique Index

    This property ensures that there are no duplicate values in the indexed field. If any duplicates are found while creating the index, then it will discard those entries.

  2. Sparse Index

    This property ensures that all queries search documents with indexed field. If any document doesn’t have an indexed field, then it will be discarded from the result set.

  3. TTL Index

    This index is used to automatically delete documents from a collection after specific time interval(TTL) . This is ideal for removing documents of event logs or user sessions.

Performance Analysis

Consider a collection of student scores. It has exactly 3000000 documents in it. We haven’t created any indexes in this collection. See this image below to understand the schema.

Sample documents in score collection

Now, consider this query without any indexes:

db.scores.find({ student: 585534 }).explain("executionStats")

This query takes 1155ms to execute. Here is the output. Search for executionTimeMillis field for the result.

Execution time without indexing

Now let’s create index on student field. To create the index run this query.

db.scores.createIndex({ student: 1 })

Now the same query takes 0ms.

Execution time with indexing

You can clearly see the difference in execution time. It’s almost instantaneous. That’s the power of indexing.

Conclusion

One obvious takeaway is: Create indexes. Based on your queries, you can define different types of indexes on your collections. If you don’t create indexes, then each query will scan the full collections which takes a lot of time making your application very slow and it uses lots of resources of your server. On the other hand, don’t create too many indexes either because creating unnecessary indexes will cause extra time overhead for all insert, delete and update. When you perform any of these operations on an indexed field, then you have to perform the same operation on index tree as well which takes time. Indexes are stored in RAM so creating irrelevant indexes can eat up your RAM space, and slow down your server.

Announcing ClusterControl 1.6 - automation and management of open source databases in the cloud

$
0
0

Today we are excited to announce the 1.6 release of ClusterControl - the all-inclusive database management system that lets you easily deploy, monitor, manage and scale highly available open source databases - and load balancers - in any environment: on-premise or in the cloud.

ClusterControl 1.6 introduces a new set of cloud features in BETA status that allow users to deploy and manage their open source database clusters on public clouds such AWS, Google Cloud and Azure. The release also provides a Point In Time Recovery functionality for MySQL/MariaDB systems, as well as new topology views for PostgreSQL Replication clusters, MongoDB ReplicaSets and Sharded clusters.

Release Highlights

Deploy and manage clusters on public Clouds (BETA)

  • Supported cloud providers: Amazon Web Services (VPC), Google Cloud, and Azure
  • Supported databases: MySQL/MariaDB Galera, Percona XtraDB Cluster, PostgreSQL, MongoDB ReplicaSet

Point In Time Recovery - PITR (MySQL)

  • Position and time-based recovery for MySQL based clusters

Enhanced Topology View

  • Support added for PostgreSQL Replication clusters; MongoDB ReplicaSets and Sharded clusters

Additional Highlights

  • Deploy multiple clusters in parallel and increase deployment speed
  • Enhanced Database User Management for MySQL/MariaDB based systems
  • Support for MongoDB 3.6
ClusterControl
Single Console for Your Entire Database Infrastructure
Find out what else is new in ClusterControl

View Release Details and Resources

Release Details

Deploy and manage open source database clusters on public Clouds (BETA)

With this latest release, we continue to add deeper cloud functionality to ClusterControl. Users can now launch cloud instances and deploy database clusters on AWS, Google Cloud and Azure right from their ClusterControl console; and they can now also upload/download backups to Azure cloud storage. Supported cloud providers currently include Amazon Web Services (VPC), Google Cloud, and Azure as well as the following databases: MySQL/MariaDB Galera, PostgreSQL, MongoDB ReplicaSet.

Point In Time Recovery - PITR (MySQL)

Point-in-Time recovery of MySQL & MariaDB involves restoring the database from backups prior to the target time, then uses incremental backups and binary logs to roll the database forward to the target time. Typically, database administrators use backups to recover from different types of cases such as a database upgrade that fails and corrupts the data or storage media failure/corruption. But what happens when an incident occurs at a time in between two backups? This is where binary logs come in: as they store all of the changes, users can also use them to replay traffic. ClusterControl automates that process for you and helps you minimize data loss after an outage.

New Topology View

The ClusterControl Topology View provides a visual representation of your database nodes and load balancers in real time, in a simple and friendly interface without the need to install any additional tools. Distributed databases or clusters typically consist of multiple nodes and node types, and it can be a challenge to understand how these work together. If you also have load balancers in the mix, hosts with multiple IP addresses and more, then the setup can quickly become too complex to visualise. That’s where the new ClusterControl Topology View comes in: it shows all the different nodes that form part of your database cluster (whether database nodes, load balancers or arbitrators), as well as the connections between them in an easy to view visual. With this release, we have added support for PostgreSQL Replication clusters as well as MongoDB ReplicaSets and Sharded clusters.

Enhanced Database User Management for MySQL based clusters

One important aspect of being a database administrator is to protect access to the company’s data. We have redesigned our DB User Management for MySQL based clusters with a more modern user interface, which makes it easier to view and manage the database accounts and privileges directly from ClusterControl.

Additional New Functionalities

  • Improved cluster deployment speed by utilizing parallel jobs. Deploy multiple clusters in parallel.
  • Support to deploy and manage MongoDB cluster on v3.6

Download ClusterControl today!

Happy Clustering!

Visualizing your Cluster Topology in ClusterControl

$
0
0

Distributed databases or clusters typically consist of multiple nodes and note types, and it is not always easy to understand how all these hang together. For instance, one could have a replication setup with intermediate masters, and replication traffic following a certain path. Throw in some load balancers, hosts with multiple IP addresses, read only flags and slave lag, and you’re in for a brain teaser.

However, a picture is worth a thousand words. That’s exactly what ClusterControl’s new Topology View delivers. It shows all the different nodes that form part of your database cluster (whether database nodes, load balancers or arbitrators), as well as the connections between them. The nodes, connections, and their statuses are discovered by ClusterControl. Since ClusterControl is continuously monitoring the nodes and keeps state information, any changes in the topology are reflected in the web interface. If a node has failed, it will be shown as offline.

From the topology view, you can manage the nodes, change masters by dragging and dropping the object on the desired master, restart nodes and synchronize data. You can also detect problems very easily, as each object presents a quick summary of its status. ClusterControl performs some extra controls for the actions you want to perform. The predefined checks do not allow executing tasks that can cause data loss.

There are different types topologies, we will show some of them and see how they work.

Galera Cluster

Galera Cluster Topology View

Here we have a basic Galera Cluster topology with 3 nodes.

In this screen we can see the 3 nodes working correctly and basic information such as the state and the last commit.

We can also observe that galera1 is listed as master, since it is generating binlogs.

If we expand one of the nodes, we can view additional status information.

Node Details View 1
Node Details View 1

In the first we see information related to Galera traffic.

Node Details View 2
Node Details View 2

In the second subscreen, we can see details about regular MySQL replication.

Node Details View 3
Node Details View 3

In the third, we have details about the server, such as uptime and version.

We also have actions that we can perform on the nodes.

Node Actions View
Node Actions View

If we click on the right icon, we can see the available actions:

  • SSH Console: It allows us to access an ssh console on the node.
  • Schedule Maintenance Mode: Allows you to set a maintenance window for the node.
  • Reboot Host: We can restart the host from here.
  • Restart Node: We can restart the database.
  • Resync Node: Allows us to perform a resync of the node.
  • Bootstrap Cluster: By selecting this option, we can perform a bootstrap of the cluster by selecting the corresponding node.
  • Stop Node: We can stop the database.
  • Unregister Node: With this action, we remove the node from the cluster.
ClusterControl
Single Console for Your Entire Database Infrastructure
Find out what else is new in ClusterControl

MySQL Replication

MySQL Replication Topology View

In this screen we can see a MySQL Replication topology with 1 master and 3 slaves.

We have some information such as the state of the replicas and the master, which nodes are writeable, and the position of the replication.

If we expand each node, we can obtain more detailed information.

Master Node Details View 1
Slave Node Details View 1

In the first sub screen, we can see details of the replication. Both the master and the slave.

Node Details View 2
Node Details View 2

In the second sub screen, we see server details, such as version and uptime.

We have different actions that we can perform on the nodes.

Node Actions View
Node Actions View

If we click on the right icon, we can see the available actions:

  • SSH Console: It allows us to access an ssh console inside the node.
  • Schedule Maintenance Mode: Allows you to set a maintenance window for the node.
  • Reboot Host: We can restart the host from here.
  • Restart Node: We can restart the database.
  • Disable Readonly: With this option we enable writing on the replica.
  • Promote Slave: Allows to promote a slave to master.
  • Rebuild Replication Slave: Selecting this option we rebuild the replica by selecting a master.
  • Change Replication Master: Allows you to change the master of the replication.
  • Start Slave: Start the instance.
  • Stop Node: We can stop the instance.
  • Unregister Node: With this action we remove the node from the cluster.

The options may vary depending on the role of the node.

Change Node View
Change Node View

You can also, by selecting a node and dragging it to another node, select one of the following options:

Node Options View
Node Options View

You can rebuild the replica from that new node, or simply change the master and continue replicating.

When confirming the changes, we will have a new topology view:

MySQL Replication Topology View 2

Here we can see that we have our master, with two replicas, and one of those replicas functions as an intermediate master, with a slave replicating from it.

PostgreSQL

PostgreSQL Topology View 1

Here we have a topology for PostgreSQL, with 1 master and 2 slaves.

We can observe the role of each one, which nodes allow writing and the state of replication.

Node Details View 1
Node Details View 1

If we expand the information of the nodes, we can see version and uptime details .

Node Actions View
Node Actions View

We also have different actions that can be performed on the nodes:

  • SSH Console: It allows us to access an ssh console inside the node.
  • Schedule Maintenance Mode: Allows you to set a maintenance window for the node.
  • Reboot Host: We can restart the host from here.
  • Restart Node: We can restart the database.
  • Promote Slave: Allows us to promote a slave master.
  • Rebuild Replication Slave: This option allows reconstructing a replica from a master.
  • Stop Node: We can stop the database.
  • Unregister Node: With this action we remove the node from the cluster.

The options may change depending on the role of each node.

If we want to modify our master, we can do it simply by selecting Promote Slave in the actions of the node that we saw earlier.

After a few seconds, we can see our new topology, with the new master we selected.

PostgreSQL Topology View 2

To rebuild a replica, we can simply select the node we want to modify and drop it on the master.

Change Node View
Change Node View

In this way, you can reconstruct a replica fast and easy.

MongoDB

MongoDB Topology View

This is the topology for a MongoDB ReplicaSet with 1 primary node and 2 secondary nodes.

We can observe basic information such as connections and locks.

By expanding the node information, we can see two sub screens.

Node Details View 1
Node Details View 1

In the first, we see the priority and whether it is hidden or not.

Node Details View 2
Node Details View 2

In the second we can see server data, such as the version and the uptime.

Node Actions View
Node Actions View

We have different actions to perform on each nodes:

  • SSH Console: It allows us to access an ssh console inside the node.
  • Schedule Maintenance Mode: Allows you to set a maintenance window for the node.
  • Reboot Host: We can restart the host from here.
  • Restart Node: We can restart the database.
  • Freeze Node: We can put the node in freeze mode for X time.
  • Stop Node: We can stop the database.
  • Unregister Node: With this action we remove the node from the cluster.

The options may change depending on the role of each node.

General

Regardless of the engine that we use, if we lose access to any node, we can easily see it, and configure alerts about the events. Let's see an example with Galera Cluster:

Node Offline View
Node Offline View

In this way, we can quickly identify the inaccessible node and take the necessary actions.

We can also have in our topology, load balancers with keepalived configured:

Load Balancers View
Load Balancers View

We can view database nodes and the load balancers (E.g. ProxySQL).

To conclude, the Topology View can be quite useful to quickly visualize how our cluster is replicating.

You can try this and many other features with the free trial version.

How to Measure Database Availability?

$
0
0
Wednesday, April 25, 2018 - 12:00

Database availability is notoriously hard to measure and report on, although it is an important KPI in any SLA between you and your customer. We often define availability in terms of 9’s (e.g. 99.9% or 99.999%), although there is often a lack of understanding of what these numbers might mean, or how we can measure them.

Is the database available if an instance is up and running, but it is unable to serve any requests? Or if response times are excessively long, so that users consider the service unusable? Is the impact of one longer outage the same as multiple shorter outages? How do partial outages affect database availability, where some users are unable to use the service while others are completely unaffected?  

Not agreeing on precise definitions with your customer might lead to dissatisfaction. The database team might be reporting that they have met their availability goals, while the customer is dissatisfied with the service. In this webinar, we will discuss the different factors that affect database availability. We will then see how you can measure your database availability in a realistic way.

How to do Point-in-Time Recovery of MySQL & MariaDB Data using ClusterControl

$
0
0

Backups are crucial when it comes to safety of data. They are the ultimate disaster recovery solution - you have no database nodes reachable and your datacenter could literally have gone up in smoke, but as long as you have a backup of your data, you can still recover from such situation.

Typically, you will use backups to recover from different types of cases:

  • accidental DROP TABLE or DELETE without a WHERE clause, or with a WHERE clause that was not specific enough.
  • a database upgrade that fails and corrupts the data
  • storage media failure/corruption

Is restoring from backup not enough? What does it have to be point-in-time? We have to keep in mind that a backup is a snapshot of data taken at a given point in time. If you take a backup at 1:00 am and a table was removed accidently at 11:00 am, you can restore your data up to 1:00 am but what about changes which happened between 1:00 am and 11:00 am? Those changes would be lost unless you can replay modifications that happened in between. Luckily, MySQL has such a mechanism for storing changes - binary logs. You may know those logs are used for replication - MySQL uses them to store all of the changes which happened on the master, and a slave uses them to replay those changes and apply them to its dataset. As the binlogs store all of the changes, you can also use them to replay traffic. In this blog post, we will take a look at how ClusterControl can help you perform Point-In-Time Recovery (PITR).

Creating backup compatible with Point-In-Time Recovery

First of all, let’s talk about prerequisites. A host where you take backups from has to have binary logs enabled. Without them, PITR is not possible. Second requirement - a host where you take backups from should have all the binary logs required in order to restore to a given point in time. If you use too aggressive binary log rotation, this could become a problem.

So, let us see how to use this feature in ClusterControl. First of all, you have to take a backup which is compatible with PITR. Such backup has to be full, complete and consistent. For xtrabackup, as long it contains full dataset (you didn’t include just a subset of schemas), it will be PITR-compatible.

For mysqldump, there is an option to make it PITR-compatible. When you enable this option, all necessary options will be configured (for example, you won’t be able to pick separate schemas to include in the dump) and backup will be marked as available for point-in-time recovery.

Point-In-Time Recovery from a backup

First, you have to pick a backup to restore.

If the backup is compatible with PITR, an option will be presented to perform a Point-In-Time Recovery. You will have two options for that - “Time Based” and “Position Based”. Let’s discuss the difference between those two options.

“Time Based” PITR

With this option you can pass a date and time, up to which the backup should be restored. It can be defined within one second resolution. It does not guarantee that all of the data will be restored because, even if you are very precise in defining the time, during one second multiple events could be recorded in the binary log. Let’s say that you know that the data loss happened on 18th of April, at 10:00:01. You pass the following date and time to the form: ‘2018-04-18 10:00:00’. Please keep in mind that you should be using a time that is based on the timezone settings on the database server on which the backup was created.

It still may happen that the data loss even wasn’t the first one which happened at 10:00:01 so some of the events will be lost in the process. Let’s look at what that means.

During one second, multiple events may be logged in binlogs. Let's consider such case:
10:00:00 - events A,B,C,D,E,F
10:00:01 - events V,W,X,Y,Z
where X is the data loss event. With a granularity of a second, you can either restore up to everything which happened at 10:00:00 (so up to F) or up to 10:00:01 (up to Z). The later case is of no use as X would be re-executed. In the former case, we miss V and W.

That's why position based restore is more precise. You can tell "I want to restore up to W".

Time based restore is the most precise you can get without having to go to the binary logs and define the exact position to where you want to restore. This leads us to the second method of doing PITR.

“Position Based” PITR

Here some experience with command line tools for MySQL, namely mysqlbinlog utility, is required. On the other hand, you will have the best control over how the recovery will be made.

Let’s go through a simple example. As you can see in the screenshot above, you will have to pass a binary log name and binary log position up to which point the backup should be restored. Most of the time, this should be the last position before the data loss event.

Someone executed a SQL command which resulted in a serious data loss:

mysql> DROP TABLE sbtest1;
Query OK, 0 rows affected (0.02 sec)

Our application immediately started to complain:

sysbench 1.1.0-ecf1191 (using bundled LuaJIT 2.1.0-beta3)

Running the test with following options:
Number of threads: 2
Report intermediate results every 1 second(s)
Initializing random number generator from current time


Initializing worker threads...

Threads started!

FATAL: mysql_drv_query() returned error 1146 (Table 'sbtest.sbtest1' doesn't exist) for query 'DELETE FROM sbtest1 WHERE id=5038'
FATAL: `thread_run' function failed: /usr/local/share/sysbench/oltp_common.lua:490: SQL error, errno = 1146, state = '42S02': Table 'sbtest.sbtest1' doesn't exist

We have a backup but we want to restore all of the data up to that fatal moment. First of all, we assume that the application does not work so we can discard all of the writes which happened after the DROP TABLE as non-important. If your application works to some extent, you would have to merge the remaining changes later on. Ok, let’s examine the binary logs to find the position of the DROP TABLE statement. As we want to avoid parsing all of the binary logs, let’s find what was the position our latest backup covered. You can check that by examining logs for the latest backup set and look for a line similar to this one:

So, we are talking about filename 'binlog.000008' and position '16184120'. Let’s use this as our starting point. Let’s check what binary log files we have:

root@vagrant:~# ls -alh /var/lib/mysql/binlog.*
-rw-r----- 1 mysql mysql  58M Apr 17 08:31 /var/lib/mysql/binlog.000001
-rw-r----- 1 mysql mysql 116M Apr 17 08:59 /var/lib/mysql/binlog.000002
-rw-r----- 1 mysql mysql 379M Apr 17 09:30 /var/lib/mysql/binlog.000003
-rw-r----- 1 mysql mysql 344M Apr 17 10:54 /var/lib/mysql/binlog.000004
-rw-r----- 1 mysql mysql 892K Apr 17 10:56 /var/lib/mysql/binlog.000005
-rw-r----- 1 mysql mysql  74M Apr 17 11:03 /var/lib/mysql/binlog.000006
-rw-r----- 1 mysql mysql 5.2M Apr 17 11:06 /var/lib/mysql/binlog.000007
-rw-r----- 1 mysql mysql  21M Apr 18 11:35 /var/lib/mysql/binlog.000008
-rw-r----- 1 mysql mysql  59K Apr 18 11:35 /var/lib/mysql/binlog.000009
-rw-r----- 1 mysql mysql  144 Apr 18 11:35 /var/lib/mysql/binlog.index

So, in addition to 'binlog.000008' we also have 'binlog.000009' to examine. Let’s run the command which will convert binary logs into SQL format starting from the position we found in the backup log:

root@vagrant:~# mysqlbinlog --start-position='16184120' --verbose /var/lib/mysql/binlog.000008 /var/lib/mysql/binlog.000009 > binlog.out

Please node ‘--verbose’ is required to decode row-based events. This is not necessarily required for the DROP TABLE we are looking for, but for other type of events it may be needed.

Let’s search our output for the DROP TABLE query:

root@vagrant:~# grep -B 7 -A 1 "DROP TABLE" binlog.out
# at 20885489
#180418 11:24:32 server id 1  end_log_pos 20885554 CRC32 0xb89f2e66     GTID    last_committed=38168    sequence_number=38170    rbr_only=no
SET @@SESSION.GTID_NEXT= '7fe29cb7-422f-11e8-b48d-0800274b240e:38170'/*!*/;
# at 20885554
#180418 11:24:32 server id 1  end_log_pos 20885678 CRC32 0xb38a427b     Query    thread_id=54    exec_time=0    error_code=0
use `sbtest`/*!*/;
SET TIMESTAMP=1524050672/*!*/;
DROP TABLE `sbtest1` /* generated by server */
/*!*/;

In this sample we can see two events. First, at the position of 20885489, sets GTID_NEXT variable.

# at 20885489
#180418 11:24:32 server id 1  end_log_pos 20885554 CRC32 0xb89f2e66     GTID    last_committed=38168    sequence_number=38170    rbr_only=no
SET @@SESSION.GTID_NEXT= '7fe29cb7-422f-11e8-b48d-0800274b240e:38170'/*!*/;

Second, at the position of 20885554 is our DROP TABLE event. This leads to the conclusion that we should perform the PITR up to the position of 20885489. The only question to answer is which binary log we are talking about. We can check that by searching for binlog rotation entries:

root@vagrant:~# grep  "Rotate to binlog" binlog.out
#180418 11:35:46 server id 1  end_log_pos 21013114 CRC32 0x2772cc18     Rotate to binlog.000009  pos: 4

As it can be clearly seen by comparing dates, rotation to binlog.000009 happened later therefore we want to pass binlog.000008 as the binlog file in the form.

Next, we have to decide if we are going to restore the backup on the cluster or do we want to use external server to restore it. This second option could be useful if you want to restore just a subset of data. You can restore full physical backup on a separate host and then use mysqldump to dump the missing data and load it up on the production server.

Keep in mind that when you restore the backup on your cluster, you will have to rebuild nodes other than the one you recovered. In master - slave scenario you will typically want to restore backup on the master and then rebuild slaves from it.

As a last step, you will see a summary of actions ClusterControl will take.

ClusterControl
Single Console for Your Entire Database Infrastructure
Find out what else is new in ClusterControl

Finally, after the backup was restored, we will test if the missing table has been restored or not:

mysql> show tables from sbtest like 'sbtest1'\G
*************************** 1. row ***************************
Tables_in_sbtest (sbtest1): sbtest1
1 row in set (0.00 sec)

Everything seems ok, we managed to restore missing data.

The last step we have to take is to rebuild our slave. Please note that there is an option to use a PITR backup. In the example here, this is not possible as the slave would replicate the DROP TABLE event and it would end up not being consistent with the master.

Watch the Webinar Replay: How to Measure Database Availability

$
0
0

Watch the replay of Part 2 of our database high availability webinar special!

Thanks to to everyone who participated in this week’s webinar on how to measure database availability. The replay and slides are now available to view online.

It is notoriously hard to measure and report on, although it is an important KPI in any SLA between you and your customer. With that in mind, we will discuss the different factors that affect database availability and see how you can measure your database availability in a realistic way.

It is common enough to define availability in terms of 9s (e.g. 99.9% or 99.999%) - especially here at Severalnines - although there are often different opinions as to what these numbers actually mean, or how they are measured.

Is the database available if an instance is up and running, but it is unable to serve any requests? Or if response times are excessively long, so that users consider the service unusable? Is the impact of one longer outage the same as multiple shorter outages? How do partial outages affect database availability, where some users are unable to use the service while others are completely unaffected?

Not agreeing on precise definitions with your customers might lead to dissatisfaction. The database team might be reporting that they have met their availability goals, while the customer is dissatisfied with the service.

Join us for this webinar during which we will discuss the different factors that affect database availability and see how to measure database availability in a realistic way.

Watch the replay

Agenda

  • Defining availability targets
    • Critical business functions
    • Customer needs
    • Duration and frequency of downtime
    • Planned vs unplanned downtime
    • SLA
  • Measuring the database availability
    • Failover/Switchover time
    • Recovery time
    • Upgrade time
    • Queries latency
    • Restoration time from backup
    • Service outage time
  • Instrumentation and tools to measure database availability:
    • Free & open-source tools
    • CC's Operational Report
    • Paid tools

Watch the replay

Speaker

Bartlomiej Oles is a MySQL and Oracle DBA, with over 15 years experience in managing highly available production systems at IBM, Nordea Bank, Acxiom, Lufthansa, and other Fortune 500 companies. In the past five years, his focus has been on building and applying automation tools to manage multi-datacenter database environments.

Cloud Database Features Comparison - Amazon RDS vs Google Cloud SQL

$
0
0

As more companies run their workloads in the cloud, cloud database services are increasingly being used to manage data. One of the advantages of using a cloud database service instead of maintaining your database is that it reduces the management overhead. Database services from the leading cloud vendors share many similarities, but they have individual characteristics that may make them well-, or ill-suited to your workload. Developers are always looking for convenient ways of running their databases, whether it is to obtain more profound insight into database performance, to perform a migration efficiently, to simplify backup and restore processes, or to do many other "day to day" tasks. Among the number of available cloud services, it may not be easy to figure out which is the best one for our use case. In this article, we’ll compare two of the most popular cloud database services on the market - Google Cloud SQL and Amazon RDS.

Amazon RDS provides a web interface through which you can deploy MySQL. The RDS service manages the provisioning of the instance and configuration. Additionally, it also provides a console to monitor and perform basic database administration tasks. Google Cloud SQL similarly provides a predefined MySQL setup that is automatically managed. Predefined services can be a comfortable way to manage your databases however at the same time they can limit functionality. Let's take a closer look then at these management features.

Database logs and metrics monitoring

Amazon RDS and Google Cloud don't provide access to the shell. Your primary concern here may be access to essential log files. Amazon CloudWatch is a monitoring service for cloud resources which you can use to solve this problem. It collects metrics, collects and monitor log files or automatically react to changes in your AWS resources. Using CloudWatch, you can gather and processes error log, audit log and other logs from RDS into metrics presented in the web console. These statistics are recorded for 15 months so you can maintain a history. CloudWatch can take actions such as sending a notification to a notification recipient or if needed - autoscaling policies, which in turn may automatically handle an increase in load by adding more resources.

Amazon CloudWatch
Amazon CloudWatch

Google cloud also provides log processing functionality. You can view the Google Cloud SQL logs in the operations panel or through Google console. The operations panel logs every operation performed on the instance with pretty basic information. It could be extended with manually added metrics based on data from a file source. Unfortunately, the operations log does not include activities performed using external management tools, such as the mysql client. To extend basic functionality Google has another service - Stackdriver. The Stackdriver service can be used to create alerts for metrics defined in operational panel. Stackdriver embraces not only Google Cloud Platform (GCP) but also AWS and local services. You can use it for cross-cloud platform monitoring without additional agents. Stackdriver requires the installation of an open source based collected agent to access non-cloud metrics.

Google Cloud SQL logging

There are various ways in which you could monitor the MySQL instances metrics. It can be performed by querying the server all the time for the metrics values or with predefined services. You can get more in-depth visibility into the health of your Amazon RDS instances in real time with Enhanced Monitoring for Amazon RDS. It provides metrics so that you can monitor the health of your DB instances and DB clusters. You can monitor both DB instance metrics and operating system (OS) metrics.

It provides a set of over 50 database instance metrics and aggregated process information for your instances, at the granularity of 1 second. You can visualize the metrics on the RDS console.

Both CloudWatch and Stackdriver provides functionality to create alarms based on metrics. Amazon does it with Amazon Simple Notification Service (SNS) for notification. In Stackdiver it's done directly in this service.

Google Stackdriver monitoring dashboard

Data Migration into Cloud

At this moment backup based migration to Google Cloud SQL is quite limited. You can only use logical dump, which may be a problem for bigger databases. The SQL dump file must not include any triggers, views, or stored procedures. If your database needs these elements, you should recreate them after shipping the data. If you have already created a dump file that holds these components, you need manually edit the file. The database you are importing into must exist up front. There is no option to migrate to Google cloud from other RDBMS. It all makes the process quite limited, not to mention that there is no option for cross-platform migration in real time (AWS RDS).

AWS Database Migration Service

Amazon Database Migration Service (DMS) supports homogenous migrations such as MySQL to MySQL, as well as heterogeneous migrations between different database platforms. AWS DMS can help you in planning and migration of on-premises relational data stored in Oracle, SQL Server, MySQL, MariaDB, or PostgreSQL databases. DMS works by setting up and then managing a replication instance on AWS. This instance dumps data from the source database and loads it into the target database.

Achieving High Availability

Google use semisynchronous replicas to make your database highly available. Cloud SQL provides the ability to replicate a master instance to one or more read replicas. If the zone where the master is located experiences an outage and the backup server is set, Cloud SQL fails over to the failover replica.

Google Cloud SQL create read replica

The setup is straightforward, and with a couple of clicks, you can achieve a working slave node. Nevertheless, configuration options are limited and may not fit your system requirements. You can choose from the following replica scenarios:

  • read replica - a read replica is a one to one copy of the master. This is the base model where you create a replica to offload read requests or analytics traffic from the master,
  • external read replica - this option is to configure an instance that replicates to one or more replicas external to Cloud SQL,
  • external master - setup replication to migrate to Google Cloud SQL.

Amazon RDS provides read replica services. Cross-region read replicas gives you the ability to scale as AWS has its services in many areas in the world. RDS asynchronous replication is highly scalable. All read replicas are accessible and can be used for reading in a maximum number of five regions. These nodes are independent and can be used in your upgrade path or can be promoted to a standalone database.

In addition to that, Amazon offers Multi-AZ deployments based on DRBD, synchronous disk replication. How is it different from Read Replicas? The main difference is that only the database engine on the primary instance is active, which leads to other architectural variations.

Automated backups are taken from standby. That significantly reduces the possibility of performance degradation during a backup.

As opposed to read replicas, database engine version upgrades happen on the primary. Another difference is that AWS RDS will failover automatically while read replicas will require manual operations from you.

Multi-AZ failover on RDS uses a DNS change to point to the standby instance, according to Amazon this should happen in 60-120 seconds of unavailability during the failover. Because the standby uses the same storage data as the primary, there will probably be transaction/log recovery. Bigger databases may spend a significant amount of time on innoDB recovery, so please consider that in your DR plan.

Encryption

Security compliance is one of the critical concerns for enterprises whose data is in the cloud. When dealing with production databases that hold sensitive and vital data, it is highly recommended to implement encryption to protect the data from unauthorized access.

In Google Cloud SQL, customer data is encrypted when stored in database tables, temporary files, and backups. Outside connections can be encrypted by SSL certificates (especially for intra-zone connections to Cloud SQL), or by using the Cloud SQL Proxy. Google encrypts and authenticates all data in transit and data at rest with AES-256.

With RDS encryption enabled, the data is stored on the instance underlying storage, the automated backups, read replicas, and snapshots all become encrypted. The RDS encryption keys implement the AES-256 algorithm. Keys are being managed and protected by the AWS key management infrastructure through AWS Key Management Service (AWS KMS). You do not need to make any modifications to your code or operating model to benefit from this critical data protection feature. AWS CloudHSM is a service that helps meet stringent compliance requirements for cryptographic operations and storage of encryption keys by using a single tenant Hardware Security Module (HSM) appliances within the AWS cloud.

Pricing

Instance pricing for Google Cloud SQL is credited for every minute that the instance is running. The cost depends on the device type you choose for the instance, and the area where it's placed. Read replicas and failover replicas are charged at the same rate as stand-alone instances. The pricing starts from $0.0126 per hour of micro instance to $8k, db-n1-highmem-64 with 64 vCPUs, 416 GB RAM, 10,230 GB disk and limit of 4,000 connections.

Like other AWS products, users pay for what they use with RDS. But, this pay-as-you-go model has a specific billing construct that can, if left unchecked, yield questions or surprise billing elements if no one’s aware of what’s actually in the bill. You may bill your database options starting from 0.175$ per hour to upfront thousands of dollars. Both platforms are quite flexible, but you will see more configuration options in AWS.

Infrastructure

As mentioned in the pricing section, Google Cloud SQL can be scaled up to 64 processor cores and more than 400GB of RAM. The maximum size of the disk is 10TB per instance. You can configure your instance settings to increase it automatically. That should be plenty for many project requirements. Nevertheless if we take a look on what Amazon offers, there is still a long way for Google. RDS not only offers power instances but also long list of other services around it.

RDS supports storage volume snapshots, which you can use for point-in-time recovery or share with other AWS accounts. You can also take advantage of its provisioned IOPS feature to increase I/O. RDS can also be launched in Amazon VPC, Cloud SQL doesn’t yet support a virtual private network.

Backup

RDS generates automated backups of your DB instance. RDS establishes a storage volume snapshot of your DB instance, backing up the entire DB instance and not individual databases. Automated backups occur daily during the preferred backup window. If the backup requires more time than allotted to the backup window, the backup continues after the window ends, until it finishes. Read replication doesn't have backup enabled by default.

When you want to do a restore, the only option is to create a new instance. It can be restored to last backup or point in time recovery. Binary logs will be applied automatically, there is no possibility to get access to them. RDS PITR option is quite limited as it does not allow you to choose an exact time, or transaction. You will be limited to a 5 minutes interval. In most case scenarios, these settings may be sufficient however if you need to recover your database to the single transaction or exact time you need to be ready for manual actions.

Google Cloud SQL backup data is stored in separate regions for redundancy. With the automatic backup function enabled, database copy will be created every 4 hours. If needed you can create on-demand backups (for any Second Generation instance), whether the instance has automatic backups enabled or not. Google and Amazon approach for backups is quite the same however with Cloud SQL it is possible to perform the point in time recovery to the specific binary log and position.


Comparing Cloud Database Options for PostgreSQL

$
0
0

PostgreSQL is world’s most advanced and preferred open source RDBMS for many start-ups, mobile applications and developers.

The traditional way to set up, operate and scale PostgreSQL is time consuming and requires expertise in database systems and PostgreSQL.

There are many vendors which provides cloud platforms for different databases. These solutions come with facilities to make it easy to set up, operate and scale PostgreSQL deployments in the cloud.

Some examples of these services for PostgreSQL are Amazon RDS for PostgreSQL, Google cloud SQL for PostgreSQL, Heroku PostgreSQL, EnterpriseDB cloud database, Microsoft Azure for PostgreSQL, etc.

There are two cloud database environment models.

  1. Traditional cloud model: The content will be run on the particular enterprise infrastructure and any oversight will fall into the shoulders of the IT staff of the company.
  2. Database as a service (DBaaS): It runs on the service providers infrastructure and they (the vendor) would be responsible for any hitches or glitches.

Benefits of a Cloud-based Database

  1. Increase the speed of getting the application to the market
  2. Easy to set up and administer the database
  3. Getting rid of physical infrastructure.
  4. Developers can focus on the core part of the application instead of managing and maintaining servers.
  5. Ease to take backup
  6. Scale out easily
  7. High availability

Amazon RDS for PostgreSQL

Amazon RDS for PostgreSQL is one of the biggest players in the world which provides PostgreSQL database service in the cloud. It is one of the best option to scale a PostgreSQL deployment in the cloud. With Amazon RDS, we can easily manage and administer our databases.

Features of using Amazon RDS for PostgreSQL

  1. Easy to set up
  2. Push button scaling
  3. Automated backup and recovery
  4. Resizable hardware capacity and storage management
  5. Cost efficient
  6. High availability

Pricing

Amazon RDS pricing policy is to pay only for what you use. There is no minimum or maximum fee. You can estimate your monthly bill using the AWS simple monthly calculator.

Amazon RDS for PostgreSQL pricing depends on type of instances.

  1. Single AZ deployment: Pricing depends on deployment of DB instances in single availability zone.
  2. Multi AZ deployment: Pricing depends on deployment of DB instances in multiple availability zone.
  3. Reserved instances

Example

Google Cloud SQL

Google’s Cloud SQL provide a fully managed database service that makes it easy to set up, maintain and administer PostgreSQL BETA databases in the cloud. It is hosted on Google cloud platform which offers high performance, scalability and provides infrastructure for applications running anywhere in the world.

Features

  1. Scalability
  2. High performance
  3. Integrated
  4. Fully managed
  5. Security
  6. Standard APIs
  7. Availability protection

Pricing

Google’s Cloud SQL for PostgreSQL pricing is composed of the following charges:

  1. Instance pricing
  2. CPU and Memory pricing
  3. Storage pricing
  4. Network pricing

Instance Pricing

CPU and memory pricing

Storage pricing

Network pricing

Please check the Google cloud platform pricing calculator for more detail.

Microsoft Azure for PostgreSQL

Azure database for PostgreSQL is a well managed database service that makes it easier to build Apps without any management and administration burden. Azure for PostgreSQL service uses community PostgreSQL and seamlessly works with native tools, drivers and libraries.

Azure for PostgreSQL also provides high availability and scalability in seconds, helping you easily adjust to changes in customer demands. Additionally, you will get benefit from unparalleled security and compliance, including Azure IP Advantage, and Azure’s industry leading reach with more datacenters than any other cloud provider. Azure currently offers support for PostgreSQL versions 9.5 and 9.6.

Features

  1. Fully managed community PostgreSQL
  2. Languages and frameworks of customers choice
  3. Built-in high availability
  4. Scale within seconds
  5. Automated backups and point-in-time restore
  6. Unparalleled security and reach
  7. Simple and flexible pricing

Pricing tiers

There are three different pricing tiers of Azure database for PostgreSQL:

  1. Basic
  2. General purpose
  3. Memory optimized

Azure database for PostgreSQL pricing tiers are differentiated by the amount of compute in vCores that can be provisioned, memory per vCore, and the storage technology used to store the data. All the resources are provisioned at the PostgreSQL server level. Each server can have one or many databases.

Pricing

Compute generation 4 and compute generation 5

vCorePrice
1$0.034/hour
2$0.068/hour

Storage

GB/month$0.10

The above price is for the basic tier only. Please check the more details about pricing here.

Please check the Quickstart guide for Azure database for PostgreSQL.

Heroku PostgreSQL

Heroku Postgres is a managed SQL Database as a Service provided by Heroku. Heroku Postgres helps to maximize data instead of spending time on database setup and maintenance. It provides a wide range of features like testing schema migration, manage database access levels and protect queries, scale horizontally and quick access of data. Heroku Postgres keep the data very safely because it provides continuous protection to data and also offers a number of ways to replicate, backup and export the data. Heroku Postgres provides a web dashboard and ability to share queries with dataclips.

Features

  1. Easy to install
  2. Automated health check
  3. High availability
  4. Automatic scaling horizontally
  5. Seamlessly applying the latest security patch

Pricing

Heroku Postgres offers a wide range of plans to serve use cases that range in size from blogs to large dataset, high transaction applications.

Plan tiers

Plans are divided into five high level tiers. The main difference between each tier is the amount of tolerated monthly downtime for database in the tier.

  1. Hobby Tier: This is for apps that can tolerate up to 4 hours of downtime per month
  2. Standard Tier: This is for apps that can tolerate up to 1 hour of downtime per month
  3. Premium Tier: This is for apps that can tolerate up to 15 minutes of downtime per month
  4. Private Tier: This is for Heroku Enterprise customers
  5. Shield Tier: This is for Heroku Enterprise customers who need compliance capable databases.

EnterpriseDB Cloud Database

EnterpriseDB PostgreSQL Plus Cloud Database is used to deploy PostgreSQL databases to cloud server instances. The master database, all replica instances, and Amazon storage for the database run on AWS instances owned by you, while Postgres Plus Cloud Database consoles are owned and operated by EnterpriseDB.

EDB Postgres subscription plan offers subscription for:

  1. EDB Postgres platform
  2. EDB Postgres Ark DBaaS to multiple clouds

The Postgres Plus Cloud Database on AWS and EDB Postgres on Google compute platform are provided through a pay-as-you-go model in AWS marketplace and in the Google marketplace.

  1. Postgres plus cloud database on AWS
  2. EDB Postgres on Google compute

This is the estimated cost of EDB postgres on Google compute engine using default configuration.

There are two versions of EDB Postgres Plus Cloud Database.

  1. PostgreSQL Plus Cloud Database Basic: This is available with community PostgreSQL database.

  2. PostgreSQL Plus Cloud Database Advanced: This is available with EnterpriseDB’s PostgreSQL Plus Advanced Server with Oracle compatibility and enhanced security, performance and manageability.

Features

  1. Easy to install
  2. Backup and disaster recovery
  3. High availability
  4. Point in time recovery
  5. Support for Amazon’s Provisioned IOPS: It ensures consistent database performance and increase overall performance for I/O intensive workloads.

There are two options to purchase EDB cloud database:

  1. Purchase pay-as-you-go offering from Amazon without long term commitment
  2. Purchase one year subscription from EDB that lets you purchase computing resources directly from Amazon including reserved instances.

For more detail check the EDB Postgres plus cloud database FAQ’s.

Citus DB Cloud

Citus intelligently distributes the data & queries across the nodes so the database can scale and the queries can be faster. Citus is available as a database as a service, as enterprise software, and as open source. It is very simple to shard a PostgreSQL database. Citus cloud provides a fully managed Citus service delivered on top of AWS.

Citus is a extension to PostgreSQL for distributing your database across multiple nodes.

Features

  1. Scale out database
  2. Distributed SQL engine
  3. Seamless migration tools
  4. Fast performance
  5. High availability
  6. Multi-tenant SaaS support
  7. Automated backup and disaster recovery

Pricing

ClusterControl
Single Console for Your Entire Database Infrastructure
Find out what else is new in ClusterControl

ElephantSQL

ElephantSQL provides PostgreSQL as a Service. ElephantSQL installs and manages PostgreSQL and offers databases ranging from shard servers for small projects and proof of concepts, up to enterprise-grade multi-server setups. It also provides a browser tool for SQL queries where you can create, read, update and delete data directly from the web browser.

Features

  1. Fully managed HA PostgreSQL
  2. Automated backups
  3. Monitoring
  4. PostgreSQL browser

Pricing

Conclusion

Cloud databases are very important for removing IT complexities and to drive business goals.
Apart from handling the installation, maintenance and scaling of IT infrastructures, constant upgrades by cloud service providers make it easier for enterprises to cut down operational costs without compromising on security and quality.

How to Overcome Accidental Data Deletion in MySQL & MariaDB

$
0
0

Someone accidently deleted part of the database. Someone forgot to include a WHERE clause in a DELETE query, or they dropped the wrong table. Things like that may and will happen, it is inevitable and human. But the impact can be disastrous. What can you do to guard yourself against such situations, and how can you recover your data? In this blog post, we will cover some of the most typical cases of the data loss, and how you can prepare yourself so you can recover from them.

Preparations

There are things you should do in order to ensure a smooth recovery. Let’s go through them. Please keep in mind that it’s not “pick one” situation - ideally you will implement all of the measures we are going to discuss below.

Backup

You have to have a backup, there is no getting away from it. You should have your backup files tested - unless you test your backups, you cannot be sure if they are any good and if you will ever be able to restore them. For disaster recovery you should keep a copy of your backup somewhere outside of your datacenter - just in case the whole datacenter becomes unavailable. To speed up the recovery, it’s very useful to keep a copy of the backup also on the database nodes. If your dataset is large, copying it over the network from a backup server to the database node which you want to restore may take significant time. Keeping the latest backup locally may significantly improve recovery times.

Logical Backup

Your first backup, most likely, will be a physical backup. For MySQL or MariaDB, it will be either something like xtrabackup or some sort of filesystem snapshot. Such backups are great for restoring a whole dataset or for provisioning new nodes. However, in case of deletion of a subset of data, they suffer from significant overhead. First of all, you are not able to restore all of the data, or else you will overwrite all changes that happened after the backup was created. What you are looking for is the ability to restore just a subset of data, only the rows which were accidentally removed. To do that with a physical backup, you would have to restore it on a separate host, locate removed rows, dump them and then restore them on the production cluster. Copying and restoring hundreds of gigabytes of data just to recover a handful of rows is something we would definitely call a significant overhead. To avoid it you can use logical backups - instead of storing physical data, such backups store data in a text format. This makes it easier to locate the exact data which was removed, which can then be restored directly on the production cluster. To make it even easier, you can also split such logical backup in parts and backup each and every table to a separate file. If your dataset is large, it will make sense to split one huge text file as much as possible. This will make the backup inconsistent but for the majority of the cases, this is no issue - if you will need to restore the whole dataset to a consistent state, you will use physical backup, which is much faster in this regard. If you need to restore just a subset of data, the requirements for consistency are less stringent.

Point-In-Time Recovery

Backup is just a beginning - you will be able to restore your data to the point at which the backup was taken but, most likely, data was removed after that time. Just by restoring missing data from the latest backup, you may lose any data that was changed after the backup. To avoid that you should implement Point-In-Time Recovery. For MySQL it basically means you will have to use binary logs to replay all the changes which happened between the moment of the backup and the data loss event. The below screenshot shows how ClusterControl can help with that.

What you will have to do is to restore this backup up to the moment just before the data loss. You will have to restore it on a separate host in order not to make changes on the production cluster. Once you have the backup restored, you can log into that host, find the missing data, dump it and restore on the production cluster.

Delayed Slave

All of the methods we discussed above have one common pain point - it takes time to restore the data. It may take longer, when you restore all of the data and then try to dump only the interesting part. It may take less time if you have logical backup and you can quickly drill down to the data you want to restore, but it is by no means a quick task. You still have to find a couple of rows in a large text file. The larger it is, the more complicated the task gets - sometimes the sheer size of the file slows down all actions. One method to avoid those problems is to have a delayed slave. Slaves typically try to stay up to date with the master but it is also possible to configure them so that they will keep a distance from their master. In the below screenshot, you can see how to use ClusterControl to deploy such a slave:

In short, we have here an option to add a replication slave to the database setup and configure it to be delayed. In the screenshot above, the slave will be delayed by 3600 seconds, which is one hour. This lets you to use that slave to recover the removed data up to one hour from the data deletion. You will not have to restore a backup, it will be enough to run mysqldump or SELECT ... INTO OUTFILE for the missing data and you will get the data to restore on your production cluster.

ClusterControl
Single Console for Your Entire Database Infrastructure
Find out what else is new in ClusterControl

Restoring Data

In this section, we will go through a couple of examples of accidental data deletion and how you can recover from them. We will walk through recovery from a full data loss, we will also show how to recover from a partial data loss when using physical and logical backups. We will finally show you how to restore accidentally deleted rows if you have a delayed slave in your setup.

Full Data Loss

Accidental “rm -rf” or “DROP SCHEMA myonlyschema;” has been executed and you ended up with no data at all. If you happened to also remove files other than from the MySQL data directory, you may need to reprovision the host. To keep things simpler we will assume that only MySQL has been impacted. Let’s consider two cases, with a delayed slave and without one.

No Delayed Slave

In this case the only thing thing we can do is to restore the last physical backup. As all of our data has been removed, we don’t need to be worried about activity which happened after the data loss because with no data, there is no activity. We should be worried about the activity which happened after the backup took place. This means we have to do a Point-in-Time restore. Of course, it will take longer than to just restore data from the backup. If bringing your database up quickly is more crucial than to have all of the data restored, you can as well just restore a backup and be fine with it.

First of all, if you still have access to binary logs on the server you want to restore, you can use them for PITR. First, we want to convert the relevant part of the binary logs to a text file for further investigation. We know that data loss happened after 13:00:00. First, let’s check which binlog file we should investigate:

root@vagrant:~# ls -alh /var/lib/mysql/binlog.*
-rw-r----- 1 mysql mysql 1.1G Apr 23 10:32 /var/lib/mysql/binlog.000001
-rw-r----- 1 mysql mysql 1.1G Apr 23 10:33 /var/lib/mysql/binlog.000002
-rw-r----- 1 mysql mysql 1.1G Apr 23 10:35 /var/lib/mysql/binlog.000003
-rw-r----- 1 mysql mysql 1.1G Apr 23 10:38 /var/lib/mysql/binlog.000004
-rw-r----- 1 mysql mysql 1.1G Apr 23 10:39 /var/lib/mysql/binlog.000005
-rw-r----- 1 mysql mysql 1.1G Apr 23 10:41 /var/lib/mysql/binlog.000006
-rw-r----- 1 mysql mysql 1.1G Apr 23 10:43 /var/lib/mysql/binlog.000007
-rw-r----- 1 mysql mysql 1.1G Apr 23 10:45 /var/lib/mysql/binlog.000008
-rw-r----- 1 mysql mysql 1.1G Apr 23 10:47 /var/lib/mysql/binlog.000009
-rw-r----- 1 mysql mysql 1.1G Apr 23 10:49 /var/lib/mysql/binlog.000010
-rw-r----- 1 mysql mysql 1.1G Apr 23 10:51 /var/lib/mysql/binlog.000011
-rw-r----- 1 mysql mysql 1.1G Apr 23 10:53 /var/lib/mysql/binlog.000012
-rw-r----- 1 mysql mysql 1.1G Apr 23 10:55 /var/lib/mysql/binlog.000013
-rw-r----- 1 mysql mysql 1.1G Apr 23 10:57 /var/lib/mysql/binlog.000014
-rw-r----- 1 mysql mysql 1.1G Apr 23 10:59 /var/lib/mysql/binlog.000015
-rw-r----- 1 mysql mysql 306M Apr 23 13:18 /var/lib/mysql/binlog.000016

As can be seen, we are interested in the last binlog file.

root@vagrant:~# mysqlbinlog --start-datetime='2018-04-23 13:00:00' --verbose /var/lib/mysql/binlog.000016 > sql.out

Once done, let’s take a look at the contents of this file. We will search for ‘drop schema’ in vim. Here’s a relevant part of the file:

# at 320358785
#180423 13:18:58 server id 1  end_log_pos 320358850 CRC32 0x0893ac86    GTID    last_committed=307804   sequence_number=307805  rbr_only=no
SET @@SESSION.GTID_NEXT= '52d08e9d-46d2-11e8-aa17-080027e8bf1b:443415'/*!*/;
# at 320358850
#180423 13:18:58 server id 1  end_log_pos 320358946 CRC32 0x487ab38e    Query   thread_id=55    exec_time=1     error_code=0
SET TIMESTAMP=1524489538/*!*/;
/*!\C utf8 *//*!*/;
SET @@session.character_set_client=33,@@session.collation_connection=33,@@session.collation_server=8/*!*/;
drop schema sbtest
/*!*/;

As we can see, we want to restore up to position 320358785. We can pass this data to the ClusterControl UI:

Delayed Slave

If we have a delayed slave and that host is enough to handle all of the traffic, we can use it and promote it to master. First though, we have to make sure it caught up with the old master up to the point of the data loss. We will use some CLI here to make it happen. First, we need to figure out on which position the data loss happened. Then we will stop the slave and let it run up to the data loss event. We showed how to get the correct position in the previous section - by examining binary logs. We can either use that position (binlog.000016, position 320358785) or, if we use a multithreaded slave, we should use GTID of the data loss event (52d08e9d-46d2-11e8-aa17-080027e8bf1b:443415) and replay queries up to that GTID.

First, let’s stop the slave and disable delay:

mysql> STOP SLAVE;
Query OK, 0 rows affected (0.01 sec)
mysql> CHANGE MASTER TO MASTER_DELAY = 0;
Query OK, 0 rows affected (0.02 sec)

Then we can start it up to a given binary log position.

mysql> START SLAVE UNTIL MASTER_LOG_FILE='binlog.000016', MASTER_LOG_POS=320358785;
Query OK, 0 rows affected (0.01 sec)

If we’d like to use GTID, the command will look different:

mysql> START SLAVE UNTIL SQL_BEFORE_GTIDS = ‘52d08e9d-46d2-11e8-aa17-080027e8bf1b:443415’;
Query OK, 0 rows affected (0.01 sec)

Once the replication stopped (meaning all of the events we asked for have been executed), we should verify that the host contains the missing data. If so, you can promote it to master and then rebuild other hosts using new master as the source of data.

This is not always the best option. All depends on how delayed your slave is - if it is delayed by a couple of hours, it may not make sense to wait for it to catch up, especially if write traffic is heavy in your environment. In such case, it’s most likely faster to rebuild hosts using physical backup. On the other hand, if you have a rather small volume of traffic, this could be a nice way to actually quickly fix the issue, promote new master and get on with serving traffic, while the rest of the nodes are being rebuilt in the background.

Partial Data Loss - Physical Backup

In case of the partial data loss, physical backups can be inefficient but, as those are the most common type of a backup, it’s very important to know how to use them for partial restore. First step will always be to restore a backup up to a point in time before the data loss event. It’s also very important to restore it on a separate host. ClusterControl uses xtrabackup for physical backups so we will show how to use it. Let’s assume we ran the following incorrect query:

DELETE FROM sbtest1 WHERE id < 23146;

We wanted to delete just a single row (‘=’ in WHERE clause), instead we deleted a bunch of them (< in WHERE clause). Let’s take a look at the binary logs to find at which position the issue happened. We will use that position to restore the backup to.

mysqlbinlog --verbose /var/lib/mysql/binlog.000003 > bin.out

Now, let’s look at the output file and see what we can find there. We are using row-based replication therefore we will not see the exact SQL that was executed. Instead (as long as we will use --verbose flag to mysqlbinlog) we will see events like below:

### DELETE FROM `sbtest`.`sbtest1`
### WHERE
###   @1=999296
###   @2=1009782
###   @3='96260841950-70557543083-97211136584-70982238821-52320653831-03705501677-77169427072-31113899105-45148058587-70555151875'
###   @4='84527471555-75554439500-82168020167-12926542460-82869925404'

As can be seen, MySQL identifies rows to delete using very precise WHERE condition. Mysterious signs in the human-readable comment, “@1”, “@2”, mean “first column”, “second column”. We know that the first column is ‘id’, which is something we are interested in. We need to find a large DELETE event on a ‘sbtest1’ table. Comments which will follow should mention id of 1, then id of ‘2’, then ‘3’ and so on - all up to id of ‘23145’. All should be executed in a single transaction (single event in a binary log). After analysing the output using ‘less’, we found:

### DELETE FROM `sbtest`.`sbtest1`
### WHERE
###   @1=1
###   @2=1006036
###   @3='123'
###   @4='43683718329-48150560094-43449649167-51455516141-06448225399'
### DELETE FROM `sbtest`.`sbtest1`
### WHERE
###   @1=2
###   @2=1008980
###   @3='123'
###   @4='05603373460-16140454933-50476449060-04937808333-32421752305'

The event, to which those comments are attached started at:

#180427  8:09:21 server id 1  end_log_pos 29600687 CRC32 0x8cfdd6ae     Xid = 307686
COMMIT/*!*/;
# at 29600687
#180427  8:09:21 server id 1  end_log_pos 29600752 CRC32 0xb5aa18ba     GTID    last_committed=42844    sequence_number=42845   rbr_only=yes
/*!50718 SET TRANSACTION ISOLATION LEVEL READ COMMITTED*//*!*/;
SET @@SESSION.GTID_NEXT= '0c695e13-4931-11e8-9f2f-080027e8bf1b:55893'/*!*/;
# at 29600752
#180427  8:09:21 server id 1  end_log_pos 29600826 CRC32 0xc7b71da5     Query   thread_id=44    exec_time=0     error_code=0
SET TIMESTAMP=1524816561/*!*/;
/*!\C utf8 *//*!*/;
SET @@session.character_set_client=33,@@session.collation_connection=33,@@session.collation_server=8/*!*/;
BEGIN
/*!*/;
# at 29600826

So, we want to restore the backup up to the previous commit at position 29600687. Let’s do that now. We’ll use external server for that. We will restore backup up to that position and we will keep the restore server up and running so we can then later extract the missing data.

Once restore is completed, let’s make sure our data has been recovered:

mysql> SELECT COUNT(*) FROM sbtest.sbtest1 WHERE id < 23146;
+----------+
| COUNT(*) |
+----------+
|    23145 |
+----------+
1 row in set (0.03 sec)

Looks good. Now we can extract this data into a file which we will load back on the master.

mysql> SELECT * FROM sbtest.sbtest1 WHERE id < 23146 INTO OUTFILE 'missing.sql';
ERROR 1290 (HY000): The MySQL server is running with the --secure-file-priv option so it cannot execute this statement

Something is not right - this is because the server is configured to be able to write files only in a particular location - it’s all about security, we don’t want to let users save contents anywhere they like. Let’s check where we can save our file:

mysql> SHOW VARIABLES LIKE "secure_file_priv";
+------------------+-----------------------+
| Variable_name    | Value                 |
+------------------+-----------------------+
| secure_file_priv | /var/lib/mysql-files/ |
+------------------+-----------------------+
1 row in set (0.13 sec)

Ok, let’s try one more time:

mysql> SELECT * FROM sbtest.sbtest1 WHERE id < 23146 INTO OUTFILE '/var/lib/mysql-files/missing.sql';
Query OK, 23145 rows affected (0.05 sec)

Now it looks much better. Let’s copy the data to the master:

root@vagrant:~# scp /var/lib/mysql-files/missing.sql 10.0.0.101:/var/lib/mysql-files/
missing.sql                                                                                                                                                                      100% 1744KB   1.7MB/s   00:00

Now it’s time to load the missing rows on the master and test if it succeeded:

mysql> LOAD DATA INFILE '/var/lib/mysql-files/missing.sql' INTO TABLE sbtest.sbtest1;
Query OK, 23145 rows affected (2.22 sec)
Records: 23145  Deleted: 0  Skipped: 0  Warnings: 0

mysql> SELECT COUNT(*) FROM sbtest.sbtest1 WHERE id < 23146;
+----------+
| COUNT(*) |
+----------+
|    23145 |
+----------+
1 row in set (0.00 sec)

That’s all, we restored our missing data.

Partial Data Loss - Logical Backup

In the previous section, we restored lost data using physical backup and an external server. What if we had logical backup created? Let’s take a look. First, let’s verify that we do have a logical backup:

root@vagrant:~# ls -alh /root/backups/BACKUP-13/
total 5.8G
drwx------ 2 root root 4.0K Apr 27 07:35 .
drwxr-x--- 5 root root 4.0K Apr 27 07:14 ..
-rw-r--r-- 1 root root 2.4K Apr 27 07:35 cmon_backup.metadata
-rw------- 1 root root 5.8G Apr 27 07:35 mysqldump_2018-04-27_071434_complete.sql.gz

Yes, it’s there. Now, it’s time to decompress it.

root@vagrant:~# mkdir /root/restore
root@vagrant:~# zcat /root/backups/BACKUP-13/mysqldump_2018-04-27_071434_complete.sql.gz > /root/restore/backup.sql

When you look into it, you will see that the data is stored in multi-value INSERT format. For example:

INSERT INTO `sbtest1` VALUES (1,1006036,'18034632456-32298647298-82351096178-60420120042-90070228681-93395382793-96740777141-18710455882-88896678134-41810932745','43683718329-48150560094-43449649167-51455516141-06448225399'),(2,1008980,'69708345057-48265944193-91002879830-11554672482-35576538285-03657113365-90301319612-18462263634-56608104414-27254248188','05603373460-16140454933-50476449060-04937808333-32421752305')

All we need to do now is to pinpoint where our table is located and then where the rows, which are of interest to us, are stored. First, knowing mysqldump patterns (drop table, create new one, disable indexes, insert data) let’s figure out which line contains CREATE TABLE statement for ‘sbtest1’ table:

root@vagrant:~/restore# grep -n "CREATE TABLE \`sbtest1\`" backup.sql > out
root@vagrant:~/restore# cat out
971:CREATE TABLE `sbtest1` (

Now, using a method of trial and error, we need to figure out where to look for our rows. We’ll show you the final command we came up with. The whole trick is to try and print different range of lines using sed and then check if the latest line contains rows close to, but later than what we are searching for. In the command below we look for lines between 971 (CREATE TABLE) and 993. We also ask sed to quit once it reaches line 994 as the rest of the file is of no interest to us:

root@vagrant:~/restore# sed -n '971,993p; 994q' backup.sql > 1.sql
root@vagrant:~/restore# tail -n 1 1.sql  | less

The output looks like below:

INSERT INTO `sbtest1` VALUES (31351,1007187,'23938390896-69688180281-37975364313-05234865797-89299459691-74476188805-03642252162-40036598389-45190639324-97494758464','60596247401-06173974673-08009930825-94560626453-54686757363'),

This means that our row range (up to row with id of 23145) is close. Next, it’s all about manual cleaning of the file. We want it to start with the first row we need to restore:

INSERT INTO `sbtest1` VALUES (1,1006036,'18034632456-32298647298-82351096178-60420120042-90070228681-93395382793-96740777141-18710455882-88896678134-41810932745','43683718329-48150560094-43449649167-51455516141-06448225399')

And end up with the last row to restore:

(23145,1001595,'37250617862-83193638873-99290491872-89366212365-12327992016-32030298805-08821519929-92162259650-88126148247-75122945670','60801103752-29862888956-47063830789-71811451101-27773551230');

We had to trim some of the unneeded data (it is multiline insert) but after all of this we have a file which we can load back on the master.

root@vagrant:~/restore# cat 1.sql | mysql -usbtest -psbtest -h10.0.0.101 sbtest
mysql: [Warning] Using a password on the command line interface can be insecure.

Finally, last check:

mysql> SELECT COUNT(*) FROM sbtest.sbtest1 WHERE id < 23146;
+----------+
| COUNT(*) |
+----------+
|    23145 |
+----------+
1 row in set (0.00 sec)

All is good, data has been restored.

Partial Data Loss, Delayed Slave

In this case, we will not go through the whole process. We already described how to identify the position of a data loss event in the binary logs. We also described how to stop a delayed slave and start the replication again, up to a point before the data loss event. We also explained how to use SELECT INTO OUTFILE and LOAD DATA INFILE to export data from external server and load it on the master. That’s all you need. As long as the data is still on the delayed slave, you have to stop it. Then you need to locate the position before the data loss event, start the slave up to that point and, once this is done, use the delayed slave to extract data which was deleted, copy the file to master and load it to restore the data.

Conclusion

Restoring lost data is not fun, but if you follow the steps we went through in this blog, you will have a good chance of recovering what you lost.

A Guide to Pgpool for PostgreSQL - Part Two

$
0
0

This is the second part of the blog “A Guide to Pgpool for PostgreSQL”. The first part covering load balancing, session pooling, in memory cache and installation can be found here.

Many users look towards pgpool specifically for High Availability features, and it has plenty to offer. There are few quite a lot of instructions for pgpool HA on the web (e.g. longer one and shorter one), so it would not make any sense to repeat them. Neither do we want to provide yet another blind set of configuration values. Instead I suggest to play against the rules and try doing it the wrong way, so we’ll see some interesting behaviour. One of the top expected feature (at least it’s on the top of the page) is the ability to recognise the usability of a “dead” ex master and re-use it with pg_rewind. It could save hours of bringing back the new standby with big data (as we skip rsync or pg_basebackup, which effectively copies ALL files over from the new master). Strictly speaking, pg_rewind is meant for planned failover (during upgrade or migrating to new hardware). But we’ve seen when it’s greatly helps with not planned but yet graceful shutdown and automated failover - for e.g., ClusterControl makes use of it when performing automatic failover of replication slaves. Let’s assume we have the case: we need (any) master to be accessible as much as possible. If for some reason (network failure, max connections exceeded or any other “failure” that forbids new sessions to start) we no longer can use a master for RW operations, we have a failover cluster configured, with slaves that can accept connections. We can then promote one of the slaves and fail over to it.

First let’s assume we have three nodes:

  • 10.1.10.124:5400 with /pg/10/m (pgpool spins here as well)
  • 10.1.10.147:5401 with /pg/10/m2
  • 10.1.10.124:5402 with /pg/10/s2

Those are effectively the same nodes as in part one, but the failover node is moved to a different host and $PGDATA. I did it to make sure I did not typo or forget some extra quote in remote ssh command. Also the debugging info will look simpler because ip addresses are different. Finally I was not sure I will be able to make this unsupported use case to work, so I have to see it with my own eyes.

Failover

First we set failover_command and run pgpool reload and try to failover. Here and further, I will echo some info to /tmp/d on the pgpool server, so I can tail -f /tmp/d to see the flow.

postgres@u:~$ grep failover_command /etc/pgpool2/pgpool.conf
failover_command = 'bash /pg/10/fo.sh %D %H %R'

postgres@u:~$ cat /pg/10/fo.sh
rem_cmd="pg_ctl -D $3 promote"
cmd="ssh -T postgres@$2 $rem_cmd"
echo "$(date) $cmd">>/tmp/d
$cmd &>>/tmp/d

NB: Do you have $PATH set in .bashrc on remote host?..

Let’s stop the master (I know it’s not how disaster happens, you expect at least some huge monkey or red shining robot to smash the server with a huge hammer, or at least the boring hard disks to die, but I’m using this graceful variant to demo the possible use of pg_rewind, so here the failover will be the result of human error or network failure a half second over the health_check_period), so:

/usr/lib/postgresql/10/bin/pg_ctl -D /pg/10/m stop
2018-04-18 13:53:55.469 IST [27433]  LOG:  received fast shutdown request
waiting for server to shut down....2018-04-18 13:53:55.478 IST [27433]  LOG:  aborting any active transactions
2018-04-18 13:53:55.479 IST [28855] postgres t FATAL:  terminating connection due to administrator command
2018-04-18 13:53:55.483 IST [27433]  LOG:  worker process: logical replication launcher (PID 27440) exited with exit code 1
2018-04-18 13:53:55.484 IST [27435]  LOG:  shutting down
2018-04-18 13:53:55.521 IST [27433]  LOG:  database system is shut down
 done
server stopped

Now checking the failover command output:

postgres@u:~$ cat /tmp/d
Wed Apr 18 13:54:05 IST 2018 ssh -T postgres@localhost
pg_ctl -D /pg/10/f promote
waiting for server to promote.... done
server promoted

And checking after a while:

t=# select nid,port,st, role from dblink('host=localhost port=5433','show pool_nodes') as t (nid int,hostname text,port int,st text,lb_weight float,role text,cnt int,cur_node text,del int);
 nid | port |  st  |  role
-----+------+------+---------
   0 | 5400 | down | standby
   1 | 5401 | up   | primary
   2 | 5402 | up   | standby
(3 rows)

Also we see in ex-failover cluster logs:

2018-04-13 14:26:20.823 IST [20713]  LOG:  received promote request
2018-04-13 14:26:20.823 IST [20713]  LOG:  redo done at 0/951EC20
2018-04-13 14:26:20.823 IST [20713]  LOG:  last completed transaction was at log time 2018-04-13 10:41:54.355274+01
2018-04-13 14:26:20.872 IST [20713]  LOG:  selected new timeline ID: 2
2018-04-13 14:26:20.966 IST [20713]  LOG:  archive recovery complete
2018-04-13 14:26:20.998 IST [20712]  LOG:  database system is ready to accept connections

Checking replication:

postgres@u:~$ psql -p 5401 t -c "select now() into test"
SELECT 1
postgres@u:~$ psql -p 5402 t -c "select * from test"
              now
-------------------------------
 2018-04-13 14:33:19.569245+01
(1 row)

The slave /pg/10/s2:5402 switched to a new timeline thanks to recovery_target_timeline = latestin recovery.conf, so we are good. We don’t need to adjust recovery.conf to point to the new master, because it points to the pgpool ip and port and they stay the same no matter who is performing the primary master role.

Checking load balancing:

postgres@u:~$ (for i in $(seq 1 9); do psql -h localhost -p 5433 t -c "select current_setting('port') from ts limit 1" -XAt; done) | sort| uniq -c
      6 5401
      3 5402

Nice. Apps behind pgpool will notice a second outage and continue to work.

Reusing ex-master

Now we can turn the ex-master to failover standby and bring it back (without adding a new node to pgpool, as it exists there already). If you don’t have wal_log_hints enabled or data checksums (comprehensive difference between these options is here), you have to recreate cluster on ex-master to follow a new timeline:

postgres@u:~$ rm -fr /pg/10/m
postgres@u:~$ pg_basebackup -h localhost -p 5401 -D /pg/10/m/

But don’t rush to run the statements above! If you took care on wal_log_hints (requires restart), you can try using pg_rewind for much faster switching of the ex-master to a new slave.

So ATM we have the ex-master offline, new master with next timeline started. If the ex-master was offline due to temporary network failure and it comes back, we need to shut it down first. In the case above we know it’s down, so we can just try rewinding:

postgres@u:~$ pg_rewind -D /pg/10/m2 --source-server="port=5401 host=10.1.10.147"
servers diverged at WAL location 0/40605C0 on timeline 2
rewinding from last common checkpoint at 0/4060550 on timeline 2
Done!

And again:

postgres@u:~$ pg_ctl -D /pg/10/m2 start
server started
...blah blah 
postgres@u:~$ 2018-04-16 12:08:50.303 IST [24699]  LOG:  started streaming WAL from primary at 0/B000000 on timeline 2

t=# select nid,port,st,role from dblink('host=localhost port=5433','show pool_nodes') as t (nid int,hostname text,port int,st text,lb_weight float,role text,cnt int,cur_node text,del int);
 nid | port |  st  |  role
-----+------+------+---------
   0 | 5400 | down | standby
   1 | 5401 | up   | primary
   2 | 5402 | up   | standby
(3 rows)

Ops. Duh! Despite the fact that the cluster at port 5400 is online and follows a new timeline, we need to tell pgpool to recognize it:

postgres@u:~$ pcp_attach_node -w -h 127.0.0.1 -U vao -n 0
 pcp_attach_node  -- Command Successful

Now all three are up (and pgpool knows it) and in sync:

postgres@u:~$ sql="select ts.i::timestamp(0), current_setting('data_directory'),case when pg_is_in_recovery() then 'recovering' else 'mastering' end stream from ts order by ts desc"
postgres@u:~$ psql -h 10.1.10.147 -p 5401 t -c "$sql";
          i          | current_setting |  stream
---------------------+-----------------+-----------
 2018-04-30 14:34:36 | /pg/10/m2       | mastering
(1 row)

postgres@u:~$ psql -h 10.1.10.124 -p 5402 t -c "$sql";
          i          | current_setting |   stream
---------------------+-----------------+------------
 2018-04-30 14:34:36 | /pg/10/s2       | recovering
(1 row)

postgres@u:~$ psql -h 10.1.10.124 -p 5400 t -c "$sql";
          i          | current_setting |   stream
---------------------+-----------------+------------
 2018-04-30 14:34:36 | /pg/10/m        | recovering
(1 row)

Now I’ll try using recovery_1st_stage_command for reusing ex-master:

root@u:~# grep 1st /etc/pgpool2/pgpool.conf
recovery_1st_stage_command = 'or_1st.sh'

But recovery_1st_stage_command does not offer the needed arguments for pg_rewind, which I can see if I add to recovery_1st_stage_command:

echo "online recovery started on $(hostname) $(date --iso-8601) $0 $1 $2 $3 $4"; exit 1;

The output:

online recovery started on u2 2018-04-30 /pg/10/m2/or_1st.sh /pg/10/m2 10.1.10.124 /pg/10/m 5401

Well - using pg_rewind is just in todo list - what did I expect?.. So I need to do some monkey hack to get master ip and port (remember it will keep changing after failover).

A monkey hack

So I have something like this in recovery_1st_stage_command:

root@u:~# cat /pg/10/or_1st.sh
pgpool_host=10.1.10.124
pgpool_port=5433
echo "online recovery started on $(hostname) $(date --iso-8601) $0 $1 $2 $3 $4" | ssh -T $pgpool_host "cat >> /tmp/d"
master_port=$(psql -XAt -h $pgpool_host -p $pgpool_port t -c "select port from dblink('host=$pgpool_host port=$pgpool_port','show pool_nodes') as t (nid int,hostname text,port int,st text,lb_weight float,role text,cnt int,cur_node text,del int) where role='primary'")
master_host=$(psql -XAt -h $pgpool_host -p $pgpool_port t -c "select hostname from dblink('host=$pgpool_host port=$pgpool_port','show pool_nodes') as t (nid int,hostname text,port int,st text,lb_weight float,role text,cnt int,cur_node text,del int) where role='primary'")
failover_host=$(psql -XAt -h $pgpool_host -p $pgpool_port t -c "select hostname from dblink('host=$pgpool_host port=$pgpool_port','show pool_nodes') as t (nid int,hostname text,port int,st text,lb_weight float,role text,cnt int,cur_node text,del int) where role!='primary' order by port limit 1")
src='"port=$master_port host=$master_host"'
rem_cmd="'pg_rewind -D $3 --source-server=\"port=$master_port host=$master_host\"'"
cmd="ssh -T $failover_host $rem_cmd"
echo $cmd | ssh -T $pgpool_host "cat >> /tmp/d"
$cmd

tmp=/tmp/rec_file_tmp
cat > $tmp <<EOF
standby_mode          = 'on'
primary_conninfo      = 'host=$master_host port=$master_port user=postgres'
trigger_file = '/tmp/tg_file'
recovery_target_timeline  = latest
EOF

scp $tmp $failover_host:$3/recovery.conf

rem_cmd="pg_ctl -D $3 start"
cmd="ssh -T $failover_host $rem_cmd"
echo $cmd | ssh -T $pgpool_host "cat >> /tmp/d"
$cmd
echo "OR finished $(date --iso-8601)" | ssh -T $pgpool_host "cat >> /tmp/d"
exit 0;

Now what a mess! Well - if you decide to use not existing feature - prepare - it will look bad, work worse and you will permanently feel ashamed of what you did. So step by step:

  • I need pgpool IP and port to remotely connect to it, both to query “show pool_nodes” and to log steps and to run commands.
  • I’m piping some dbg info to /tmp/d over ssh, because the command will be executed on master side, which will change after failing over
  • I can use the result of “show pool_nodes” to get the running master connection info simply filtering with WHERE clause
  • I will need double quotes in argument for pg_rewind, which will need to run over ssh, so I just split the command for readability, then echo it and run
  • Preparing recovery.conf based on output from “show pool_nodes” (writing it I ask myself - why did I not just use pgpool IP and port instead?..
  • Starting new failover slave (I know I’m supposed to use 2nd step - just skipped to avoid getting all IPs and port over again)

Now what’s left - trying to use this mess in pcp:

root@u:~# pcp_recovery_node -h 127.0.0.1 -U vao -n 0 -w
pcp_recovery_node -- Command Successful
root@u:~# psql -h localhost -p 5433 t -c"select nid,port,st,role from dblink('host=10.1.10.124 port=5433','show pool_nodes') as t (nid int,hostname text,port int,st text,lb_weight float,role text,cnt int,cur_node text,del int)"
 nid | port | st |  role
-----+------+----+---------
   0 | 5400 | up | standby
   1 | 5401 | up | primary
   2 | 5402 | up | standby
(3 rows)

Checking the /tmp/d on pgpool server:

root@u:~# cat /tmp/d
Tue May  1 11:37:59 IST 2018 ssh -T postgres@10.1.10.147 /usr/lib/postgresql/10/bin/pg_ctl -D /pg/10/m2 promote
waiting for server to promote.... done
server promoted
online recovery started on u2 2018-05-01 /pg/10/m2/or_1st.sh /pg/10/m2
ssh -T 10.1.10.124 'pg_rewind -D --source-server="port=5401 host=10.1.10.147"'
ssh -T 10.1.10.124 pg_ctl -D start
OR finished 2018-05-01

Now obviously we want to roll it over again to see if it works on any host:

postgres@u:~$ ssh -T 10.1.10.147 pg_ctl -D /pg/10/m2 stop             waiting for server to shut down.... done
server stopped
postgres@u:~$ psql -h localhost -p 5433 t -c"select nid,port,st,role from dblink('host=10.1.10.124 port=5433','show pool_nodes') as t (nid int,hostname text,port int,st text,lb_weight float,role text,cnt int,cur_node text,del int)"
 nid | port |  st  |  role
-----+------+------+---------
   0 | 5400 | up   | primary
   1 | 5401 | down | standby
   2 | 5402 | up   | standby
(3 rows)

root@u:~# pcp_recovery_node -h 127.0.0.1 -U vao -n 1 -w

postgres@u:~$ psql -h localhost -p 5433 t -c"select nid,port,st,role from dblink('host=10.1.10.124 port=5433','show pool_nodes') as t (nid int,hostname text,port int,st text,lb_weight float,role text,cnt int,cur_node text,del int)"
 nid | port | st |  role
-----+------+----+---------
   0 | 5400 | up | primary
   1 | 5401 | up | standby
   2 | 5402 | up | standby
(3 rows)

Log looks similar - only IP and ports have changed:

 Tue May  1 11:44:01 IST 2018 ssh -T postgres@10.1.10.124 /usr/lib/postgresql/10/bin/pg_ctl -D /pg/10/m promote
waiting for server to promote.... done
server promoted
online recovery started on u 2018-05-01 /pg/10/m/or_1st.sh /pg/10/m 10.1.10.147 /pg/10/m2 5400
ssh -T 10.1.10.147 'pg_rewind -D /pg/10/m2 --source-server="port=5400 host=10.1.10.124"'
ssh -T 10.1.10.147 pg_ctl -D /pg/10/m2 start
online recovery started on u 2018-05-01 /pg/10/m/or_1st.sh /pg/10/m
ssh -T 10.1.10.147 'pg_rewind -D --source-server="port=5400 host=10.1.10.124"'
ssh -T 10.1.10.147 pg_ctl -D start
OR finished 2018-05-01

In this sandbox, the master moved to 5401 on failover and after living there for a while it moved back to 5400. Using pg_rewind should make it as fast as possible. Previously the scary part of automatic failover was - if you really messed up the config and did not foresee some force majeure, you could run into automatic failover to next slave and next and next until there is no free slave left. And after that, you just end up with several split brained masters and no failover spare. It’s a poor consolation in such scenario to have even more slaves to failover, but without pg_rewind you would not have even that. “Traditional” rsync or pg_basebackup copy ALL $PGDATA over to create a standby, and can’t reuse the “not too much different” ex master.

In conclusion to this experiment I would like to emphasize once again - this is not a solution suitable for blind copy pasting. The usage of pg_rewind is not encouraged for pg_pool. It is not usable at all ATM. I wanted to add some fresh air to pgpool HA configuration, for nubes like me to observe a little closer how it works. For coryphaeus to smile at naivistic approach and maybe see it with our - nubes eyes.

How to Go Into Production With MongoDB - Top Ten Tips

$
0
0

After the successful development of the application and prior to dedicating yourself to the production of MongoDB, reckon with these quick guidelines in order to ensure a smooth and efficient flow as well as to achieve optimal performance.

1) Deployment Options

Selection of Right Hardware

For optimal performance, it’s preferable to use SSD rather than the HDD. It is necessary to take care whether your storage is local or remote and take measures accordingly. It’s better to use RAID for protection of hardware defects and recovery scheme, but don’t rely completely on it, as it doesn’t offer any protection against adverse failures. For execution on disks, RAID-10 is a good fit in terms of performance and availability which lacks often in other RAID levels. The right hardware is the building block for your application for optimized performance and to avoid any major debacle.

Cloud Hosting

A range of cloud vendors is available which offer pre-installed MongoDB database hosts. The selection of best choice is the founding step for your application to grow and make first impressions on the target market. MongoDB Atlas is one of the possible choices which offers a complete solution for cloud interface with features like deployment of your nodes and a snapshot of your data stored in Amazon S3. ClusterControl is another good available option for easy deployment and scaling. Which offers a variety of features like easy addition and removal of nodes, resize instances, and cloning of your production cluster. You can try ClusterControl here without being charged. Other available options are RackSpace ObjectRocket and MongoStitch.

2) RAM

Frequently accessed items are cached in RAM, so that MongoDB can provide optimal response time. RAM usually depends on the amount of data you are going to store, the number of collections, and indexes. Make sure you have enough RAM to accommodate your indexes otherwise it will drastically affect your application performance on production. More RAM means less page fault and better response time.

3) Indexing

For applications which include chronic write requests, indexing plays an imperative role. According to MongoDB docs:

“If a write operation modifies an indexed field, MongoDB updates all indexes that have the modified field as a key”

So, be careful while choosing indexes as it may affect your DB performance.

Indexing Example: Sample entry in the restaurant database

{
  "address": {
     "building": "701",
     "street": "Harley street",
     "zipcode": "71000"
  },
  "cuisine": "Bakery",
  "grades": [
     { "date": { "$date": 1393804800000 }, "grade": "A", "score": 2 },
     { "date": { "$date": 1378857600000 }, "grade": "A", "score": 6 },
     { "date": { "$date": 1358985600000 }, "grade": "A", "score": 10 },
     { "date": { "$date": 1322006400000 }, "grade": "A", "score": 9 },
     { "date": { "$date": 1299715200000 }, "grade": "B", "score": 14 }
  ],
  "name": "Bombay Bakery",
  "restaurant_id": "187521"
}
  1. Creating Index on Single Field

    > db.restaurants.createIndex( { "cuisine": 1 } );
    {
         "createdCollectionAutomatically" : false,
         "numIndexesBefore" : 1,
         "numIndexesAfter" : 2,
         "ok" : 1
    }

    In above example ascending order index is created on cuisine field.

  2. Creating Index on Multiple Fields

    > db.restaurants.createIndex( { "cuisine": 1 , "address.zipcode": -1 } );
    {
            "createdCollectionAutomatically" : false,
            "numIndexesBefore" : 2,
            "numIndexesAfter" : 3,
            "ok" : 1
    }

    Here compound index is created on cuisine and zip code fields. The -ve number defines descending order.

4) Be Prepared for Sharding

MongoDB partitions the data into different machines using a mechanism known as sharding. It is not advised to add sharding in the beginning unless you are expecting hefty datasets. Do remember to keep your application performance in line you need a good sharding key, according to your data patterns as it directly affects your response time. Balancing of data across shards is automatic. However, it’s better to be prepared and have a proper plan. So you can consolidate whenever your application demands.

5) Best practices for OS Configuration

  • XFS File System
    • It’s highly scalable, high performance 64-bit journaling file system. Revamps I/O performance by permitting fewer and larger I/O operations.
  • Put file descriptor limit.
  • Disable transparent huge pages and Nonuniform Access Memory (NUMA).
  • Change the default TCP keepalive time to 300 seconds (for Linux) and 120 seconds (for Azure).

Try these commands for changing default keepalive time;

For Linux

sudo sysctl -w net.ipv4.tcp_keepalive_time=<value>

For Windows

Type this command in Command Prompt as an Administrator, where <value> is expressed in hexadecimal (e.g. 120000 is 0x1d4c0):

reg add HKLM\SYSTEM\CurrentControlSet\Services\Tcpip\Parameters\ /t REG_DWORD /v KeepAliveTime /d <value>

6) Ensuring High Availability using Replication

Going on production without replication can cause your app sudden down failures. Replication takes care of the problem if a node fails. Manage read, write operations for your secondary MongoDB instances according to your application needs.

Keep these things in mind while Replicating:

  • For high availability, deploy your replica set into a minimum of three data centers.
  • Ensure that MongoDB instances have 0 or 1 votes.
  • Ensure full bi-directional network connectivity between all MongoDB instances.

Example of creating a replica set with 4 local MongoDB instances:

  1. Creating 4 local MongoDB instances

    First, create data directories

    mkdir -p /data/m0
    mkdir -p /data/m1
    mkdir -p /data/m2
    mkdir -p /data/m3
  2. Start 4 local instances

    mongod --replSet cluster1 --port 27017 --dbpath /data/m0
    mongod --replSet cluster2 --port 27018 --dbpath /data/m1
    mongod --replSet cluster1 --port 27019 --dbpath /data/m2
    mongod --replSet cluster1 --port 27020 --dbpath /data/m3
  3. Add the instances to the cluster and initiate

    mongo myhost:34014
    myConfig = {_id: ‘cluster1’, members: [
        {_id: 0, host: ‘myhost1:27017’},
        {_id: 1, host: ‘myhost2:27018’},
        {_id: 2, host: ‘myhost3:27019’},
        {_id: 3, host: ‘myhost4:27020’}]
    }
    rs.initiate(myConfig);

Security Measures

7) Secure Machines

Open ports on machines hosting MongoDB are vulnerable to various malicious attacks. More than 30 thousand MongoDB databases had been compromised in a ransomware attack due to lag in proper security configuration. While going on production close your public ports of MongoDB server. However, You should keep one port open for SSh purpose.

Enabling Authentication on MongoDB instance:

  1. Launch mongod.conf file in your favorite editor.

  2. Append these lines at the end of the config file.

    security:
          authorization: enabled
  3. Append these lines at the end of the config file.

    service mongod restart
  4. Confirm the status

    service mongod status

Restraining external access

Open mongod.conf file again to set limited IPs access your server.

bind_ip=127.0.0.1

By adding this line, it means you can only access your server through 127.0.0. (which is localhost). You can also add multiple IPs in bind option.

bind_ip=127.0.0.1,168.21.200.200

It means you can access from localhost and your private network.

8) Password Protection

To add an extra security layer to your machines enable access control and enforce authentication. Despite the fact that you have restrained MongoDB server to accept connections from the outside world, there is still a possibility of any malicious scripts to get into your server. So, don’t be reluctant to set a username/password for your database and assign required permissions. Enabled access control will allow users only to perform actions determined by their roles.

Here are the steps to create a user and assigning database access with specific roles.

In the first place we will create a user (in this case, it’s admin) for managing all users and databases and then we will create specific database owner having only read and write privileges on one MongoDB database instance.

Create an admin user for managing others users for database instances

  1. Open your Mongo shell and switch to the admin database:

    use admin
  2. Create a user for admin database

    db.createUser({ user: "admin", pwd: "admin_password", roles: [{ role: "userAdminAnyDatabase", db: "admin" }] })
  3. Authenticate newly created user

    db.auth("admin", "admin_password")
  4. Creating specific instance user:

    use database_1
    db.createUser({ user: "user_1", pwd: "your_password", roles: [{ role: "dbOwner", db: "database_1" }] })
  5. Now verify, if a user has been successfully created or not.

    db.auth("user_1", "your_password")
    show collections

That’s it! You have successfully secured your database instances with proper authentication. You can add as many users as you want following the same procedure.

9) Encryption and Protection of Data

If you are using Wiredtiger as a storage engine then you can use it’s encryption at rest configuration to encrypt your data. If not, then encryption should be performed on the host using a file system, devices or physical encryption.

10) Monitor Your Deployment

Once you have finished the deployment of MongoDB into production, then you must track the performance activity to prevent early possible problems. There is a range of strategies you can adapt to monitor your data performance in the production environment.

  • MongoDB includes utilities, which return statistics about instance performance and activity. Utilities are used to pinpoint issues and analyze normal operations.

  • Use mongostat to apprehend arrangement of operation types and capacity planning.

  • For tracking reports and read-write activities, mongotop is recommended.

mongotop 15

This command will return output after every 15 seconds.

                     ns    total    read    write          2018-04-22T15:32:01-05:00
   admin.system.roles      0ms     0ms      0ms
 admin.system.version      0ms     0ms      0ms
             local.me      0ms     0ms      0ms
       local.oplog.rs      0ms     0ms      0ms
   local.replset.minvalid  0ms     0ms      0ms
    local.startup_log      0ms     0ms      0ms
 local.system.indexes      0ms     0ms      0ms
  local.system.namespaces  0ms     0ms      0ms
 local.system.replset      0ms     0ms      0ms     
                     ns    total    read    write          2018-04-22T15:32:16-05:00
   admin.system.roles      0ms     0ms      0ms
 admin.system.version      0ms     0ms      0ms
             local.me      0ms     0ms      0ms
       local.oplog.rs      0ms     0ms      0ms
   local.replset.minvalid  0ms     0ms      0ms
    local.startup_log      0ms     0ms      0ms
 local.system.indexes      0ms     0ms      0ms
  local.system.namespaces  0ms     0ms      0ms
 local.system.replset      0ms     0ms      0ms

MongoDB Monitoring Service (MMS) is another available option that monitors your MongoDB cluster and makes it convenient for you to have a sight of production deployment activities.

And of course there is ClusterControl by Severalnines, the automation and management system for open source databases. ClusterControl enables easy deployment of clusters with automated security settings and makes it simple to troubleshoot your database by providing easy-to-use management automation that includes repair and recovery of broken nodes, automatic upgrades, and more. You can get started with its (free forever) Community Edition, with which you can deploy and monitor MongoDB as well as create custom advisors in order to tune your monitoring efforts to those aspects that are specific to your setup. Download it free here.

Migrating to Galera Cluster for MySQL and MariaDB

$
0
0

Galera Cluster is a mainstream option for high availability MySQL and MariaDB. And though it has established itself as a credible replacement for traditional MySQL master-slave architectures, it is not a drop-in replacement.

While Galera Cluster has some characteristics that make it unsuitable for certain use cases, most applications can still be adapted to run on it.

The benefits are clear: multi-master InnoDB setup with built-in failover and read scalability.

But how do you migrate? Does the schema or application change? What are the limitations? Can a migration be done online, without service interruption? What are the potential risks?

In this webinar, Severalnines Support Engineer Bart Oles will walk you through what you need to know in order to migrate from standalone or a master-slave MySQL/MariaDB setup to Galera Cluster.

Image: 
Agenda: 
  • Application use cases for Galera
  • Schema design
  • Events and Triggers
  • Query design
  • Migrating the schema
  • Load balancer and VIP
  • Loading initial data into the cluster
  • Limitations:
    • Cluster technology
    • Application vendor support
  • Performing Online Migration to Galera
  • Operational management checklist
  • Belts and suspenders: Plan B
  • Demo
Date & Time v2: 
Tuesday, May 29, 2018 - 10:00 to 11:15
Tuesday, May 29, 2018 - 12:00 to 13:15

Getting the Most Out of ClusterControl Community Edition

$
0
0

ClusterControl is an agentless management and monitoring system that helps to deploy, manage, monitor and scale our databases from a friendly interface. It allows us to perform, in a few seconds, database management tasks that would take us hours of work and research to do manually.

It can be easily installed in a dedicated VM or physical host using an installation script or we can consult the official documentation available on the Severalnines web site for more options.

ClusterControl comes in three versions, Community, Advanced and Enterprise.

The main features of each are the following:

ClusterControl Versions Features

To test the system, we provide a trial period of 30 days. During that period, we can make use of all the functionalities that available in the product, such as importing our existing databases or clusters, adding load balancers, scaling with additional nodes, and automatic recovery from failures, among others.

ClusterControl has support for the top open source database technologies MySQL, MariaDB, MongoDB, PostgreSQL, Galera Cluster and more. It supports nearly two dozen database versions, that one can try on premises or in the cloud. This enables you to test which database technology, or which high availability configuration, is the most suitable for your application.

Next, let’s have a detailed look of what we can do with the Community version (after the trial period), at no cost and without time limit.

Deploy

ClusterControl allows you to deploy a number of high availability configurations in the Community Edition. To perform a deployment, simply select the option "Deploy" and follow the instructions that appear.

ClusterControl Deploy Image 1

When selecting Deploy, we must specify User, Key or Password and port to connect by SSH to our servers. We also need the name for our new cluster and if we want ClusterControl to install the corresponding software and configurations for us.

ClusterControl Deploy Image 2

For our example we will create a Galera Cluster with 3 nodes.

ClusterControl Deploy Image 3

After configuring the SSH access information, we must enter the data of our database, such as Vendor, Version, data dir and access to the database.

We can also specify which repository to use and add our servers to the cluster that we are going to create.

When adding our servers, we can enter IP or hostname. For the latter, we must have a DNS server or have added our PostgreSQL servers to the local resolution file (/etc/hosts) of our ClusterControl, so it can resolve the corresponding name that you want to add.

We can monitor the status of the creation of our new cluster from the ClusterControl activity monitor.

ClusterControl Deploy Image 4

Once the task is finished, we can see our cluster in the main ClusterControl screen. Note that it is also possible to use the ClusterControl CLI for those who prefer command line.

ClusterControl
Single Console for Your Entire Database Infrastructure
Find out what else is new in ClusterControl

Monitoring

ClusterControl Community Edition allows us to monitor our servers in real time. It provides us from a high-level, multi-datacenter view to a deep-dive node view. This means that we can see a unified view of all of our deployments across data centers, as well as the possibility to drill down into individual nodes as required. We will have graphs with basic host statistics, such as CPU, Network, Disk, RAM, IOPS, as well as database metrics.

If you go to the Cluster, you can check an overview of it.

ClusterControl Monitoring Overview

If you go to Cluster -> Nodes, you can check the status, graphs, performance, or variables of them.

ClusterControl Monitoring Nodes

You can check your database queries from the Query Monitor in Cluster -> Query Monitor.

ClusterControl Monitoring Queries

Also, you have information about your database performance in Cluster -> Performance.

ClusterControl Monitoring Performance

Using these functionalities we can identify slow or incorrect queries very easily, optimize them, and improve the performance of our systems.

In this way, we can have our cluster fully monitored, without adding additional tools or utilities ,and for free.

Performance Advisors

We have a number of predefined advisors, starting from simple ones like CPU usage, disk space, top queries, to more advanced ones detecting redundant indexes, queries not using indexes that cause table scans, and so on.

We can see the predefined advisors in Cluster -> Performance -> Advisors.

Advisors
Advisors

Here we can see details, disable, enable or edit our Advisors.

Also we can easily configure our own advisors. We can check our custom advisors in Cluster -> Manage -> Custom Advisors.

Custom Advisors
Custom Advisors

Develop custom advisors

We can also create our own advisors using the Developer Studio tool, available in Cluster -> Manage -> Developer Studio.

Developer Studio
Developer Studio

With this tool, you can create your own custom database advisors to monitor specific items to let you know if something goes wrong.

Topology View

To use this feature, you need to go to Cluster -> Topology.

From the Topology view, you can get a visual representation of your cluster, quickly see how they are organized and the health status of each node. This is particularly useful when having e.g., replication setups with multiple masters. You can also detect problems very easily, as each object presents a quick summary of its status.

ClusterControl Topology View

You can also check details about replication and operative system from each node.

Community Support

Finally, for any question or problem that comes our way, we have community support available, where both the Severalnines technicians and the community itself can help us solve our problems.

We also have a number of free resources available, such as blogs, webinars, documentation, or tips and tricks for ClusterControl on our website.

Conclusion

As we saw in this blog, ClusterControl Community Edition gives us the possibility to deploy database clusters and get a real-time view of database status and queries. This can help save time and work in our daily tasks, and is a great way to get started. Do give it a try and let us know what you think. There are other useful features in the commercial edition, such as security, backups, automatic recovery, load balancers and more, that can be activated by upgrading our license.

New Webinar on How to Migrate to Galera Cluster for MySQL & MariaDB

$
0
0

Join us on Tuesday May 29th for this new webinar with Severalnines Support Engineer Bart Oles, who will walk you through what you need to know in order to migrate from standalone or a master-slave MySQL/MariaDB setup to Galera Cluster.

When considering such a migration, plenty of questions typically come up, such as: how do we migrate? Does the schema or application change? What are the limitations? Can a migration be done online, without service interruption? What are the potential risks?

Galera Cluster has become a mainstream option for high availability MySQL and MariaDB. And though it is now known as a credible replacement for traditional MySQL master-slave architectures, it is not a drop-in replacement.

It has some characteristics that make it unsuitable for certain use cases, however, most applications can still be adapted to run on it.

The benefits are clear: multi-master InnoDB setup with built-in failover and read scalability.

Join us on May 29th for this walk-through on how to migrate to Galera Cluster for MySQL and MariaDB.

Sign up below!

Date, Time & Registration

Europe/MEA/APAC

Tuesday, May 29th at 09:00 BST / 10:00 CEST (Germany, France, Sweden)

Register Now

North America/LatAm

Tuesday, May 29th at 09:00 PDT (US) / 12:00 EDT (US)

Register Now

Agenda

  • Application use cases for Galera
  • Schema design
  • Events and Triggers
  • Query design
  • Migrating the schema
  • Load balancer and VIP
  • Loading initial data into the cluster
  • Limitations:
    • Cluster technology
    • Application vendor support
  • Performing Online Migration to Galera
  • Operational management checklist
  • Belts and suspenders: Plan B
  • Demo

Speaker

Bartlomiej Oles is a MySQL and Oracle DBA, with over 15 years experience in managing highly available production systems at IBM, Nordea Bank, Acxiom, Lufthansa, and other Fortune 500 companies. In the past five years, his focus has been on building and applying automation tools to manage multi-datacenter database environments.

We look forward to “seeing” you there and to insightful discussions!


An Overview of the Serial Pseudo-Datatype for PostgreSQL

$
0
0

Introduction

PostgreSQL natively supplies a rich diversity of data types supporting many practical use cases. This article introduces the special implementation of serial data types typically used for creation of synthetic primary keys.

Unique Keys

A foundational precept of database design theory is that each tuple (i.e., row) of a relation (i.e., table) must be uniquely identified from other tuples. The attributes, or columns, that together distinctly identify one tuple from all the others are called a "key". Some purists maintain that any modeled object or concept inherently possesses an attribute or set of attributes that can serve as a key and that it is important to identify this set of key attributes and utilize them for the unique selection of tuples.

But as a practical matter, identifying a sufficiently large set of attributes assurring uniqueness for a modeled object may be impractical, and so for real-world implementations, developers often turn to synthetic keys as a surrogate. That is, rather than relying on some combination of actual attributes, a value internal to the database, typically incremented integer values, and otherwise having no physical meaning is defined as a key. In additional to the simplicity of a single column key, the fact that there is no real-world dependency means that external factors can never force a need to change the value, such as for instance, might be the case if a person's name where used as a key ... and then the person married or entered a federal government witness protection program and changed their name. Even some values commonly thought by laypersons to be unique and immutable, such as the U.S. social security number, are neither: a person can obtain a new SSN, and SSN's sometimes are re-used.

Declaring a Serial Data Type

PostgreSQL provides a special datatype declaration to satisfy this need for synthetic keys. Declaring a database table column as type SERIAL satisfies the requirement for synthetic keys by supplying unique integers upon inserts of new tuples. This pseudo-datatype implements an integer data type column with an associated default value derived via a function call that supplies incremented integer values. Executing the following code to create a simple table with an id column of type serial:

CREATE TABLE person (id serial, full_name text);
actually executes the following DDL
CREATE TABLE person (
    id integer NOT NULL,
    full_name text
);

CREATE SEQUENCE person_id_seq
    START WITH 1
    INCREMENT BY 1
    NO MINVALUE
    NO MAXVALUE
    CACHE 1;
ALTER SEQUENCE person_id_seq OWNED BY person.id;
ALTER TABLE ONLY person
    ALTER COLUMN id
    SET DEFAULT nextval('person_id_seq'::regclass);

That is, the keyword "serial" as a datatype specification implies execution of DDL statements creating an integer type column with a NOT NULL constraint, a SEQUENCE, and then the column default is ALTERED to call a built-in function accessing that SEQUENCE.

The built-in function nextval performs an autoincrement service: each time nextval is called it increments the specified sequence counter and returns the the newly-incremented value.

You can see the result of this effect by examining the table definition:

postgres=# \d person
                   Table "public.person"
  Column   |  Type   |         Modifiers
-----------+---------+-----------------------------------------
 Id        | integer | not null default nextval('person_id_seq'::regclass)
 full_name | text    |

Inserting Serial Values

To make use of the auto-increment functionality, we simply insert rows, relying on the default value for the serial column:

INSERT INTO person (full_name) VALUES ('Alice');
SELECT * FROM person;
 id | full_name
----+-----------
  1 | Alice
(1 row)

We see that a value for the id column corresponding to the new “Alice” row has been automatically generated. Alternatively, one can make use of the DEFAULT keyword if explicitly listing all column names is desired:

INSERT INTO person (id, full_name) VALUES (DEFAULT, 'Bob');
SELECT * FROM person;
 id | full_name
----+-----------
  1 | Alice
  2 | Bob
(2 rows)

where we see the auto-increment functionality more apparently, assigning the serially-next value to the new row for the second insert of “Bob”.

Inserting multiple rows even works:

INSERT INTO person (full_name) VALUES ('Cathy'), ('David');
SELECT * FROM person;
 id | full_name
----+-----------
  1 | Alice
  2 | Bob
  3 | Cathy
  4 | David
(4 rows)
ClusterControl
Single Console for Your Entire Database Infrastructure
Find out what else is new in ClusterControl

Missing Serial Values

The built-in nextval function is optimized for non-blocking, high-concurrency applications and so does not respect rollback. Consequently, this means there may be missing values in the sequence. Below, we rollback an insert, but then see a subsequent insert gets an new value that skips over the value that would have been associated with the aborted transaction:

BEGIN TRANSACTION;
INSERT INTO person (full_name) VALUES ('Eve');
SELECT * FROM person;
 id | full_name
----+-----------
  1 | Alice
  2 | Bob
  3 | Cathy
  4 | David
  5 | Eve
(5 rows)
ROLLBACK;
INSERT INTO person (full_name) VALUES ('Fred');
SELECT * FROM person;
 id | full_name
----+-----------
  1 | Alice
  2 | Bob
  3 | Cathy
  4 | David
  6 | Fred
(5 rows)

The advantage of not respecting rollbacks is that other sessions attempting concurrent inserts are not blocked by other inserting sessions.

Another way to end up with missing values is if rows are deleted:

DELETE FROM person WHERE full_name = 'Cathy';
SELECT * FROM person;
 id | full_name
----+-----------
  1 | Alice
  2 | Bob
  4 | David
  6 | Fred
(4 rows)

Note that even after deleting the most recently inserted row corresponding to the largest auto-increment id column value, the sequence counter does not revert, i.e., even though after deleting the row corresponding to 'Fred', for subsequent inserts the sequence counter still retains the previously-known largest value and increments from there:

DELETE FROM person WHERE full_name = 'Fred';
INSERT INTO person (full_name) VALUES ('Gina');
SELECT * FROM person;
 id | full_name
----+-----------
  1 | Alice
  2 | Bob
  4 | David
  7 | Gina
(4 rows)

Gaps or missing values as shown above are reportedly viewed as a problem by some application developers because on the PostgreSQL General mailing list, there is a slow-but-steady reiteration of the question how to avoid sequence gaps when employing the serial pseudo-datatype. Sometimes there is no actual underlying business requirement, it's just matter of personal aversion to missing values. But there are circumstances when preventing missing numbers is a real need, and that is the subject for a subsequent article.

NO YOU CAN'T - YES YOU CAN!

The NOT NULL constraint imputed by the serial pseudo-datatype protects against the insertion of NULL for the id column by rejecting such insert attempts:

INSERT INTO person (id, full_name) VALUES (NULL, 'Henry');
ERROR:  null value in column "id" violates not-null constraint
DETAIL:  Failing row contains (null, Henry).

Thus, we are assured of having a value for that attribute.

However, a problem some people encounter is that, as declared above, nothing prevents explicit insertion of values, bypassing the default autoincrement value derived via invocation of the nextval function:

INSERT INTO person (id, full_name) VALUES (9, 'Ingrid');
SELECT * FROM person;
 id | full_name
----+-----------
  1 | Alice
  2 | Bob
  4 | David
  7 | Gina
  9 | Ingrid
(5 rows)

But then two inserts later using the default produces a duplicate value for the id column if there is no constraint check of column values against the sequence value:

INSERT INTO person (full_name) VALUES ('James');
INSERT INTO person (full_name) VALUES ('Karen');
SELECT * FROM person;
 id | full_name
----+-----------
  1 | Alice
  2 | Bob
  4 | David
  7 | Gina
  9 | Ingrid
  8 | James
  9 | Karen
(7 rows)

If we were in fact using the serial id column as a key, we would have declared it as a PRIMARY KEY or at least created a UNIQUE INDEX. Had we done that, then the 'Karen' insert above would have failed with a duplicate key error. The most recent release of PostgreSQL includes a new constraint declaration syntax 'generated by default as identity' which avoids this pitfall and some other legacy issues related to the serial pseudo-datatype.

Sequence Manipulation Functions

In addition to the nextval function we already mentioned which advances the sequence and returns the new value, there are a few other functions for querying and setting the sequence values: the currval function returns value most recently obtained with nextval for specified sequence, the lastval function returns value most recently obtained with nextval for any sequence, and the setval function sets a sequence's current value. These functions are called with simple queries., for example

SELECT currval('person_id_seq');
 currval
---------
       9
(1 row)

And note that if a call is made to the nextval function independently of actually performing an insert, it does increment the sequence, and that will be reflected in subsequent inserts:

SELECT nextval('person_id_seq');
 nextval
---------
      10
(1 row)
INSERT INTO person (full_name) VALUES ('Larry');
SELECT * FROM person;
 id | full_name
----+-----------
  1 | Alice
  2 | Bob
  4 | David
  7 | Gina
  9 | Ingrid
  8 | James
  9 | Karen
 11 | Larry
(8 rows)

Conclusion

We have introduced a basic understanding of the PostgreSQL SERIAL pseudo-datatype for auto-incremented synthetic keys. For illustration in this article, we used the SERIAL type declaration, which creates a 4-byte integer column. PostgreSQL accommodates different range needs with the SMALLSERIAL and BIGSERIAL pseudo-datatypes for, respectively, 2-byte and 8-byte column sizes. Look for a future article on one means of addressing the need for sequences with no missing values.

Deploying Cloud Databases with ClusterControl 1.6

$
0
0

ClusterControl 1.6 comes with tighter integration with AWS, Azure and Google Cloud, so it is now possible to launch new instances and deploy MySQL, MariaDB, MongoDB and PostgreSQL directly from the ClusterControl user interface. In this blog, we will show you how to deploy a cluster on Amazon Web Services.

Note that this new feature requires two modules called clustercontrol-cloud and clustercontrol-clud. The former is a helper daemon which extends CMON capability of cloud communication, while the latter is a file manager client to upload and download files on cloud instances. Both packages are dependencies of the clustercontrol UI package, which will be installed automatically if they do not exist. See the Components documentation page for details.

Cloud Credentials

ClusterControl allows you to store and manage your cloud credentials under Integrations (side menu) -> Cloud Providers:

The supported cloud platforms in this release are Amazon Web Services, Google Cloud Platform and Microsoft Azure. On this page, you can add new cloud credentials, manage existing ones and also connect to your cloud platform to manage resources.

The credentials that have been set up here can be used to:

  • Manage cloud resources
  • Deploy databases in the cloud
  • Upload backup to cloud storage

The following is what you would see if you clicked on "Manage AWS" button:

You can perform simple management tasks on your cloud instances. You can also check the VPC settings under "AWS VPC" tab, as shown in the following screenshot:

The above features are useful as reference, especially when preparing your cloud instances before you start the database deployments.

Database Deployment on Cloud

In previous versions of ClusterControl, database deployment on cloud would be treated similarly to deployment on standard hosts, where you had to create the cloud instances beforehand and then supply the instance details and credentials in the "Deploy Database Cluster" wizard. The deployment procedure was unaware of any extra functionality and flexibility in the cloud environment, like dynamic IP and hostname allocation, NAT-ed public IP address, storage elasticity, virtual private cloud network configuration and so on.

With version 1.6, you just need to supply the cloud credentials, which can be managed via the "Cloud Providers" interface and follow the "Deploy in the Cloud" deployment wizard. From ClusterControl UI, click Deploy and you will be presented with the following options:

At the moment, the supported cloud providers are the three big players - Amazon Web Service (AWS), Google Cloud and Microsoft Azure. We are going to integrate more providers in the future release.

In the first page, you will be presented with the Cluster Details options:

In this section, you would need to select the supported cluster type, MySQL Galera Cluster, MongoDB Replica Set or PostgreSQL Streaming Replication. The next step is to choose the supported vendor for the selected cluster type. At the moment, the following vendors and versions are supported:

  • MySQL Galera Cluster - Percona XtraDB Cluster 5.7, MariaDB 10.2
  • MongoDB Cluster - MongoDB 3.4 by MongoDB, Inc and Percona Server for MongoDB 3.4 by Percona (replica set only).
  • PostgreSQL Cluster - PostgreSQL 10.0 (streaming replication only).

In the next step, you will be presented with the following dialog:

Here you can configure the selected cluster type accordingly. Pick the number of nodes. The Cluster Name will be used as the instance tag, so you can easily recognize this deployment in your cloud provider dashboard. No space is allowed in the cluster name. My.cnf Template is the template configuration file that ClusterControl will use to deploy the cluster. It must be located under /usr/share/cmon/templates on the ClusterControl host. The rest of the fields are pretty self-explanatory.

The next dialog is to select the cloud credentials:

You can choose the existing cloud credentials or create a new one by clicking on the "Add New Credential" button. The next step is to choose the virtual machine configuration:

Most of the settings in this step are dynamically populated from the cloud provider by the chosen credentials. You can configure the operating system, instance size, VPC setting, storage type and size and also specify the SSH key location on the ClusterControl host. You can also let ClusterControl generate a new key specifically for these instances. When clicking on "Add New" button next to Virtual Private Cloud, you will be presented with a form to create a new VPC:

VPC is a logical network infrastructure you have within your cloud platform. You can configure your VPC by modifying its IP address range, create subnets, configure route tables, network gateways, and security settings. It's recommended to deploy your database infrastructure in this network for isolation, security and routing control.

When creating a new VPC, specify the VPC name and IPv4 address block with subnet. Then, choose whether IPv6 should be part of the network and the tenancy option. You can then use this virtual network for your database infrastructure.

ClusterControl
Single Console for Your Entire Database Infrastructure
Find out what else is new in ClusterControl

The last step is the deployment summary:

In this stage, you need to choose which subnet under the chosen virtual network that you want the database to be running on. Take note that the chosen subnet MUST have auto-assign public IPv4 address enabled. You can also create a new subnet under this VPC by clicking on "Add New Subnet" button. Verify if everything is correct and hit the "Deploy Cluster" button to start the deployment.

You can then monitor the progress by clicking on the Activity -> Jobs -> Create Cluster -> Full Job Details:

Depending on the connections, it could take 10 to 20 minutes to complete. Once done, you will see a new database cluster listed under the ClusterControl dashboard. For PostgreSQL streaming replication cluster, you might need to know the master and slave IP addresses once the deployment completes. Simply go to Nodes tab and you would see the public and private IP addresses on the node list on the left:

Your database cluster is now deployed and running on AWS.

At the moment, the scaling up works similar to the standard host, where you need to create a cloud instance manually beforehand and specify the host under ClusterControl -> pick the cluster -> Add Node.

Under the hood, the deployment process does the following:

  1. Create cloud instances
  2. Configure security groups and networking
  3. Verify the SSH connectivity from ClusterControl to all created instances
  4. Deploy database on every instance
  5. Configure the clustering or replication links
  6. Register the deployment into ClusterControl

Take note that this feature is still in beta. Nevertheless, you can use this feature to speed up your development and testing environment by controlling and managing the database cluster in different cloud providers from a single user interface.

Database Backup on Cloud

This feature has been around since ClusterControl 1.5.0, and now we added support for Azure Cloud Storage. This means that you can now upload and download the created backup on all three major cloud providers (AWS, GCP and Azure). The upload process happens right after the backup is successfully created (if you toggle "Upload Backup to the Cloud") or you can manually click on the cloud icon button of the backup list:

You can then download and restore backups from the cloud, in case you lost your local backup storage, or if you need to reduce local disk space usage for your backups.

Current Limitations

There are some known limitations for the cloud deployment feature, as stated below:

  • There is currently no 'accounting' in place for the cloud instances. You will need to manually remove the cloud instances if you remove a database cluster.
  • You cannot add or remove a node automatically with cloud instances.
  • You cannot deploy a load balancer automatically with a cloud instance.

We have extensively tested the feature in many environments and setups but there are always corner cases that we might have missed out upon. For more information, please take a look at the change log.

Happy clustering in the cloud!

My MySQL Database is Corrupted... What Do I Do Now?

$
0
0

How do MySQL tables get corrupted? There are many ways to spoil data files. Often, corruption is due to defects in the underlying platform, which MySQL relies on to store and retrieve data - disk subsystem, controllers, communication channels, drivers, firmware or other hardware faults. Data corruption can also occur if the MySQL server daemon restarts suddenly, or your server reboots due to a crash of other OS components. If the database instance was in the middle of writing data to disk, it could write the data partially which may end up with a page checksum that is different than expected. There have also been bugs in MySQL so even if the server hardware is ok, MySQL itself can cause corruption.

Usually when MySQL data gets corrupted the recommendation is to restore it from the last backup, switch to DR server or take down the affected node if you have Galera cluster to serve data immediately from other nodes. In some cases you can't - if the backup is not there, the cluster was never set up, your replication is down for a very long time, or the DR procedure was never tested. Even if you have a backup, you may still want to take some actions to attempt recovery as it may take less time get back online.

MyISAM, the bad and ugly

InnoDB is more fault-tolerant than MyISAM. InnoDB has auto_recovery features and is much safer as compared to the older MyISAM engine.

MyISAM tables can easily get corrupted when lots of writes happen and a lot of locks happen on that table. The storage engine "writes" data to the filesystem cache, which may take some time before it is flushed to disk. Therefore if your server restarts suddenly, some unknown amount of data in the cache is lost. That's a usual way for MyISAM data to be corrupted. The recommendation is to migrate from MyISAM to InnoDB, but there may be cases where this is not possible.

Primum non nocere, the backup

Before you attempt to repair corrupted tables, you should back your database files first. Yes, it’s already broken but this is to minimize the risk of possible further damage which may be caused by a recovery operation. There is no guarantee that any action you take will not harm untouched data blocks. Forcing InnoDB recovery with values greater than 4 can corrupt data files, so make sure you will do it with prior backup and ideally on a separate physical copy of the database.

To back up all of the files from all of your databases, follow these steps:

Stop the MySQL server

service mysqld stop

Type the following command for your datadir.

cp -r /var/lib/mysql /var/lib/mysql_bkp

After we have a backup copy of the data directory, we are ready to start troubleshooting.

Data corruption identification

The error log is your best friend. Usually, when data corruption happens, you will find relevant information (including links to documentation) in the error log. If you don't know where it's located, check my.cnf and variable log_error, for more details check this article https://dev.mysql.com/doc/refman/8.0/en/error-log-destination-configuration.html. What you should also know is your storage engine type. You can find this information in the error log or in information_schema.

mysql> select table_name,engine from information_schema.tables where table_name = '<TABLE>' and table_schema = '<DATABASE>';

The main tools/commands to diagnose issues with data corruption are CHECK TABLE, REPAIR TABLE, and myisamchk. The mysqlcheck client performs table maintenance: It checks, repairs (MyISAM), optimizes or analyzes tables while MySQL is running.

mysqlcheck -uroot -p <DATABASE>

Replace DATABASE with the name of the database, and replace TABLE with the name of the table that you want to check:

mysqlcheck -uroot -p <DATABASE> <TABLE>

Mysqlcheck checks the specified database and tables. If a table passes the check, mysqlcheck displays OK for the table.

employees.departments                              OK
employees.dept_emp                                 OK
employees.dept_manager                             OK
employees.employees                                OK
Employees.salaries
Warning  : Tablespace is missing for table 'employees/salaries'
Error    : Table 'employees.salaries' doesn't exist in engine
status   : Operation failed
employees.titles                                   OK

Data corruption issues may be also related to permission issues. In some cases, OS can switch mount point to read-only mode due to R/W issues or this can be caused by a user who accidentally changed ownership of the data files. In such cases, you will find relevant information in the error log.

[root@node1 employees]# ls -rtla
...
-rw-rw----. 1 mysql mysql  28311552 05-10 06:24 titles.ibd
-rw-r-----. 1 root  root  109051904 05-10 07:09 salaries.ibd
drwxr-xr-x. 7 mysql mysql      4096 05-10 07:12 ..
drwx------. 2 mysql mysql      4096 05-10 07:17 .

MySQL Client

MariaDB [employees]> select count(*) from salaries;
ERROR 1932 (42S02): Table 'employees.salaries' doesn't exist in engine

Error log entry

2018-05-10  9:15:38 140703666226944 [ERROR] InnoDB: Failed to find tablespace for table `employees`.`salaries` in the cache. Attempting to load the tablespace with space id 9
2018-05-10  9:15:38 140703666226944 [ERROR] InnoDB: Operating system error number 13 in a file operation.
2018-05-10  9:15:38 140703666226944 [ERROR] InnoDB: The error means mysqld does not have the access rights to the directory.
2018-05-10  9:15:38 140703666226944 [ERROR] InnoDB: Cannot open datafile for read-only: './employees/salaries.ibd' OS error: 81
2018-05-10  9:15:38 140703666226944 [ERROR] InnoDB: Operating system error number 13 in a file operation.
2018-05-10  9:15:38 140703666226944 [ERROR] InnoDB: The error means mysqld does not have the access rights to the directory.
2018-05-10  9:15:38 140703666226944 [ERROR] InnoDB: Could not find a valid tablespace file for `employees/salaries`. Please refer to http://dev.mysql.com/doc/refman/5.7/en/innodb-troubleshooting-datadict.html for how to resolve the issue.
ClusterControl
Single Console for Your Entire Database Infrastructure
Find out what else is new in ClusterControl

Recovering InnoDB table

If you are using the InnoDB storage engine for a database table, you can run the InnoDB recovery process.
To enable auto recovery MySQL needs innodb_force_recovery option to be enabled. Innodb_force_recovery forces InnoDB to start up while preventing background operations from running, so that you can dump your tables.

To do this open my.cnf and add the following line to the [mysqld] section:

[mysqld]
innodb_force_recovery=1
service mysql restart

You should start from innodb_force_recovery=1 save the changes to my.cnf file, and then restart the MySQL server using the appropriate command for your operating system. If you are able to dump your tables with an innodb_force_recovery value of 3 or less, then you are relatively safe. In many cases you will have to go up to 4 and as you already know that can corrupt data.

[mysqld]
innodb_force_recovery=1
service mysql restart

If needed change to the higher value, six is the maximum and most dangerous.

Once you are able to start your database, type the following command to export all of the databases to the databases.sql file:

mysqldump --all-databases --add-drop-database --add-drop-table > dump.sql

Start mysql, and then try to drop the affected database or databases using the DROP DATABASE command. If MySQL is unable to drop a database, you can delete it manually using the steps below after you stop the MySQL server.

service mysqld stop

If you were unable to drop a database, type the following commands to delete it manually.

cd /var/lib/mysql
rm -rf <DATABASE>

Make sure you do not delete the internal database directories.
After you are done, comment out the following line in the [mysqld] to disable InnoDB recovery mode.

#innodb_force_recovery=...

Save the changes to the my.cnf file, and then start the MySQL server

service mysqld start

Type the following command to restore the databases from the backup file you created in step 5:

mysql> tee import_database.log
mysql> source dump.sql

Repairing MyISAM

If mysqlcheck reports an error for a table, type the mysqlcheck command with -repair flag to fix it. The mysqlcheck repair option works while the server is up and running.

mysqlcheck -uroot -p -r <DATABASE> <TABLE>

If the server is down and for any reason mysqlcheck cannot repair your table, you still have an option to perform recovery directly on files using myisamchk. With myisamchk, you need to make sure that the server doesn't have the tables open.

Stop the MySQL

service mysqld stop
cd /var/lib/mysql

Change to the directory where the database is located.

cd /var/lib/mysql/employees
myisamchk <TABLE>

To check all of the tables in a database, type the following command:

myisamchk *.MYI

If the previous command does not work, you can try deleting temporary files that may be preventing myisamchk from running correctly. To do this, change back to the data dir directory, and then run the following command:

ls */*.TMD

If there are any .TMD files listed, delete them:

rm */*.TMD

Then re-run myisamchk.

To attempt repair a table, execute the following command, replacing TABLE with the name of the table that you want to repair:

myisamchk --recover <TABLE>

Restart the MySQL server

service mysqld start

How to avoid data loss

There are several things you can do to minimize the risk of unrecoverable data. First of all backups. The problem with backups is that sometimes they can be overlooked. For cron scheduled backups, usually we write wrapper scripts that detect problems in the backup log, but that does not include cases when the backup didn’t start at all. Cron can sometimes hang and often there is no monitoring set on it. Another potential issue could be the case when the backup was never set up. The good practice is to run reports from a separate tool that will analyze the backup status and inform you about missing backups schedules. You can use ClusterControl for that or write your own programs.

ClusterControl operational backup report

To reduce the impact of the possible data corruption you should always consider clustered systems. It’s just a matter of time when the database will crash or get corrupted, so it’s good to have a copy which you can switch to. It could be Master / Slave replication. The important aspect here is to have safe automatic recovery to minimize the complexity of the switchover and minimize the recovery time (RTO).

ClusterControl auto recovery features

A Guide to PGpool Part Three - Hints & Observations

$
0
0

In the previous part I dared to play with a not implemented feature fantasising how would it work. Well HA in first place is a matter of design and only then implementation. It does not excuse bad implementation, neither it makes naive designing look smart. Yet after you cover all possible scenarios and found an adequate best rule for most cases, sometimes a very primitive small change can ruin the stronghold. Below I want to sandbox.

What Happens When pgpool Should Failover, But Can’t?

When health check fails for the master, the failover_command fired to degenerate all or promote next slave to primary. Sounds solid. What if it fails itself, eg ssh connection fails (e.g. because other - bad admin remove key from ~/.ssh/authorized_keys). What we have?

As soon as health_check_timeout (default 20) is out (also affected by retry delay, max retires and so on) the node turns dead, so:

t=# select nid,port,st from dblink('host=localhost port=5433','show pool_nodes') as t (nid int,hostname text,port int,st text,lb_weight float,role text,cnt int,cur_node text,del int);
 nid | port |  st
-----+------+------
   0 | 5400 | down
   1 | 5401 | up
   2 | 5402 | up
(3 rows)

So no retries left and the failover failed. The first option obviously is doing failover manually. But if failover failed because of some stupid error, master is back on rails, and the only problem you have is pgpool thinking the master is offline - you would probably want to leave things as they used to be before the accident instead - right? Of course just moving master back online is not enough. Pgpool already “degenerated” the primary. Just adding it as a new node will not help either. The worst thing is that, after the event, pgpool will not try to check whether the old master is pg_is_in_recovery() or not, thus will never accept it as Primary. According to bug track you have to “Discard pgpool_status file and do not restore previous status” with pgpool -D command.

After discarding the status, we reconnect to avoid seeing server closed the connection unexpectedly and run:

t=# select nid,port,st,role from dblink('host=localhost port=5433','show pool_nodes') as t (nid int,hostname text,port int,st text,lb_weight float,role text,cnt int,cur_node text,del int);
 nid | port | st |  role
-----+------+----+---------
   0 | 5400 | up | primary
   1 | 5401 | up | standby
   2 | 5402 | up | standby
(3 rows)

All nodes are back up and running, pgpool recognises the master.

Finally I want to cover some hints and observations on using pgpool:

  • Changing backend settings is a little tricky: hostname, port and directory require reload for adding new nodes, but require restart for editing existing. While weight and flag can be altered with just reload.

  • Don’t confuse load_balance_node columnvalues with configuration. If you see just one node with true it’s not just OK - it’s meant so. It does not mean you have only one node in balancing pool - it just shows which node is chosen for this particular session. Below is query result with all three nodes participating in SELECT statements balancing, with node id 2 chosen:

    t=# show pool_nodes;
     node_id | hostname  | port | status | lb_weight |  role   | select_cnt | load_balance_node | replication_delay
    ---------+-----------+------+--------+-----------+---------+------------+-------------------+-------------------
     0       | localhost | 5400 | up     | 0.125000  | primary | 61         | false             | 0
     1       | localhost | 5401 | up     | 0.312500  | standby | 8          | false             | 0
     2       | localhost | 5402 | up     | 0.562500  | standby | 11         | true              | 0
    (3 rows)
  • You can check which node was chosen for load balancing with show pool_nodes, but you care to know it for your query, not the “show” one, so such check is not always informative enough. Well you can monitor which node you use for the current query, with something like:

    t=# select *,current_setting('port') from now();
                  now              | current_setting
    -------------------------------+-----------------
     2018-04-09 13:56:17.501779+01 | 5401
    (1 row)

Important! But not:

t=# select now, setting from now() join pg_settings on name='port';
             now             | setting
-----------------------------+---------
 2018-04-09 13:57:17.5229+01 | 5400
(1 row)

As it will ALWAYS return master’s port. Same applies for any pg_catalog SELECT.

  • As you noticed in previous parts, I use more complicated way, than just show pool_nodes to list nodes with state. I do it deliberately to demonstrate how you can make the result manageable. Using where makes the query longer, but the result clear, skipping all that distracts attention for our particular task. Compare:

t=# select nid,port,st,role from dblink('host=localhost port=5433','show pool_nodes') as t (nid int,hostname text,port int,st text,lb_weight float,role text,cnt int,cur_node text,del int);
 nid | port | st |  role
-----+------+----+---------
   0 | 5400 | up | primary
   1 | 5401 | up | standby
   2 | 5402 | up | standby

With the output of initial show pool_nodes...

  • You can’t compare pgbouncer and pgpool. But if you do, most important to know that parsing queries in pgpool depends on pg version. So when upgrading postgreSQL, you need to upgrade pgpool as well, while one pgbouncer instance can have config for 8,9,10 different clusters in the same ini file.

  • Why can’t I use just a failover script instead of pgpool? You can. But pgpool offers it ALONG with memcached and connection pooling and balancing and split brain control and is checked by decades of usage.

  • Bug Tracking system is in place - worth of visiting it if you work with pgpool: https://www.pgpool.net/mantisbt/my_view_page.php

  • Numerous typos in documentation, like bakance (backend + balance?..), statemnet, allowd or mismatch across version (pool_nodes used to be int and now are enum, but link to old values in pcp_node-info is still there) spoils the impression on this wonderful product. A form to send the report on found “bug” in documentation (just like “submit correction” on postgres docs) would greatly improve it though.

  • Important tip: before relying on any step - check it. E.g. after promoting node you can’t repromote it (here promoting is not postgres operation, but rather registration of the node as master for pgpool):

    root@u:~# sudo -u postgres pcp_promote_node -w -h 127.0.0.1 -U vao -n 1
    pcp_promote_node -- Command Successful
    root@u:~# sudo -u postgres pcp_promote_node -w -h 127.0.0.1 -U vao -n 1
    FATAL:  invalid pgpool mode for process recovery request
    DETAIL:  specified node is already primary node, can't promote node id 1

Sounds logic and looks great. Yet, if you run this against wrong node (eg, node 0 is ! pg_is_in_recovery):

root@u:~# for i in $(seq 1 3); do pcp_promote_node -w -h 127.0.0.1 -U vao -n 0; echo $?; done
pcp_promote_node -- Command Successful
0
pcp_promote_node -- Command Successful
0
pcp_promote_node -- Command Successful
0

Which is bad because you can’t repromote node and expect an error, but you get exit status 0…

ClusterControl
Single Console for Your Entire Database Infrastructure
Find out what else is new in ClusterControl

Important tip: Don’t play too much. Never play on prod!

Playing with recovery_1st_stage_command using pg_rewind, I thought to try out of curiosity another monkey hack - querying pgpool_recovery() without arguments (as I ignore them in my set up anyway) and then just trying to attach the node to pgpool:

root@u:~# psql -p 5433 -h localhost template1 -c "SELECT pgpool_recovery('or_1st.sh', '', '', '')"
 pgpool_recovery
-----------------
 t
(1 row)

root@u:~# pcp_attach_node -h 127.0.0.1 -U vao -w -n 1
pcp_attach_node -- Command Successful

This stupid idea brought me to:

root@u:~# ps -aef | grep pgpool
postgres 15227     1  0 11:22 ?        00:00:00 pgpool -D
postgres 15240 15227  0 11:22 ?        00:00:00 pgpool: health check process(0)
postgres 15241 15227  0 11:22 ?        00:00:00 pgpool: health check process(1)
postgres 15242 15227  0 11:22 ?        00:00:00 pgpool: health check process(2)
postgres 15648 15227  0 11:24 ?        00:00:00 [pgpool] <defunct>
postgres 16264 15227  0 11:26 ?        00:00:00 pgpool: PCP: wait for connection request
postgres 16266 15227  0 11:26 ?        00:00:00 [pgpool] <defunct>
postgres 16506 16264  0 11:26 ?        00:00:00 pgpool: PCP: processing recovery request
postgres 16560 15227  0 11:26 ?        00:00:00 [pgpool] <defunct>
postgres 16835 15227  0 11:26 ?        00:00:00 [pgpool] <defunct>
postgres 16836 15227  0 11:26 ?        00:00:00 [pgpool] <defunct>

No escape I have to:

root@u:~# kill -9 
root@u:~# rm /var/run/pgpoolql/.s.PGSQL.5433
root@u:~# rm /var/run/pgpoolql/.s.PGSQL.9898

Above 5433 is pgpool port and 9898 is pcp port. Obviously after crash, files are not swept, so you have to do it manually.

  • Do a careful reading and play a lot before taking pgpool to production. It’s much harder to find help with pgpool then postgres itself. Some questions are never answered. Especially when asked in wrong place (I answered it based on right place to get the answer)...
  • Don’t forget the latest timeline for cascading replication (not really the pgpool hint, but often people don’t understand that in order to pickup a new master it is not enough to specify a right endpoint for receiver).
  • Architecture with diagram could be found here.

Conclusion

In 10 years new promising features (watchdog and virtual ip) and important fixes (eg serialize_accept) appeared, but overall it leaves a undervalued impression. Docs have typos that have lived there for 10 years. I don't believe no-one reads the docs. I don’t believe no one noticed. You just can't report them in any easy way. There are plenty of guns loaded and prepared, lying on the documentation site for the novice user to take, point against the foot and pull the trigger. I have no reasonable idea how to improve it - I’m just warning the shooters. Misinterpreting one parameter can throw you in a desperate position of reverse engineering to find your mistake. All these years pgpool used to be and remains kind of a product for advanced users. Reading documentation I could not help myself not recalling the old Russian joke about Sherlock Holmes: Sherlock and Watson fly on the balloon. Suddenly the strong wind blows them thousands miles away. When they can land, they see the girl grazing sheep. Holmes asks the girl: “Darling where are we?” and the girl replies “You are on the balloon!”. Sherlock thanks and as they take off says “The wind took us very far - we are in Russia”. “But how do you know?” Watson asks. “It’s obvious - only in Russia coders graze sheep” Sherlock replies. “But how do you know the girl is coder?” - “It’s obvious - she gave us absolutely precise and totally useless answer”.

Updated: Become a ClusterControl DBA: Safeguarding your Data

$
0
0

In the past four posts of the blog series, we covered deployment of clustering/replication (MySQL/Galera, MySQL Replication, MongoDB & PostgreSQL), management & monitoring of your existing databases and clusters, performance monitoring and health and in the last post, how to make your setup highly available through HAProxy and ProxySQL.

So now that you have your databases up and running and highly available, how do you ensure that you have backups of your data?

You can use backups for multiple things: disaster recovery, to provide production data to test against development or even to provision a slave node. This last case is already covered by ClusterControl. When you add a new (replica) node to your replication setup, ClusterControl will make a backup/snapshot of the master node and use it to build the replica. It can also use an existing backup to stage the replica, in case you want to avoid that extra load on the master. After the backup has been extracted, prepared and the database is up and running, ClusterControl will automatically set up replication.

Creating an Instant Backup

In essence, creating a backup is the same for Galera, MySQL replication, PostgreSQL and MongoDB. You can find the backup section under ClusterControl > Backup and by default you would see a list of created backup of the cluster (if any). Otherwise, you would see a placeholder to create a backup:

From here you can click on the "Create Backup" button to make an instant backup or schedule a new backup:

All created backups can also be uploaded to cloud by toggling "Upload Backup to the Cloud", provided you supply working cloud credentials. By default, all backups older than 31 days will be deleted (configurable via Backup Retention settings) or you can choose to keep it forever or define a custom period.

"Create Backup" and "Schedule Backup" share similar options except the scheduling part and incremental backup options for the latter. Therefore, we are going to look into Create Backup feature (a.k.a instant backup) in more depth.

As all these various databases have different backup tools, there is obviously some difference in the options you can choose. For instance with MySQL you get to choose between mysqldump and xtrabackup (full and incremental). For MongoDB, ClusterControl supports mongodump and mongodb-consistent-backup (beta) while PostgreSQL, pg_dump and pg_basebackup are supported. If in doubt which one to choose for MySQL, check out this blog about the differences and use cases for mysqldump and xtrabackup.

Backing up MySQL and Galera

As mentioned in the previous paragraph, you can make MySQL backups using either mysqldump or xtrabackup (full or incremental). In the "Create Backup" wizard, you can choose which host you want to run the backup on, the location where you want to store the backup files, and its directory and specific schemas (xtrabackup) or schemas and tables (mysqldump).

If the node you are backing up is receiving (production) traffic, and you are afraid the extra disk writes will become intrusive, it is advised to send the backups to the ClusterControl host by choosing "Store on Controller" option. This will cause the backup to stream the files over the network to the ClusterControl host and you have to make sure there is enough space available on this node and the streaming port is opened on the ClusterControl host.

There are also several other options whether you would want to use compression and the compression level. The higher the compression level is, the smaller the backup size will be. However, it requires higher CPU usage for the compression and decompression process.

If you would choose xtrabackup as the method for the backup, it would open up extra options: desync, backup locks, compression and xtrabackup parallel threads/gzip. The desync option is only applicable to desync a node from a Galera cluster. Backup locks uses a new MDL lock type to block updates to non-transactional tables and DDL statements for all tables which is more efficient for InnoDB-specific workload. If you are running on Galera Cluster, enabling this option is recommended.

After scheduling an instant backup you can keep track of the progress of the backup job in the Activity > Jobs:

After it has finished, you should be able to see the a new entry under the backup list.

Backing up PostgreSQL

Similar to the instant backups of MySQL, you can run a backup on your Postgres database. With Postgres backups there are two backup methods supported - pg_dumpall or pg_basebackup. Take note that ClusterControl will always perform a full backup regardless of the chosen backup method.

We have covered this aspect in this details in Become a PostgreSQL DBA - Logical & Physical PostgreSQL Backups.

Backing up MongoDB

For MongoDB, ClusterControl supports the standard mongodump and mongodb-consistent-backup developed by Percona. The latter is still in beta version which provides cluster-consistent point-in-time backups of MongoDB suitable for sharded cluster setups. As the sharded MongoDB cluster consists of multiple replica sets, a config replica set and shard servers, it is very difficult to make a consistent backup using only mongodump.

Note that in the wizard, you don't have to pick a database node to be backed up. ClusterControl will automatically pick the healthiest secondary replica as the backup node. Otherwise, the primary will be selected. When the backup is running, the selected backup node will be locked until the backup process completes.

Scheduling Backups

Now that we have played around with creating instant backups, we now can extend that by scheduling the backups.

The scheduling is very easy to do: you can select on which days the backup has to be made and at what time it needs to run.

For xtrabackup there is an additional feature: incremental backups. An incremental backup will only backup the data that changed since the last backup. Of course, the incremental backups are useless if there would not be full backup as a starting point. Between two full backups, you can have as many incremental backups as you like. But restoring them will take longer.

Once scheduled the job(s) should become visible under the "Scheduled Backup" tab and you can edit them by clicking on the "Edit" button. Like with the instant backups, these jobs will schedule the creation of a backup and you can keep track of the progress via the Activity tab.

Backup List

You can find the Backup List under ClusterControl > Backup and this will give you a cluster level overview of all backups made. Clicking on each entry will expand the row and expose more information about the backup:

Each backup is accompanied with a backup log when ClusterControl executed the job, which is available under "More Actions" button.

Offsite Backup in Cloud

Since we have now a lot of backups stored on either the database hosts or the ClusterControl host, we also want to ensure they don’t get lost in case we face a total infrastructure outage. (e.g. DC on fire or flooded) Therefore ClusterControl allows you to store or copy your backups offsite on cloud. The supported cloud platforms are Amazon S3, Google Cloud Storage and Azure Cloud Storage.

The upload process happens right after the backup is successfully created (if you toggle "Upload Backup to the Cloud") or you can manually click on the cloud icon button of the backup list:

Choose the cloud credential and specify the backup location accordingly:

Restore and/or Verify Backup

From the Backup List interface, you can directly restore a backup to a host in the cluster by clicking on the "Restore" button for the particular backup or click on the "Restore Backup" button:

One nice feature is that it is able to restore a node or cluster using the full and incremental backups as it will keep track of the last full backup made and start the incremental backup from there. Then it will group a full backup together with all incremental backups till the next full backup. This allows you to restore starting from the full backup and applying the incremental backups on top of it.

ClusterControl supports restore on an existing database node or restore and verify on a new standalone host:

These two options are pretty similar, except the verify one has extra options for the new host information. If you follow the restoration wizard, you will need to specify a new host. If "Install Database Software" is enabled, ClusterControl will remove any existing MySQL installation on the target host and reinstall the database software with the same version as the existing MySQL server.

Once the backup is restored and verified, you will receive a notification on the restoration status and the node will be shut down automatically.

Point-in-Time Recovery

For MySQL, both xtrabackup and mysqldump can be used to perform point-in-time recovery and also to provision a new replication slave for master-slave replication or Galera Cluster. A mysqldump PITR-compatible backup contains one single dump file, with GTID info, binlog file and position. Thus, only the database node that produces binary log will have the "PITR compatible" option available:

When PITR compatible option is toggled, the database and table fields are greyed out since ClusterControl will always perform a full backup against all databases, events, triggers and routines of the target MySQL server.

Now restoring the backup. If the backup is compatible with PITR, an option will be presented to perform a Point-In-Time Recovery. You will have two options for that - “Time Based” and “Position Based”. For “Time Based”, you can just pass the day and time. For “Position Based”, you can pass the exact position to where you want to restore. It is a more precise way to restore, although you might need to get the binlog position using the mysqlbinlog utility. More details about point in time recovery can be found in this blog.

Backup Encryption

Universally, ClusterControl supports backup encryption for MySQL, MongoDB and PostgreSQL. Backups are encrypted at rest using AES-256 CBC algorithm. An auto generated key will be stored in the cluster's configuration file under /etc/cmon.d/cmon_X.cnf (where X is the cluster ID):

$ sudo grep backup_encryption_key /etc/cmon.d/cmon_1.cnf
backup_encryption_key='JevKc23MUIsiWLf2gJWq/IQ1BssGSM9wdVLb+gRGUv0='

If the backup destination is not local, the backup files are transferred in encrypted format. This feature complements the offsite backup on cloud, where we do not have full access to the underlying storage system.

Final Thoughts

We showed you how to get your data backed up and how to store them safely off site. Recovery is always a different thing. ClusterControl can recover automatically your databases from the backups made in the past that are stored on premises or copied back from the cloud.

Obviously there is more to securing your data, especially on the side of securing your connections. We will cover this in the next blog post!

Viewing all 1263 articles
Browse latest View live


<script src="https://jsc.adskeeper.com/r/s/rssing.com.1596347.js" async> </script>