Container orchestration tools simplify the running of a distributed system, by deploying and redeploying containers and handling any failures that occur. One might need to move applications around, e.g., to handle updates, scaling, or underlying host failures. While this sounds great, it does not always work well with a strongly consistent database cluster like Galera. You can’t just move database nodes around, they are not stateless applications. Also, the order in which you perform operations on a cluster has high significance. For instance, restarting a Galera cluster has to start from the most advanced node, or else you will lose data. Therefore, we’ll show you how to run Galera Cluster on Docker without a container orchestration tool, so you have total control.
In this blog post, we are going to look into how to run a MariaDB Galera Cluster on Docker containers using the standard Docker image on multiple Docker hosts, without the help of orchestration tools like Swarm or Kubernetes. This approach is similar to running a Galera Cluster on standard hosts, but the process management is configured through Docker.
Before we jump further into details, we assume you have installed Docker, disabled SElinux/AppArmor and cleared up the rules inside iptables, firewalld or ufw (whichever you are using). The following are three dedicated Docker hosts for our database cluster:
- host1.local - 192.168.55.161
- host2.local - 192.168.55.162
- host3.local - 192.168.55.163
Multi-host Networking
First of all, the default Docker networking is bound to the local host. Docker Swarm introduces another networking layer called overlay network, which extends the container internetworking to multiple Docker hosts in a cluster called Swarm. Long before this integration came into place, there were many network plugins developed to support this - Flannel, Calico, Weave are some of them.
Here, we are going to use Weave as the Docker network plugin for multi-host networking. This is mainly due to its simplicity to get it installed and running, and support for DNS resolver (containers running under this network can resolve each other's hostname). There are two ways to get Weave running - systemd or through Docker. We are going to install it as a systemd unit, so it's independent from Docker daemon (otherwise, we would have to start Docker first before Weave gets activated).
Download and install Weave:
$ curl -L git.io/weave -o /usr/local/bin/weave
$ chmod a+x /usr/local/bin/weave
Create a systemd unit file for Weave:
$ cat > /etc/systemd/system/weave.service << EOF
[Unit]
Description=Weave Network
Documentation=http://docs.weave.works/weave/latest_release/
Requires=docker.service
After=docker.service
[Service]
EnvironmentFile=-/etc/sysconfig/weave
ExecStartPre=/usr/local/bin/weave launch --no-restart $PEERS
ExecStart=/usr/bin/docker attach weave
ExecStop=/usr/local/bin/weave stop
[Install]
WantedBy=multi-user.target
EOF
Define IP addresses or hostname of the peers inside /etc/sysconfig/weave:
$ echo 'PEERS="192.168.55.161 192.168.55.162 192.168.55.163"'> /etc/sysconfig/weave
Start and enable Weave on boot:
$ systemctl start weave
$ systemctl enable weave
Repeat the above 4 steps on all Docker hosts. Verify with the following command once done:
$ weave status
The number of peers is what we are looking after. It should be 3:
          ...
          Peers: 3 (with 6 established connections)
          ...
Running a Galera Cluster
Now the network is ready, it's time to fire our database containers and form a cluster. The basic rules are:
- Container must be created under --net=weave to have multi-host connectivity.
- Container ports that need to be published are 3306, 4444, 4567, 4568.
- The Docker image must support Galera. If you'd like to use Oracle MySQL, then get the Codership version. If you'd like Percona's, use this image instead. In this blog post, we are using MariaDB's.
The reasons we chose MariaDB as the Galera cluster vendor are:
- Galera is embedded into MariaDB, starting from MariaDB 10.1.
- The MariaDB image is maintained by the Docker and MariaDB teams.
- One of the most popular Docker images out there.
Bootstrapping a Galera Cluster has to be performed in sequence. Firstly, the most up-to-date node must be started with "wsrep_cluster_address=gcomm://". Then, start the remaining nodes with a full address consisting of all nodes in the cluster, e.g, "wsrep_cluster_address=gcomm://node1,node2,node3". To accomplish these steps using container, we have to do some extra steps to ensure all containers are running homogeneously. So the plan is:
- We would need to start with 4 containers in this order - mariadb0 (bootstrap), mariadb2, mariadb3, mariadb1.
- Container mariadb0 will be using the same datadir and configdir with mariadb1.
- Use mariadb0 on host1 for the first bootstrap, then start mariadb2 on host2, mariadb3 on host3.
- Remove mariadb0 on host1 to give way for mariadb1.
- Lastly, start mariadb1 on host1.
At the end of the day, you would have a three-node Galera Cluster (mariadb1, mariadb2, mariadb3). The first container (mariadb0) is a transient container for bootstrapping purposes only, using cluster address "gcomm://". It shares the same datadir and configdir with mariadb1 and will be removed once the cluster is formed (mariadb2 and mariadb3 are up) and nodes are synced.
By default, Galera is turned off in MariaDB and needs to be enabled with a flag called wsrep_on (set to ON) and wsrep_provider (set to the Galera library path) plus a number of Galera-related parameters. Thus, we need to define a custom configuration file for the container to configure Galera correctly.
Let's start with the first container, mariadb0. Create a file under /containers/mariadb0/conf.d/my.cnf and add the following lines:
$ mkdir -p /containers/mariadb0/conf.d
$ cat /containers/mariadb0/conf.d/my.cnf
[mysqld]

default_storage_engine          = InnoDB
binlog_format                   = ROW

innodb_flush_log_at_trx_commit  = 0
innodb_flush_method             = O_DIRECT
innodb_file_per_table           = 1
innodb_autoinc_lock_mode        = 2
innodb_lock_schedule_algorithm  = FCFS # MariaDB >10.1.19 and >10.2.3 only

wsrep_on                        = ON
wsrep_provider                  = /usr/lib/galera/libgalera_smm.so
wsrep_sst_method                = xtrabackup-v2
Since the image doesn't come with MariaDB Backup (which is the preferred SST method for MariaDB 10.1 and MariaDB 10.2), we are going to stick with xtrabackup-v2 for the time being.
To perform the first bootstrap for the cluster, run the bootstrap container (mariadb0) on host1:
$ docker run -d \
        --name mariadb0 \
        --hostname mariadb0.weave.local \
        --net weave \
        --publish "3306" \
        --publish "4444" \
        --publish "4567" \
        --publish "4568" \
        $(weave dns-args) \
        --env MYSQL_ROOT_PASSWORD="PM7%cB43$sd@^1" \
        --env MYSQL_USER=proxysql \
        --env MYSQL_PASSWORD=proxysqlpassword \
        --volume /containers/mariadb1/datadir:/var/lib/mysql \
        --volume /containers/mariadb1/conf.d:/etc/mysql/mariadb.conf.d \
        mariadb:10.2.15 \
        --wsrep_cluster_address=gcomm:// \
        --wsrep_sst_auth="root:PM7%cB43$sd@^1" \
        --wsrep_node_address=mariadb0.weave.local
The parameters used in the the above command are:
- --name, creates the container named "mariadb0",
- --hostname, assigns the container a hostname "mariadb0.weave.local",
- --net, places the container in the weave network for multi-host networing support,
- --publish, exposes ports 3306, 4444, 4567, 4568 on the container to the host,
- $(weave dns-args), configures DNS resolver for this container. This command can be translated into Docker run as "--dns=172.17.0.1 --dns-search=weave.local.",
- --env MYSQL_ROOT_PASSWORD, the MySQL root password,
- --env MYSQL_USER, creates "proxysql" user to be used later with ProxySQL for database routing,
- --env MYSQL_PASSWORD, the "proxysql" user password,
- --volume /containers/mariadb1/datadir:/var/lib/mysql, creates /containers/mariadb1/datadir if does not exist and map it with /var/lib/mysql (MySQL datadir) of the container (for bootstrap node, this could be skipped),
- --volume /containers/mariadb1/conf.d:/etc/mysql/mariadb.conf.d, mounts the files under directory /containers/mariadb1/conf.d of the Docker host, into the container at /etc/mysql/mariadb.conf.d.
- mariadb:10.2.15, uses MariaDB 10.2.15 image from here,
- --wsrep_cluster_address, Galera connection string for the cluster. "gcomm://" means bootstrap. For the rest of the containers, we are going to use a full address instead.
- --wsrep_sst_auth, authentication string for SST user. Use the same user as root,
- --wsrep_node_address, the node hostname, in this case we are going to use the FQDN provided by Weave.
The bootstrap container contains several key things:
- The name, hostname and wsrep_node_address is mariadb0, but it uses the volumes of mariadb1.
- The cluster address is "gcomm://"
- There are two additional --env parameters - MYSQL_USER and MYSQL_PASSWORD. This parameters will create additional user for our proxysql monitoring purpose.
Verify with the following command:
$ docker ps
$ docker logs -f mariadb0
Once you see the following line, it indicates the bootstrap process is completed and Galera is active:
2018-05-30 23:19:30 139816524539648 [Note] WSREP: Synchronized with group, ready for connections
Create the directory to load our custom configuration file in the remaining hosts:
$ mkdir -p /containers/mariadb2/conf.d # on host2
$ mkdir -p /containers/mariadb3/conf.d # on host3
Then, copy the my.cnf that we've created for mariadb0 and mariadb1 to mariadb2 and mariadb3 respectively:
$ scp /containers/mariadb1/conf.d/my.cnf /containers/mariadb2/conf.d/ # on host1
$ scp /containers/mariadb1/conf.d/my.cnf /containers/mariadb3/conf.d/ # on host1
Next, create another 2 database containers (mariadb2 and mariadb3) on host2 and host3 respectively:
$ docker run -d \
        --name ${NAME} \
        --hostname ${NAME}.weave.local \
        --net weave \
        --publish "3306:3306" \
        --publish "4444" \
        --publish "4567" \
        --publish "4568" \
        $(weave dns-args) \
        --env MYSQL_ROOT_PASSWORD="PM7%cB43$sd@^1" \
        --volume /containers/${NAME}/datadir:/var/lib/mysql \
        --volume /containers/${NAME}/conf.d:/etc/mysql/mariadb.conf.d \
        mariadb:10.2.15 \

--wsrep_cluster_address=gcomm://mariadb0.weave.local,mariadb1.weave.local,mariadb2.weave.local,mariadb3.weave.local \
        --wsrep_sst_auth="root:PM7%cB43$sd@^1" \
        --wsrep_node_address=${NAME}.weave.local
** Replace ${NAME} with mariadb2 or mariadb3 respectively.
However, there is a catch. The entrypoint script checks the mysqld service in the background after database initialization by using MySQL root user without password. Since Galera automatically performs synchronization through SST or IST when starting up, the MySQL root user password will change, mirroring the bootstrapped node. Thus, you would see the following error during the first start up:
018-05-30 23:27:13 140003794790144 [Warning] Access denied for user 'root'@'localhost' (using password: NO)
MySQL init process in progress…
MySQL init process failed.
The trick is to restart the failed containers once more, because this time, the MySQL datadir would have been created (in the first run attempt) and it would skip the database initialization part:
$ docker start mariadb2 # on host2
$ docker start mariadb3 # on host3
Once started, verify by looking at the following line:
$ docker logs -f mariadb2
…
2018-05-30 23:28:39 139808069601024 [Note] WSREP: Synchronized with group, ready for connections
At this point, there are 3 containers running, mariadb0, mariadb2 and mariadb3. Take note that mariadb0 is started using the bootstrap command (gcomm://), which means if the container is automatically restarted by Docker in the future, it could potentially become disjointed with the primary component. Thus, we need to remove this container and replace it with mariadb1, using the same Galera connection string with the rest and use the same datadir and configdir with mariadb0.
First, stop mariadb0 by sending SIGTERM (to ensure the node is going to be shutdown gracefully):
$ docker kill -s 15 mariadb0
Then, start mariadb1 on host1 using similar command as mariadb2 or mariadb3:
$ docker run -d \
        --name mariadb1 \
        --hostname mariadb1.weave.local \
        --net weave \
        --publish "3306:3306" \
        --publish "4444" \
        --publish "4567" \
        --publish "4568" \
        $(weave dns-args) \
        --env MYSQL_ROOT_PASSWORD="PM7%cB43$sd@^1" \
        --volume /containers/mariadb1/datadir:/var/lib/mysql \
        --volume /containers/mariadb1/conf.d:/etc/mysql/mariadb.conf.d \
        mariadb:10.2.15 \

--wsrep_cluster_address=gcomm://mariadb0.weave.local,mariadb1.weave.local,mariadb2.weave.local,mariadb3.weave.local \
        --wsrep_sst_auth="root:PM7%cB43$sd@^1" \
        --wsrep_node_address=mariadb1.weave.local
This time, you don't need to do the restart trick because MySQL datadir already exists (created by mariadb0). Once the container is started, verify the cluster size is 3, the status must be in Primary and the local state is synced:
$ docker exec -it mariadb3 mysql -uroot "-pPM7%cB43$sd@^1" -e 'select variable_name, variable_value from information_schema.global_status where variable_name in ("wsrep_cluster_size", "wsrep_local_state_comment", "wsrep_cluster_status", "wsrep_incoming_addresses")'
+---------------------------+-------------------------------------------------------------------------------+
| variable_name             | variable_value                                                                |
+---------------------------+-------------------------------------------------------------------------------+
| WSREP_CLUSTER_SIZE        | 3                                                                             |
| WSREP_CLUSTER_STATUS      | Primary                                                                       |
| WSREP_INCOMING_ADDRESSES  | mariadb1.weave.local:3306,mariadb3.weave.local:3306,mariadb2.weave.local:3306 |
| WSREP_LOCAL_STATE_COMMENT | Synced                                                                        |
+---------------------------+-------------------------------------------------------------------------------+
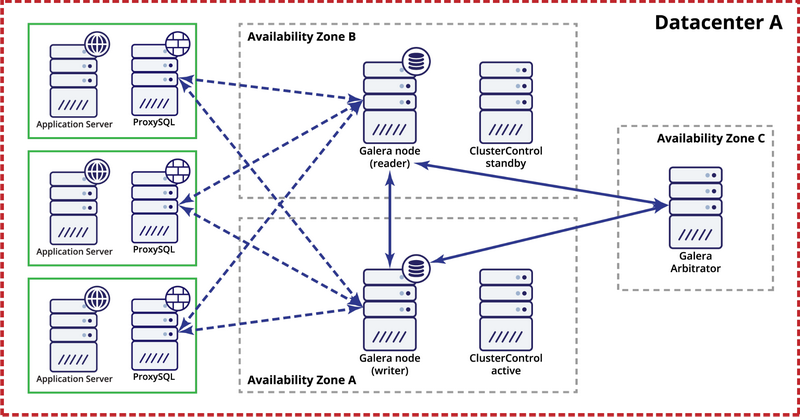
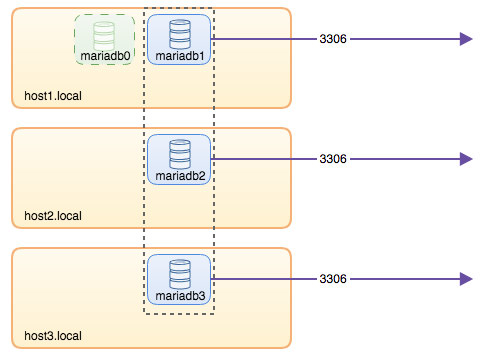
At this point, our architecture is looking something like this:
Although the run command is pretty long, it well describes the container's characteristics. It's probably a good idea to wrap the command in a script to simplify the execution steps, or use a compose file instead.
Database Routing with ProxySQL
Now we have three database containers running. The only way to access to the cluster now is to access the individual Docker host’s published port of MySQL, which is 3306 (map to 3306 to the container). So what happens if one of the database containers fails? You have to manually failover the client's connection to the next available node. Depending on the application connector, you could also specify a list of nodes and let the connector do the failover and query routing for you (Connector/J, PHP mysqlnd). Otherwise, it would be a good idea to unify the database resources into a single resource, that can be called a service.
This is where ProxySQL comes into the picture. ProxySQL can act as the query router, load balancing the database connections similar to what "Service" in Swarm or Kubernetes world can do. We have built a ProxySQL Docker image for this purpose and will maintain the image for every new version with our best effort.
Before we run the ProxySQL container, we have to prepare the configuration file. The following is what we have configured for proxysql1. We create a custom configuration file under /containers/proxysql1/proxysql.cnf on host1:
$ cat /containers/proxysql1/proxysql.cnf
datadir="/var/lib/proxysql"
admin_variables=
{
        admin_credentials="admin:admin"
        mysql_ifaces="0.0.0.0:6032"
        refresh_interval=2000
}
mysql_variables=
{
        threads=4
        max_connections=2048
        default_query_delay=0
        default_query_timeout=36000000
        have_compress=true
        poll_timeout=2000
        interfaces="0.0.0.0:6033;/tmp/proxysql.sock"
        default_schema="information_schema"
        stacksize=1048576
        server_version="5.1.30"
        connect_timeout_server=10000
        monitor_history=60000
        monitor_connect_interval=200000
        monitor_ping_interval=200000
        ping_interval_server=10000
        ping_timeout_server=200
        commands_stats=true
        sessions_sort=true
        monitor_username="proxysql"
        monitor_password="proxysqlpassword"
}
mysql_servers =
(
        { address="mariadb1.weave.local" , port=3306 , hostgroup=10, max_connections=100 },
        { address="mariadb2.weave.local" , port=3306 , hostgroup=10, max_connections=100 },
        { address="mariadb3.weave.local" , port=3306 , hostgroup=10, max_connections=100 },
        { address="mariadb1.weave.local" , port=3306 , hostgroup=20, max_connections=100 },
        { address="mariadb2.weave.local" , port=3306 , hostgroup=20, max_connections=100 },
        { address="mariadb3.weave.local" , port=3306 , hostgroup=20, max_connections=100 }
)
mysql_users =
(
        { username = "sbtest" , password = "password" , default_hostgroup = 10 , active = 1 }
)
mysql_query_rules =
(
        {
                rule_id=100
                active=1
                match_pattern="^SELECT .* FOR UPDATE"
                destination_hostgroup=10
                apply=1
        },
        {
                rule_id=200
                active=1
                match_pattern="^SELECT .*"
                destination_hostgroup=20
                apply=1
        },
        {
                rule_id=300
                active=1
                match_pattern=".*"
                destination_hostgroup=10
                apply=1
        }
)
scheduler =
(
        {
                id = 1
                filename = "/usr/share/proxysql/tools/proxysql_galera_checker.sh"
                active = 1
                interval_ms = 2000
                arg1 = "10"
                arg2 = "20"
                arg3 = "1"
                arg4 = "1"
                arg5 = "/var/lib/proxysql/proxysql_galera_checker.log"
        }
)
The above configuration will:
- configure two host groups, the single-writer and multi-writer group, as defined under "mysql_servers" section,
- send reads to all Galera nodes (hostgroup 20) while write operations will go to a single Galera server (hostgroup 10),
- schedule the proxysql_galera_checker.sh,
- use monitor_username and monitor_password as the monitoring credentials created when we first bootstrapped the cluster (mariadb0).
Copy the configuration file to host2, for ProxySQL redundancy:
$ mkdir -p /containers/proxysql2/ # on host2
$ scp /containers/proxysql1/proxysql.cnf /container/proxysql2/ # on host1
Then, run the ProxySQL containers on host1 and host2 respectively:
$ docker run -d \
        --name=${NAME} \
        --publish 6033 \
        --publish 6032 \
        --restart always \
        --net=weave \
        $(weave dns-args) \
        --hostname ${NAME}.weave.local \
        -v /containers/${NAME}/proxysql.cnf:/etc/proxysql.cnf \
        -v /containers/${NAME}/data:/var/lib/proxysql \
        severalnines/proxysql
** Replace ${NAME} with proxysql1 or proxysql2 respectively.
We specified --restart=always to make it always available regardless of the exit status, as well as automatic startup when Docker daemon starts. This will make sure the ProxySQL containers act like a daemon.
Verify the MySQL servers status monitored by both ProxySQL instances (OFFLINE_SOFT is expected for the single-writer host group):
$ docker exec -it proxysql1 mysql -uadmin -padmin -h127.0.0.1 -P6032 -e 'select hostgroup_id,hostname,status from mysql_servers'
+--------------+----------------------+--------------+
| hostgroup_id | hostname             | status       |
+--------------+----------------------+--------------+
| 10           | mariadb1.weave.local | ONLINE       |
| 10           | mariadb2.weave.local | OFFLINE_SOFT |
| 10           | mariadb3.weave.local | OFFLINE_SOFT |
| 20           | mariadb1.weave.local | ONLINE       |
| 20           | mariadb2.weave.local | ONLINE       |
| 20           | mariadb3.weave.local | ONLINE       |
+--------------+----------------------+--------------+
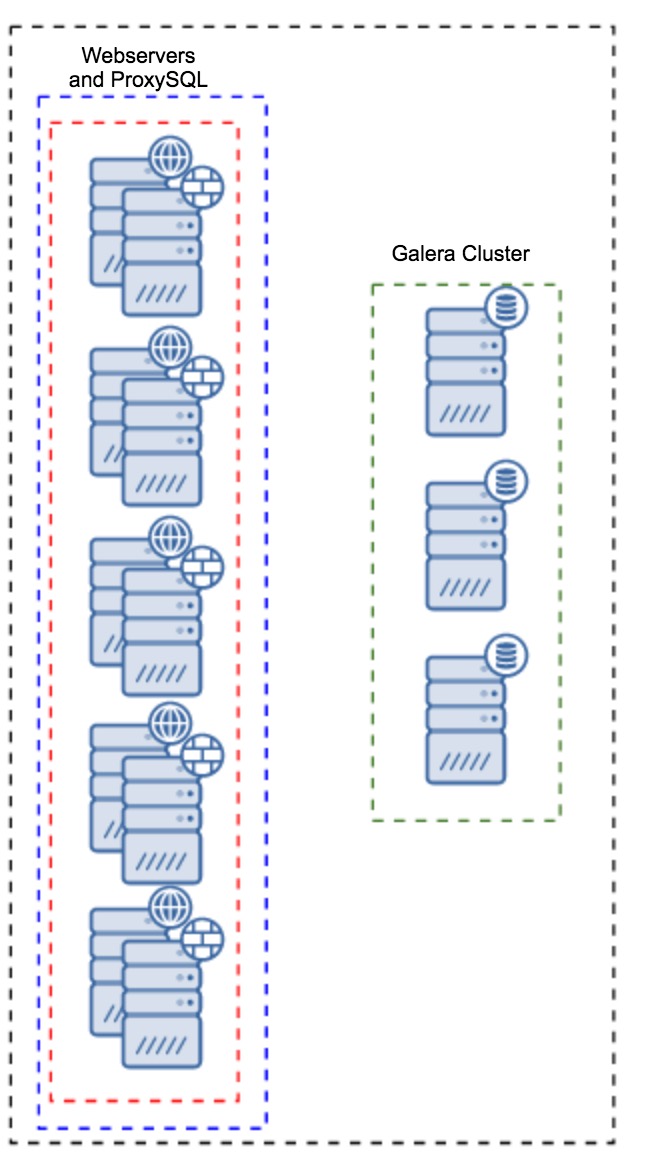
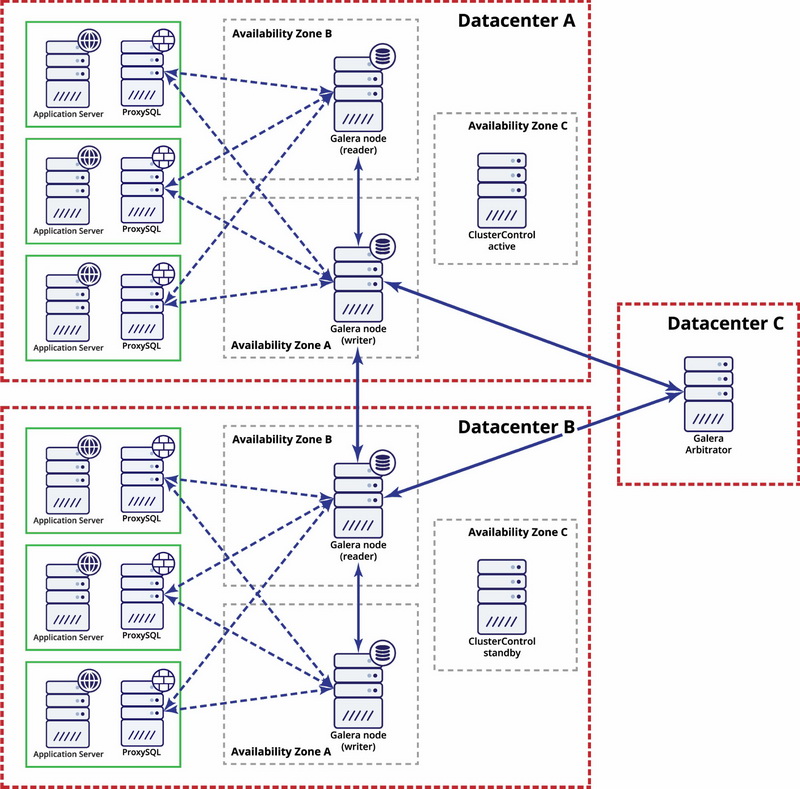
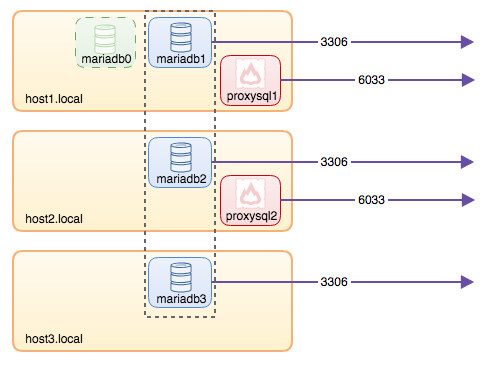
At this point, our architecture is looking something like this:
All connections coming from 6033 (either from the host1, host2 or container's network) will be load balanced to the backend database containers using ProxySQL. If you would like to access an individual database server, use port 3306 of the physical host instead. There is no virtual IP address as single endpoint configured for the ProxySQL service, but we could have that by using Keepalived, which is explained in the next section.
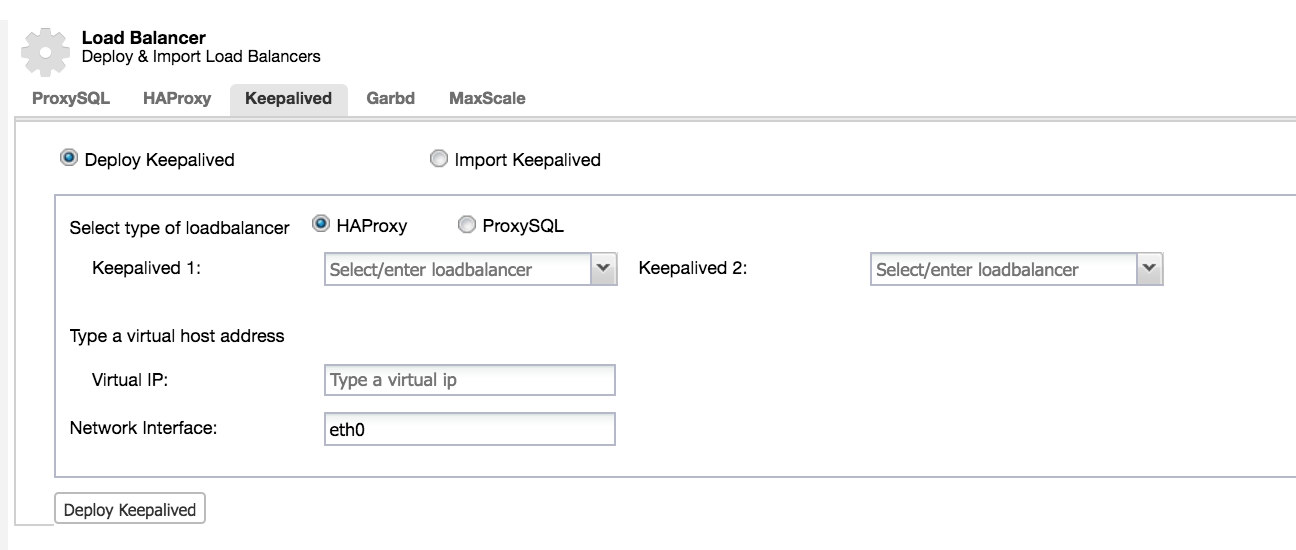
Virtual IP Address with Keepalived
Since we configured ProxySQL containers to be running on host1 and host2, we are going to use Keepalived containers to tie these hosts together and provide virtual IP address via the host network. This allows a single endpoint for applications or clients to connect to the load balancing layer backed by ProxySQL.
As usual, create a custom configuration file for our Keepalived service. Here is the content of /containers/keepalived1/keepalived.conf:
vrrp_instance VI_DOCKER {
   interface ens33               # interface to monitor
   state MASTER
   virtual_router_id 52          # Assign one ID for this route
   priority 101
   unicast_src_ip 192.168.55.161
   unicast_peer {
      192.168.55.162
   }
   virtual_ipaddress {
      192.168.55.160             # the virtual IP
}
Copy the configuration file to host2 for the second instance:
$ mkdir -p /containers/keepalived2/ # on host2
$ scp /containers/keepalived1/keepalived.conf /container/keepalived2/ # on host1
Change the priority from 101 to 100 inside the copied configuration file on host2:
$ sed -i 's/101/100/g' /containers/keepalived2/keepalived.conf
**The higher priority instance will hold the virtual IP address (in this case is host1), until the VRRP communication is interrupted (in case host1 goes down).
Then, run the following command on host1 and host2 respectively:
$ docker run -d \
        --name=${NAME} \
        --cap-add=NET_ADMIN \
        --net=host \
        --restart=always \
        --volume /containers/${NAME}/keepalived.conf:/usr/local/etc/keepalived/keepalived.conf \ osixia/keepalived:1.4.4
** Replace ${NAME} with keepalived1 and keepalived2.
The run command tells Docker to:
- --name, create a container with
- --cap-add=NET_ADMIN, add Linux capabilities for network admin scope
- --net=host, attach the container into the host network. This will provide virtual IP address on the host interface, ens33
- --restart=always, always keep the container running,
- --volume=/containers/${NAME}/keepalived.conf:/usr/local/etc/keepalived/keepalived.conf, map the custom configuration file for container's usage.
After both containers are started, verify the virtual IP address existence by looking at the physical network interface of the MASTER node:
$ ip a | grep ens33
2: ens33: <BROADCAST,MULTICAST,UP,LOWER_UP> mtu 1500 qdisc pfifo_fast state UP qlen 1000
    inet 192.168.55.161/24 brd 192.168.55.255 scope global ens33
    inet 192.168.55.160/32 scope global ens33
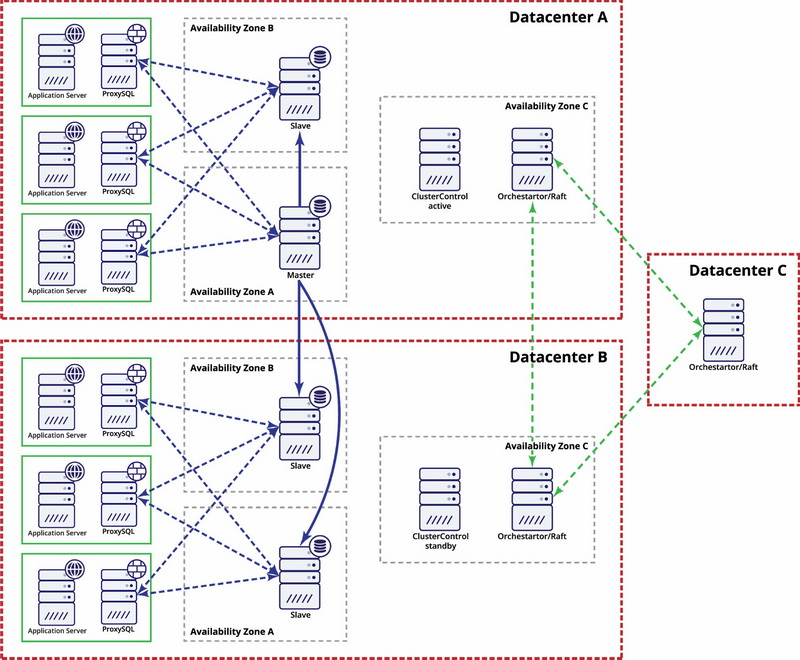
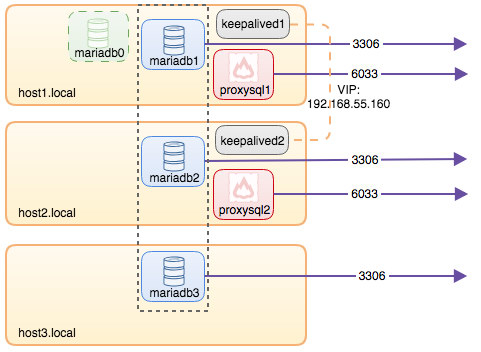
The clients and applications may now use the virtual IP address, 192.168.55.160 to access the database service. This virtual IP address exists on host1 at this moment. If host1 goes down, keepalived2 will take over the IP address and bring it up on host2. Take note that the configuration for this keepalived does not monitor the ProxySQL containers. It only monitors the VRRP advertisement of the Keepalived peers.
At this point, our architecture is looking something like this:
Summary
So, now we have a MariaDB Galera Cluster fronted by a highly available ProxySQL service, all running on Docker containers.
In part two, we are going to look into how to manage this setup. We’ll look at how to perform operations like graceful shutdown, bootstrapping, detecting the most advanced node, failover, recovery, scaling up/down, upgrades, backup and so on. We will also discuss the pros and cons of having this setup for our clustered database service.
Happy containerizing!