Quantcast
Channel: Severalnines
Viewing all 1265 articles
Browse latest View live

Deploying PostgreSQL on a Docker Container

$
0
0

Introduction

Docker modernized the way we build and deploy the application. It allows us to create lightweight, portable, self sufficient containers that can run any application easily.

This blog intended to explain how to use Docker to run PostgreSQL database. It doesn’t cover installation or configuration of docker. Please refer docker installation instructions here. Some additional background can be found in our previous blog on MySQL and Docker.

Before going into the details, let’s review some terminology.

  • Dockerfile
    It contains the set of instructions/commands to install or configure the application/software.
  • Docker Image
    Docker image is built up from series of layers which represent instructions from the Dockerfile. Docker image is used as a template to create a container.
  • Linking of containers and user defined networking
    Docker used bridge as a default networking mechanism and use the --links to link the containers to each other. For accessing PostgreSQL container from an application container, one should link both containers at creation time. Here in this article we are using user defined networks as link feature will soon be deprecated.
  • Data persistence in Docker
    By default, data inside a container is ephemeral. Whenever the container gets restarted, data will be lost. Volumes are the preferred mechanism to persist data generated and used by a Docker container. Here, we are mounting a host directory inside the container where all the data is stored.

Let’s start to build our PostgreSQL image and use it to run a container.

PostgreSQL Dockerfile

# example Dockerfile for https://docs.docker.com/engine/examples/postgresql_service/


FROM ubuntu:14.04

# Add the PostgreSQL PGP key to verify their Debian packages.
# It should be the same key as https://www.postgresql.org/media/keys/ACCC4CF8.asc
RUN apt-key adv --keyserver hkp://p80.pool.sks-keyservers.net:80 --recv-keys B97B0AFCAA1A47F044F244A07FCC7D46ACCC4CF8

# Add PostgreSQL's repository. It contains the most recent stable release
#     of PostgreSQL, ``9.3``.
RUN echo "deb http://apt.postgresql.org/pub/repos/apt/ precise-pgdg main"> /etc/apt/sources.list.d/pgdg.list

# Install ``python-software-properties``, ``software-properties-common`` and PostgreSQL 9.3
#  There are some warnings (in red) that show up during the build. You can hide
#  them by prefixing each apt-get statement with DEBIAN_FRONTEND=noninteractive
RUN apt-get update && apt-get install -y python-software-properties software-properties-common postgresql-9.3 postgresql-client-9.3 postgresql-contrib-9.3

# Note: The official Debian and Ubuntu images automatically ``apt-get clean``
# after each ``apt-get``

# Run the rest of the commands as the ``postgres`` user created by the ``postgres-9.3`` package when it was ``apt-get installed``
USER postgres

# Create a PostgreSQL role named ``postgresondocker`` with ``postgresondocker`` as the password and
# then create a database `postgresondocker` owned by the ``postgresondocker`` role.
# Note: here we use ``&&\`` to run commands one after the other - the ``\``
#       allows the RUN command to span multiple lines.
RUN    /etc/init.d/postgresql start &&\
    psql --command "CREATE USER postgresondocker WITH SUPERUSER PASSWORD 'postgresondocker';"&&\
    createdb -O postgresondocker postgresondocker

# Adjust PostgreSQL configuration so that remote connections to the
# database are possible.
RUN echo "host all  all    0.0.0.0/0  md5">> /etc/postgresql/9.3/main/pg_hba.conf

# And add ``listen_addresses`` to ``/etc/postgresql/9.3/main/postgresql.conf``
RUN echo "listen_addresses='*'">> /etc/postgresql/9.3/main/postgresql.conf

# Expose the PostgreSQL port
EXPOSE 5432

# Add VOLUMEs to allow backup of config, logs and databases
VOLUME  ["/etc/postgresql", "/var/log/postgresql", "/var/lib/postgresql"]

# Set the default command to run when starting the container
CMD ["/usr/lib/postgresql/9.3/bin/postgres", "-D", "/var/lib/postgresql/9.3/main", "-c", "config_file=/etc/postgresql/9.3/main/postgresql.conf"]

If you look at the Dockerfile closely, it consists of commands which are used to install PostgreSQL and perform some configuration changes on ubuntu OS.

Building PostgreSQL Image

We can build a PostgreSQL image from Dockerfile using the docker build command.

# sudo docker build -t postgresondocker:9.3 .

Here, we can specify the tag (-t) to the image like name and version. Dot (.) at the end specifies the current directory and it uses the Dockerfile present in the current directory.Docker file name should be “Dockerfile”. If you want to specify a custom name for your docker file then you should use -f <your_dockerfile_name> in the docker build command.

# sudo docker build -t postgresondocker:9.3 -f <your_docker_file_name>

Output: (Optional use scroll bar text window if possible)

Sending build context to Docker daemon  4.096kB
Step 1/11 : FROM ubuntu:14.04
14.04: Pulling from library/ubuntu
324d088ce065: Pull complete 
2ab951b6c615: Pull complete 
9b01635313e2: Pull complete 
04510b914a6c: Pull complete 
83ab617df7b4: Pull complete 
Digest: sha256:b8855dc848e2622653ab557d1ce2f4c34218a9380cceaa51ced85c5f3c8eb201
Status: Downloaded newer image for ubuntu:14.04
 ---> 8cef1fa16c77
Step 2/11 : RUN apt-key adv --keyserver hkp://p80.pool.sks-keyservers.net:80 --recv-keys B97B0AFCAA1A47F044F244A07FCC7D46ACCC4CF8
 ---> Running in ba933d07e226
.
.
.
fixing permissions on existing directory /var/lib/postgresql/9.3/main ... ok
creating subdirectories ... ok
selecting default max_connections ... 100
selecting default shared_buffers ... 128MB
creating configuration files ... ok
creating template1 database in /var/lib/postgresql/9.3/main/base/1 ... ok
initializing pg_authid ... ok
initializing dependencies ... ok
creating system views ... ok
loading system objects' descriptions ... ok
creating collations ... ok
creating conversions ... ok
creating dictionaries ... ok
setting privileges on built-in objects ... ok
creating information schema ... ok
loading PL/pgSQL server-side language ... ok
vacuuming database template1 ... ok
copying template1 to template0 ... ok
copying template1 to postgres ... ok
syncing data to disk ... ok

Success. You can now start the database server using:

    /usr/lib/postgresql/9.3/bin/postgres -D /var/lib/postgresql/9.3/main
or
    /usr/lib/postgresql/9.3/bin/pg_ctl -D /var/lib/postgresql/9.3/main -l logfile start

Ver Cluster Port Status Owner    Data directory               Log file
9.3 main    5432 down   postgres /var/lib/postgresql/9.3/main /var/log/postgresql/postgresql-9.3-main.log
update-alternatives: using /usr/share/postgresql/9.3/man/man1/postmaster.1.gz to provide /usr/share/man/man1/postmaster.1.gz (postmaster.1.gz) in auto mode
invoke-rc.d: policy-rc.d denied execution of start.
Setting up postgresql-contrib-9.3 (9.3.22-0ubuntu0.14.04) ...
Setting up python-software-properties (0.92.37.8) ...
Setting up python3-software-properties (0.92.37.8) ...
Setting up software-properties-common (0.92.37.8) ...
Processing triggers for libc-bin (2.19-0ubuntu6.14) ...
Processing triggers for ca-certificates (20170717~14.04.1) ...
Updating certificates in /etc/ssl/certs... 148 added, 0 removed; done.
Running hooks in /etc/ca-certificates/update.d....done.
Processing triggers for sgml-base (1.26+nmu4ubuntu1) ...
Removing intermediate container fce692f180bf
 ---> 9690b681044b
Step 5/11 : USER postgres
 ---> Running in ff8864c1147d
Removing intermediate container ff8864c1147d
 ---> 1f669efeadfa
Step 6/11 : RUN    /etc/init.d/postgresql start &&    psql --command "CREATE USER postgresondocker WITH SUPERUSER PASSWORD 'postgresondocker';"&&    createdb -O postgresondocker postgresondocker
 ---> Running in 79042024b5e8
 * Starting PostgreSQL 9.3 database server
   ...done.
CREATE ROLE
Removing intermediate container 79042024b5e8
 ---> 70c43a9dd5ab
Step 7/11 : RUN echo "host all  all    0.0.0.0/0  md5">> /etc/postgresql/9.3/main/pg_hba.conf
 ---> Running in c4d03857cdb9
Removing intermediate container c4d03857cdb9
 ---> 0cc2ed249aab
Step 8/11 : RUN echo "listen_addresses='*'">> /etc/postgresql/9.3/main/postgresql.conf
 ---> Running in fde0f721c846
Removing intermediate container fde0f721c846
 ---> 78263aef9a56
Step 9/11 : EXPOSE 5432
 ---> Running in a765f854a274
Removing intermediate container a765f854a274
 ---> d205f9208162
Step 10/11 : VOLUME  ["/etc/postgresql", "/var/log/postgresql", "/var/lib/postgresql"]
 ---> Running in ae0b9f30f3d0
Removing intermediate container ae0b9f30f3d0
 ---> 0de941f8687c
Step 11/11 : CMD ["/usr/lib/postgresql/9.3/bin/postgres", "-D", "/var/lib/postgresql/9.3/main", "-c", "config_file=/etc/postgresql/9.3/main/postgresql.conf"]
 ---> Running in 976d283ea64c
Removing intermediate container 976d283ea64c
 ---> 253ee676278f
Successfully built 253ee676278f
Successfully tagged postgresondocker:9.3

Container Network Creation

Use below command to create a user defined network with bridge driver.

# sudo docker network create --driver bridge postgres-network

Confirm Network Creation

# sudo docker network ls
NETWORK ID          NAME                DRIVER              SCOPE
a553e5727617        bridge              bridge              local
0c6e40305851        host                host                local
4cca2679d3c0        none                null                local
83b23e0af641        postgres-network    bridge              local

Container Creation

We need to use “docker run” command to create a container from the docker image. We are running postgres container in daemonize mode with the help of -d option.

# sudo docker run --name postgresondocker --network postgres-network -d postgresondocker:9.3

Use below command to confirm the container creation.

# sudo docker container ls 
CONTAINER ID        IMAGE                  COMMAND                  CREATED              STATUS              PORTS               NAMES
06a5125f5e11        postgresondocker:9.3   "/usr/lib/postgresql…"   About a minute ago   Up About a minute   5432/tcp            postgresondocker

We have not specified any port to expose, so it will expose the default postgres port 5432 for internal use. PostgreSQL is available only from inside the Docker network, we will not able to access this Postgres container on a host port.

We will see how to access Postgres container on host port in a later section in this article.

Connecting to PostgreSQL container inside Docker network

Let’s try to connect to the Postgres container from another container within the same Docker network which we created earlier.Here, we have used psql client to connect to the Postgres. We used the Postgres container name as a hostname, user and password present in the Docker file.

# docker run -it --rm --network postgres-network postgresondocker:9.3 psql -h postgresondocker -U postgresondocker --password
Password for user postgresondocker: 
psql (9.3.22)
SSL connection (cipher: DHE-RSA-AES256-GCM-SHA384, bits: 256)
Type "help" for help.

postgresondocker=# 

The --rm option in run command will remove the container once we terminate the psql process.

# sudo docker container ls 
CONTAINER ID        IMAGE                  COMMAND                  CREATED              STATUS              PORTS               NAMES
2fd91685d1ea        postgresondocker:9.3   "psql -h postgresond…"   29 seconds ago       Up 30 seconds       5432/tcp            brave_spence
06a5125f5e11        postgresondocker:9.3   "/usr/lib/postgresql…"   About a minute ago   Up About a minute   5432/tcp            postgresondocker

Data persistence

Docker containers are ephemeral in nature, i.e. data which is used or generated by the container is not stored anywhere implicitly. We lose the data whenever the container gets restarted or deleted. Docker provides volumes on which we can store the persistent data. It is a useful feature by which we can provision another container using the same volume or data in case of disaster.

Let's create a data volume and confirm its creation.

# sudo docker volume create pgdata
pgdata

# sudo docker volume ls
DRIVER              VOLUME NAME
local                   pgdata

Now we have to use this data volume while running the Postgres container. Make sure you delete the older postgres container which is running without volumes.

# sudo docker container rm postgresondocker -f 
postgresondocker

# sudo docker run --name postgresondocker --network postgres-network -v pgdata:/var/lib/postgresql/9.3/main -d postgresondocker:9.3

We have ran the Postgres container with a data volume attached to it.

Create a new table in Postgres to check data persistence.

# docker run -it --rm --network postgres-network postgresondocker:9.3 psql -h postgresondocker -U postgresondocker --password
Password for user postgresondocker: 
psql (9.3.22)
SSL connection (cipher: DHE-RSA-AES256-GCM-SHA384, bits: 256)
Type "help" for help.

postgresondocker=# \dt
No relations found.
postgresondocker=# create table test(id int);
CREATE TABLE
postgresondocker=# \dt 
            List of relations
 Schema | Name | Type  |      Owner       
--------+------+-------+------------------
 public | test | table | postgresondocker
(1 row)

Delete the Postgres container.

# sudo docker container rm postgresondocker -f 
postgresondocker

Create a new Postgres container and confirm the test table present or not.

# sudo docker run --name postgresondocker --network postgres-network -v pgdata:/var/lib/postgresql/9.3/main -d postgresondocker:9.3


# docker run -it --rm --network postgres-network postgresondocker:9.3 psql -h postgresondocker -U postgresondocker --password
Password for user postgresondocker: 
psql (9.3.22)
SSL connection (cipher: DHE-RSA-AES256-GCM-SHA384, bits: 256)
Type "help" for help.

postgresondocker=# \dt
            List of relations
 Schema | Name | Type  |      Owner       
--------+------+-------+------------------
 public | test | table | postgresondocker
(1 row)
Download the Whitepaper Today
 
PostgreSQL Management & Automation with ClusterControl
Learn about what you need to know to deploy, monitor, manage and scale PostgreSQL

Expose PostgreSQL service to the host

You may have noticed that we have not exposed any port of the PostgreSQL container earlier. This means that PostgreSQL is only accessible to the containers that are in the postgres-network we created earlier.

To use PostgreSQL service we need to expose container port using --port option. Here, we have exposed the Postgres container port 5432 on 5432 port of the host.

# sudo docker run --name postgresondocker --network postgres-network -v pgdata:/var/lib/postgresql/9.3/main -p 5432:5432 -d postgresondocker:9.3
# sudo docker container ls
CONTAINER ID        IMAGE                  COMMAND                  CREATED             STATUS              PORTS                    NAMES
997580c86188        postgresondocker:9.3   "/usr/lib/postgresql…"   8 seconds ago       Up 10 seconds       0.0.0.0:5432->5432/tcp   postgresondocker

Now you can connect PostgreSQL on localhost directly.

# psql -h localhost -U postgresondocker --password
Password for user postgresondocker: 
psql (9.3.22)
SSL connection (cipher: DHE-RSA-AES256-GCM-SHA384, bits: 256)
Type "help" for help.

postgresondocker=#

Container Deletion

To delete the container, we need to stop the running container first and then delete the container using rm command.

# sudo docker container stop postgresondocker 

# sudo docker container rm postgresondocker
postgresondocker

Use -f (--force) option to directly delete the running container.

# sudo docker container rm postgresondocker -f
postgresondocker

Hopefully, you now have your own dockerized local environment for PostgreSQL.

Note: This article provides an overview about how we can use PostgreSQL on docker for development/POC environment. Running PostgreSQL in production environment may require additional changes in the PostgreSQL or docker configurations.

Conclusion

There is a simple way to run PostgreSQL database inside a Docker container. Docker effectively encapsulates deployment, configuration and certain administration procedures. Docker is a good choice to deploy PostgreSQL with minimum efforts. All you need to do is start a pre-built Docker container and you will have PostgreSQL database ready for your service.

References


How to Benchmark Performance of MySQL & MariaDB using SysBench

$
0
0

What is SysBench? If you work with MySQL on a regular basis, then you most probably have heard of it. SysBench has been in the MySQL ecosystem for a long time. It was originally written by Peter Zaitsev, back in 2004. Its purpose was to provide a tool to run synthetic benchmarks of MySQL and the hardware it runs on. It was designed to run CPU, memory and I/O tests. It had also an option to execute OLTP workload on a MySQL database. OLTP stands for online transaction processing, typical workload for online applications like e-commerce, order entry or financial transaction systems.

In this blog post, we will focus on the SQL benchmark feature but keep in mind that hardware benchmarks can also be very useful in identifying issues on database servers. For example, I/O benchmark was intended to simulate InnoDB I/O workload while CPU tests involve simulation of highly concurrent, multi-treaded environment along with tests for mutex contentions - something which also resembles a database type of workload.

SysBench history and architecture

As mentioned, SysBench was originally created in 2004 by Peter Zaitsev. Soon after, Alexey Kopytov took over its development. It reached version 0.4.12 and the development halted. After a long break Alexey started to work on SysBench again in 2016. Soon version 0.5 has been released with OLTP benchmark rewritten to use LUA-based scripts. Then, in 2017, SysBench 1.0 was released. This was like day and night compared to the old, 0.4.12 version. First and the foremost, instead of hardcoded scripts, now we have the ability to customize benchmarks using LUA. For instance, Percona created TPCC-like benchmark which can be executed using SysBench. Let’s take a quick look at the current SysBench architecture.

SysBench is a C binary which uses LUA scripts to execute benchmarks. Those scripts have to:

  1. Handle input from command line parameters
  2. Define all of the modes which the benchmark is supposed to use (prepare, run, cleanup)
  3. Prepare all of the data
  4. Define how the benchmark will be executed (what queries will look like etc)

Scripts can utilize multiple connections to the database, they can also process results should you want to create complex benchmarks where queries depend on the result set of previous queries. With SysBench 1.0 it is possible to create latency histograms. It is also possible for the LUA scripts to catch and handle errors through error hooks. There’s support for parallelization in the LUA scripts, multiple queries can be executed in parallel, making, for example, provisioning much faster. Last but not least, multiple output formats are now supported. Before SysBench generated only human-readable output. Now it is possible to generate it as CSV or JSON, making it much easier to do post-processing and generate graphs using, for example, gnuplot or feed the data into Prometheus, Graphite or similar datastore.

Why SysBench?

The main reason why SysBench became popular is the fact that it is simple to use. Someone without prior knowledge can start to use it within minutes. It also provides, by default, benchmarks which cover most of the cases - OLTP workloads, read-only or read-write, primary key lookups and primary key updates. All which caused most of the issues for MySQL, up to MySQL 8.0. This was also a reason why SysBench was so popular in different benchmarks and comparisons published on the Internet. Those posts helped to promote this tool and made it into the go-to synthetic benchmark for MySQL.

Another good thing about SysBench is that, since version 0.5 and incorporation of LUA, anyone can prepare any kind of benchmark. We already mentioned TPCC-like benchmark but anyone can craft something which will resemble her production workload. We are not saying it is simple, it will be most likely a time-consuming process, but having this ability is beneficial if you need to prepare a custom benchmark.

Being a synthetic benchmark, SysBench is not a tool which you can use to tune configurations of your MySQL servers (unless you prepared LUA scripts with custom workload or your workload happen to be very similar to the benchmark workloads that SysBench comes with). What it is great for is to compare performance of different hardware. You can easily compare performance of, let’s say, different type of nodes offered by your cloud provider and maximum QPS (queries per second) they offer. Knowing that metric and knowing what you pay for given node, you can then calculate even more important metric - QP$ (queries per dollar). This will allow you to identify what node type to use when building a cost-efficient environment. Of course, SysBench can be used also for initial tuning and assessing feasibility of a given design. Let’s say we build a Galera cluster spanning across the globe - North America, EU, Asia. How many inserts per second can such a setup handle? What would be the commit latency? Does it even make sense to do a proof of concept or maybe network latency is high enough that even a simple workload does not work as you would expect it to.

What about stress-testing? Not everyone has moved to the cloud, there are still companies preferring to build their own infrastructure. Every new server acquired should go through a warm-up period during which you will stress it to pinpoint potential hardware defects. In this case SysBench can also help. Either by executing OLTP workload which overloads the server, or you can also use dedicated benchmarks for CPU, disk and memory.

As you can see, there are many cases in which even a simple, synthetic benchmark can be very useful. In the next paragraph we will look at what we can do with SysBench.

What SysBench can do for you?

What tests you can run?

As mentioned at the beginning, we will focus on OLTP benchmarks and just as a reminder we’ll repeat that SysBench can also be used to perform I/O, CPU and memory tests. Let’s take a look at the benchmarks that SysBench 1.0 comes with (we removed some helper LUA files and non-database LUA scripts from this list).

-rwxr-xr-x 1 root root 1.5K May 30 07:46 bulk_insert.lua
-rwxr-xr-x 1 root root 1.3K May 30 07:46 oltp_delete.lua
-rwxr-xr-x 1 root root 2.4K May 30 07:46 oltp_insert.lua
-rwxr-xr-x 1 root root 1.3K May 30 07:46 oltp_point_select.lua
-rwxr-xr-x 1 root root 1.7K May 30 07:46 oltp_read_only.lua
-rwxr-xr-x 1 root root 1.8K May 30 07:46 oltp_read_write.lua
-rwxr-xr-x 1 root root 1.1K May 30 07:46 oltp_update_index.lua
-rwxr-xr-x 1 root root 1.2K May 30 07:46 oltp_update_non_index.lua
-rwxr-xr-x 1 root root 1.5K May 30 07:46 oltp_write_only.lua
-rwxr-xr-x 1 root root 1.9K May 30 07:46 select_random_points.lua
-rwxr-xr-x 1 root root 2.1K May 30 07:46 select_random_ranges.lua

Let’s go through them one by one.

First, bulk_insert.lua. This test can be used to benchmark the ability of MySQL to perform multi-row inserts. This can be quite useful when checking, for example, performance of replication or Galera cluster. In the first case, it can help you answer a question: “how fast can I insert before replication lag will kick in?”. In the later case, it will tell you how fast data can be inserted into a Galera cluster given the current network latency.

All oltp_* scripts share a common table structure. First two of them (oltp_delete.lua and oltp_insert.lua) execute single DELETE and INSERT statements. Again, this could be a test for either replication or Galera cluster - push it to the limits and see what amount of inserting or purging it can handle. We also have other benchmarks focused on particular functionality - oltp_point_select, oltp_update_index and oltp_update_non_index. These will execute a subset of queries - primary key-based selects, index-based updates and non-index-based updates. If you want to test some of these functionalities, the tests are there. We also have more complex benchmarks which are based on OLTP workloads: oltp_read_only, oltp_read_write and oltp_write_only. You can run either a read-only workload, which will consist of different types of SELECT queries, you can run only writes (a mix of DELETE, INSERT and UPDATE) or you can run a mix of those two. Finally, using select_random_points and select_random_ranges you can run some random SELECT either using random points in IN() list or random ranges using BETWEEN.

How you can configure a benchmark?

What is also important, benchmarks are configurable - you can run different workload patterns using the same benchmark. Let’s take a look at the two most common benchmarks to execute. We’ll have a deep dive into OLTP read_only and OLTP read_write benchmarks. First of all, SysBench has some general configuration options. We will discuss here only the most important ones, you can check all of them by running:

sysbench --help

Let’s take a look at them.

  --threads=N                     number of threads to use [1]

You can define what kind of concurrency you’d like SysBench to generate. MySQL, as every software, has some scalability limitations and its performance will peak at some level of concurrency. This setting helps to simulate different concurrencies for a given workload and check if it already has passed the sweet spot.

  --events=N                      limit for total number of events [0]
  --time=N                        limit for total execution time in seconds [10]

Those two settings govern how long SysBench should keep running. It can either execute some number of queries or it can keep running for a predefined time.

  --warmup-time=N                 execute events for this many seconds with statistics disabled before the actual benchmark run with statistics enabled [0]

This is self-explanatory. SysBench generates statistical results from the tests and those results may be affected if MySQL is in a cold state. Warmup helps to identify “regular” throughput by executing benchmark for a predefined time, allowing to warm up the cache, buffer pools etc.

  --rate=N                        average transactions rate. 0 for unlimited rate [0]

By default SysBench will attempt to execute queries as fast as possible. To simulate slower traffic this option may be used. You can define here how many transactions should be executed per second.

  --report-interval=N             periodically report intermediate statistics with a specified interval in seconds. 0 disables intermediate reports [0]

By default SysBench generates a report after it completed its run and no progress is reported while the benchmark is running. Using this option you can make SysBench more verbose while the benchmark still runs.

  --rand-type=STRING   random numbers distribution {uniform, gaussian, special, pareto, zipfian} to use by default [special]

SysBench gives you ability to generate different types of data distribution. All of them may have their own purposes. Default option, ‘special’, defines several (it is configurable) hot-spots in the data, something which is quite common in web applications. You can also use other distributions if your data behaves in a different way. By making a different choice here you can also change the way your database is stressed. For example, uniform distribution, where all of the rows have the same likeliness of being accessed, is much more memory-intensive operation. It will use more buffer pool to store all of the data and it will be much more disk-intensive if your data set won’t fit in memory. On the other hand, special distribution with couple of hot-spots will put less stress on the disk as hot rows are more likely to be kept in the buffer pool and access to rows stored on disk is much less likely. For some of the data distribution types, SysBench gives you more tweaks. You can find this info in ‘sysbench --help’ output.

  --db-ps-mode=STRING prepared statements usage mode {auto, disable} [auto]

Using this setting you can decide if SysBench should use prepared statements (as long as they are available in the given datastore - for MySQL it means PS will be enabled by default) or not. This may make a difference while working with proxies like ProxySQL or MaxScale - they should treat prepared statements in a special way and all of them should be routed to one host making it impossible to test scalability of the proxy.

In addition to the general configuration options, each of the tests may have its own configuration. You can check what is possible by running:

root@vagrant:~# sysbench ./sysbench/src/lua/oltp_read_write.lua  help
sysbench 1.1.0-2e6b7d5 (using bundled LuaJIT 2.1.0-beta3)

oltp_read_only.lua options:
  --distinct_ranges=N           Number of SELECT DISTINCT queries per transaction [1]
  --sum_ranges=N                Number of SELECT SUM() queries per transaction [1]
  --skip_trx[=on|off]           Don't start explicit transactions and execute all queries in the AUTOCOMMIT mode [off]
  --secondary[=on|off]          Use a secondary index in place of the PRIMARY KEY [off]
  --create_secondary[=on|off]   Create a secondary index in addition to the PRIMARY KEY [on]
  --index_updates=N             Number of UPDATE index queries per transaction [1]
  --range_size=N                Range size for range SELECT queries [100]
  --auto_inc[=on|off]           Use AUTO_INCREMENT column as Primary Key (for MySQL), or its alternatives in other DBMS. When disabled, use client-generated IDs [on]
  --delete_inserts=N            Number of DELETE/INSERT combinations per transaction [1]
  --tables=N                    Number of tables [1]
  --mysql_storage_engine=STRING Storage engine, if MySQL is used [innodb]
  --non_index_updates=N         Number of UPDATE non-index queries per transaction [1]
  --table_size=N                Number of rows per table [10000]
  --pgsql_variant=STRING        Use this PostgreSQL variant when running with the PostgreSQL driver. The only currently supported variant is 'redshift'. When enabled, create_secondary is automatically disabled, and delete_inserts is set to 0
  --simple_ranges=N             Number of simple range SELECT queries per transaction [1]
  --order_ranges=N              Number of SELECT ORDER BY queries per transaction [1]
  --range_selects[=on|off]      Enable/disable all range SELECT queries [on]
  --point_selects=N             Number of point SELECT queries per transaction [10]

Again, we will discuss the most important options from here. First of all, you have a control of how exactly a transaction will look like. Generally speaking, it consists of different types of queries - INSERT, DELETE, different type of SELECT (point lookup, range, aggregation) and UPDATE (indexed, non-indexed). Using variables like:

  --distinct_ranges=N           Number of SELECT DISTINCT queries per transaction [1]
  --sum_ranges=N                Number of SELECT SUM() queries per transaction [1]
  --index_updates=N             Number of UPDATE index queries per transaction [1]
  --delete_inserts=N            Number of DELETE/INSERT combinations per transaction [1]
  --non_index_updates=N         Number of UPDATE non-index queries per transaction [1]
  --simple_ranges=N             Number of simple range SELECT queries per transaction [1]
  --order_ranges=N              Number of SELECT ORDER BY queries per transaction [1]
  --point_selects=N             Number of point SELECT queries per transaction [10]
  --range_selects[=on|off]      Enable/disable all range SELECT queries [on]

You can define what a transaction should look like. As you can see by looking at the default values, majority of queries are SELECTs - mainly point selects but also different types of range SELECTs (you can disable all of them by setting range_selects to off). You can tweak the workload towards more write-heavy workload by increasing the number of updates or INSERT/DELETE queries. It is also possible to tweak settings related to secondary indexes, auto increment but also data set size (number of tables and how many rows each of them should hold). This lets you customize your workload quite nicely.

  --skip_trx[=on|off]           Don't start explicit transactions and execute all queries in the AUTOCOMMIT mode [off]

This is another setting, quite important when working with proxies. By default, SysBench will attempt to execute queries in explicit transaction. This way the dataset will stay consistent and not affected: SysBench will, for example, execute INSERT and DELETE on the same row, making sure the data set will not grow (impacting your ability to reproduce results). However, proxies will treat explicit transactions differently - all queries executed within a transaction should be executed on the same host, thus removing the ability to scale the workload. Please keep in mind that disabling transactions will result in data set diverging from the initial point. It may also trigger some issues like duplicate key errors or such. To be able to disable transactions you may also want to look into:

  --mysql-ignore-errors=[LIST,...] list of errors to ignore, or "all" [1213,1020,1205]

This setting allows you to specify error codes from MySQL which SysBench should ignore (and not kill the connection). For example, to ignore errors like: error 1062 (Duplicate entry '6' for key 'PRIMARY') you should pass this error code: --mysql-ignore-errors=1062

What is also important, each benchmark should present a way to provision a data set for tests, run them and then clean it up after the tests complete. This is done using ‘prepare’, ‘run’ and ‘cleanup’ commands. We will show how this is done in the next section.

Examples

In this section we’ll go through some examples of what SysBench can be used for. As mentioned earlier, we’ll focus on the two most popular benchmarks - OLTP read only and OLTP read/write. Sometimes it may make sense to use other benchmarks, but at least we’ll be able to show you how those two can be customized.

Primary Key lookups

First of all, we have to decide which benchmark we will run, read-only or read-write. Technically speaking it does not make a difference as we can remove writes from R/W benchmark. Let’s focus on the read-only one.

As a first step, we have to prepare a data set. We need to decide how big it should be. For this particular benchmark, using default settings (so, secondary indexes are created), 1 million rows will result in ~240 MB of data. Ten tables, 1000 000 rows each equals to 2.4GB:

root@vagrant:~# du -sh /var/lib/mysql/sbtest/
2.4G    /var/lib/mysql/sbtest/
root@vagrant:~# ls -alh /var/lib/mysql/sbtest/
total 2.4G
drwxr-x--- 2 mysql mysql 4.0K Jun  1 12:12 .
drwxr-xr-x 6 mysql mysql 4.0K Jun  1 12:10 ..
-rw-r----- 1 mysql mysql   65 Jun  1 12:08 db.opt
-rw-r----- 1 mysql mysql 8.5K Jun  1 12:12 sbtest10.frm
-rw-r----- 1 mysql mysql 240M Jun  1 12:12 sbtest10.ibd
-rw-r----- 1 mysql mysql 8.5K Jun  1 12:10 sbtest1.frm
-rw-r----- 1 mysql mysql 240M Jun  1 12:10 sbtest1.ibd
-rw-r----- 1 mysql mysql 8.5K Jun  1 12:10 sbtest2.frm
-rw-r----- 1 mysql mysql 240M Jun  1 12:10 sbtest2.ibd
-rw-r----- 1 mysql mysql 8.5K Jun  1 12:10 sbtest3.frm
-rw-r----- 1 mysql mysql 240M Jun  1 12:10 sbtest3.ibd
-rw-r----- 1 mysql mysql 8.5K Jun  1 12:10 sbtest4.frm
-rw-r----- 1 mysql mysql 240M Jun  1 12:10 sbtest4.ibd
-rw-r----- 1 mysql mysql 8.5K Jun  1 12:11 sbtest5.frm
-rw-r----- 1 mysql mysql 240M Jun  1 12:11 sbtest5.ibd
-rw-r----- 1 mysql mysql 8.5K Jun  1 12:11 sbtest6.frm
-rw-r----- 1 mysql mysql 240M Jun  1 12:11 sbtest6.ibd
-rw-r----- 1 mysql mysql 8.5K Jun  1 12:11 sbtest7.frm
-rw-r----- 1 mysql mysql 240M Jun  1 12:11 sbtest7.ibd
-rw-r----- 1 mysql mysql 8.5K Jun  1 12:11 sbtest8.frm
-rw-r----- 1 mysql mysql 240M Jun  1 12:11 sbtest8.ibd
-rw-r----- 1 mysql mysql 8.5K Jun  1 12:12 sbtest9.frm
-rw-r----- 1 mysql mysql 240M Jun  1 12:12 sbtest9.ibd

This should give you idea how many tables you want and how big they should be. Let’s say we want to test in-memory workload so we want to create tables which will fit into InnoDB buffer pool. On the other hand, we want also to make sure there are enough tables not to become a bottleneck (or, that the amount of tables matches what you would expect in your production setup). Let’s prepare our dataset. Please keep in mind that, by default, SysBench looks for ‘sbtest’ schema which has to exist before you prepare the data set. You may have to create it manually.

root@vagrant:~# sysbench /root/sysbench/src/lua/oltp_read_only.lua --threads=4 --mysql-host=10.0.0.126 --mysql-user=sbtest --mysql-password=pass --mysql-port=3306 --tables=10 --table-size=1000000 prepare
sysbench 1.1.0-2e6b7d5 (using bundled LuaJIT 2.1.0-beta3)

Initializing worker threads...

Creating table 'sbtest2'...
Creating table 'sbtest3'...
Creating table 'sbtest4'...
Creating table 'sbtest1'...
Inserting 1000000 records into 'sbtest2'
Inserting 1000000 records into 'sbtest4'
Inserting 1000000 records into 'sbtest3'
Inserting 1000000 records into 'sbtest1'
Creating a secondary index on 'sbtest2'...
Creating a secondary index on 'sbtest3'...
Creating a secondary index on 'sbtest1'...
Creating a secondary index on 'sbtest4'...
Creating table 'sbtest6'...
Inserting 1000000 records into 'sbtest6'
Creating table 'sbtest7'...
Inserting 1000000 records into 'sbtest7'
Creating table 'sbtest5'...
Inserting 1000000 records into 'sbtest5'
Creating table 'sbtest8'...
Inserting 1000000 records into 'sbtest8'
Creating a secondary index on 'sbtest6'...
Creating a secondary index on 'sbtest7'...
Creating a secondary index on 'sbtest5'...
Creating a secondary index on 'sbtest8'...
Creating table 'sbtest10'...
Inserting 1000000 records into 'sbtest10'
Creating table 'sbtest9'...
Inserting 1000000 records into 'sbtest9'
Creating a secondary index on 'sbtest10'...
Creating a secondary index on 'sbtest9'...

Once we have our data, let’s prepare a command to run the test. We want to test Primary Key lookups therefore we will disable all other types of SELECT. We will also disable prepared statements as we want to test regular queries. We will test low concurrency, let’s say 16 threads. Our command may look like below:

sysbench /root/sysbench/src/lua/oltp_read_only.lua --threads=16 --events=0 --time=300 --mysql-host=10.0.0.126 --mysql-user=sbtest --mysql-password=pass --mysql-port=3306 --tables=10 --table-size=1000000 --range_selects=off --db-ps-mode=disable --report-interval=1 run

What did we do here? We set the number of threads to 16. We decided that we want our benchmark to run for 300 seconds, without a limit of executed queries. We defined connectivity to the database, number of tables and their size. We also disabled all range SELECTs, we also disabled prepared statements. Finally, we set report interval to one second. This is how a sample output may look like:

[ 297s ] thds: 16 tps: 97.21 qps: 1127.43 (r/w/o: 935.01/0.00/192.41) lat (ms,95%): 253.35 err/s: 0.00 reconn/s: 0.00
[ 298s ] thds: 16 tps: 195.32 qps: 2378.77 (r/w/o: 1985.13/0.00/393.64) lat (ms,95%): 189.93 err/s: 0.00 reconn/s: 0.00
[ 299s ] thds: 16 tps: 178.02 qps: 2115.22 (r/w/o: 1762.18/0.00/353.04) lat (ms,95%): 155.80 err/s: 0.00 reconn/s: 0.00
[ 300s ] thds: 16 tps: 217.82 qps: 2640.92 (r/w/o: 2202.27/0.00/438.65) lat (ms,95%): 125.52 err/s: 0.00 reconn/s: 0.00

Every second we see a snapshot of workload stats. This is quite useful to track and plot - final report will give you averages only. Intermediate results will make it possible to track the performance on a second by second basis. The final report may look like below:

SQL statistics:
    queries performed:
        read:                            614660
        write:                           0
        other:                           122932
        total:                           737592
    transactions:                        61466  (204.84 per sec.)
    queries:                             737592 (2458.08 per sec.)
    ignored errors:                      0      (0.00 per sec.)
    reconnects:                          0      (0.00 per sec.)

Throughput:
    events/s (eps):                      204.8403
    time elapsed:                        300.0679s
    total number of events:              61466

Latency (ms):
         min:                                   24.91
         avg:                                   78.10
         max:                                  331.91
         95th percentile:                      137.35
         sum:                              4800234.60

Threads fairness:
    events (avg/stddev):           3841.6250/20.87
    execution time (avg/stddev):   300.0147/0.02

You will find here information about executed queries and other (BEGIN/COMMIT) statements. You’ll learn how many transactions were executed, how many errors happened, what was the throughput and total elapsed time. You can also check latency metrics and the query distribution across threads.

If we were interested in latency distribution, we could also pass ‘--histogram’ argument to SysBench. This results in an additional output like below:

Latency histogram (values are in milliseconds)
       value  ------------- distribution ------------- count
      29.194 |******                                   1
      30.815 |******                                   1
      31.945 |***********                              2
      33.718 |******                                   1
      34.954 |***********                              2
      35.589 |******                                   1
      37.565 |***********************                  4
      38.247 |******                                   1
      38.942 |******                                   1
      39.650 |***********                              2
      40.370 |***********                              2
      41.104 |*****************                        3
      41.851 |*****************************            5
      42.611 |*****************                        3
      43.385 |*****************                        3
      44.173 |***********                              2
      44.976 |**************************************** 7
      45.793 |***********************                  4
      46.625 |***********                              2
      47.472 |*****************************            5
      48.335 |**************************************** 7
      49.213 |***********                              2
      50.107 |**********************************       6
      51.018 |***********************                  4
      51.945 |**************************************** 7
      52.889 |*****************                        3
      53.850 |*****************                        3
      54.828 |***********************                  4
      55.824 |***********                              2
      57.871 |***********                              2
      58.923 |***********                              2
      59.993 |******                                   1
      61.083 |******                                   1
      63.323 |***********                              2
      66.838 |******                                   1
      71.830 |******                                   1

Once we are good with our results, we can clean up the data:

sysbench /root/sysbench/src/lua/oltp_read_only.lua --threads=16 --events=0 --time=300 --mysql-host=10.0.0.126 --mysql-user=sbtest --mysql-password=pass --mysql-port=3306 --tables=10 --table-size=1000000 --range_selects=off --db-ps-mode=disable --report-interval=1 cleanup

Write-heavy traffic

Let’s imagine here that we want to execute a write-heavy (but not write-only) workload and, for example, test I/O subsystem’s performance. First of all, we have to decide how big the dataset should be. We’ll assume ~48GB of data (20 tables, 10 000 000 rows each). We need to prepare it. This time we will use the read-write benchmark.

root@vagrant:~# sysbench /root/sysbench/src/lua/oltp_read_write.lua --threads=4 --mysql-host=10.0.0.126 --mysql-user=sbtest --mysql-password=pass --mysql-port=3306 --tables=20 --table-size=10000000 prepare

Once this is done, we can tweak the defaults to force more writes into the query mix:

root@vagrant:~# sysbench /root/sysbench/src/lua/oltp_read_write.lua --threads=16 --events=0 --time=300 --mysql-host=10.0.0.126 --mysql-user=sbtest --mysql-password=pass --mysql-port=3306 --tables=20 --delete_inserts=10 --index_updates=10 --non_index_updates=10 --table-size=10000000 --db-ps-mode=disable --report-interval=1 run

As you can see from the intermediate results, transactions are now on a write-heavy side:

[ 5s ] thds: 16 tps: 16.99 qps: 946.31 (r/w/o: 231.83/680.50/33.98) lat (ms,95%): 1258.08 err/s: 0.00 reconn/s: 0.00
[ 6s ] thds: 16 tps: 17.01 qps: 955.81 (r/w/o: 223.19/698.59/34.03) lat (ms,95%): 1032.01 err/s: 0.00 reconn/s: 0.00
[ 7s ] thds: 16 tps: 12.00 qps: 698.91 (r/w/o: 191.97/482.93/24.00) lat (ms,95%): 1235.62 err/s: 0.00 reconn/s: 0.00
[ 8s ] thds: 16 tps: 14.01 qps: 683.43 (r/w/o: 195.12/460.29/28.02) lat (ms,95%): 1533.66 err/s: 0.00 reconn/s: 0.00

Understanding the results

As we showed above, SysBench is a great tool which can help to pinpoint some of the performance issues of MySQL or MariaDB. It can also be used for initial tuning of your database configuration. Of course, you have to keep in mind that, to get the best out of your benchmarks, you have to understand why results look like they do. This would require insights into the MySQL internal metrics using monitoring tools, for instance, ClusterControl. This is quite important to remember - if you don’t understand why the performance was like it was, you may draw incorrect conclusions out of the benchmarks. There is always a bottleneck, and SysBench can help raise the performance issues, which you then have to identify.

ChatOps - Managing MySQL, MongoDB & PostgreSQL from Slack

$
0
0

What is ChatOps?

Nowadays, we make use of multiple communication channels to manage or receive information from our systems, such as email, chat and applications among others. If we could centralize this in one or just a few different possible applications, and even better, if we could integrate it with tools that we currently use in our organization, we would be able to automate processes, improve our work dynamics and communication, having a clearer picture of the current state of our system. In many companies, Slack or other collaboration tools is becoming the centre and the heart of the development and ops teams.

What is ChatBot?

A chatbot is a program that simulates a conversation, receiving entries made by the user and returns answers based on its programming.

Some products have been developed with this technology, that allow us to perform administrative tasks, or keeps the team up to date on the current status of the systems.

This allows, among other things, to integrate the communication tools we use daily, with our systems.

CCBot - ClusterControl

CCBot is a chatbot that uses the ClusterControl APIs to manage and monitor your database clusters. You will be able to deploy new clusters or replication setups, keep your team up to date on the status of the databases as well as the status of any administrative jobs (e.g., backups or rolling upgrades). You can also restart failed nodes, add new ones, promote a slave to master, add load balancers, and so on. CCBot supports most of the major chat services like Slack, Flowdock and Hipchat.

CCBot is integrated with the s9s command line, so you have several commands to use with this tool.

ClusterControl Notifications via Slack

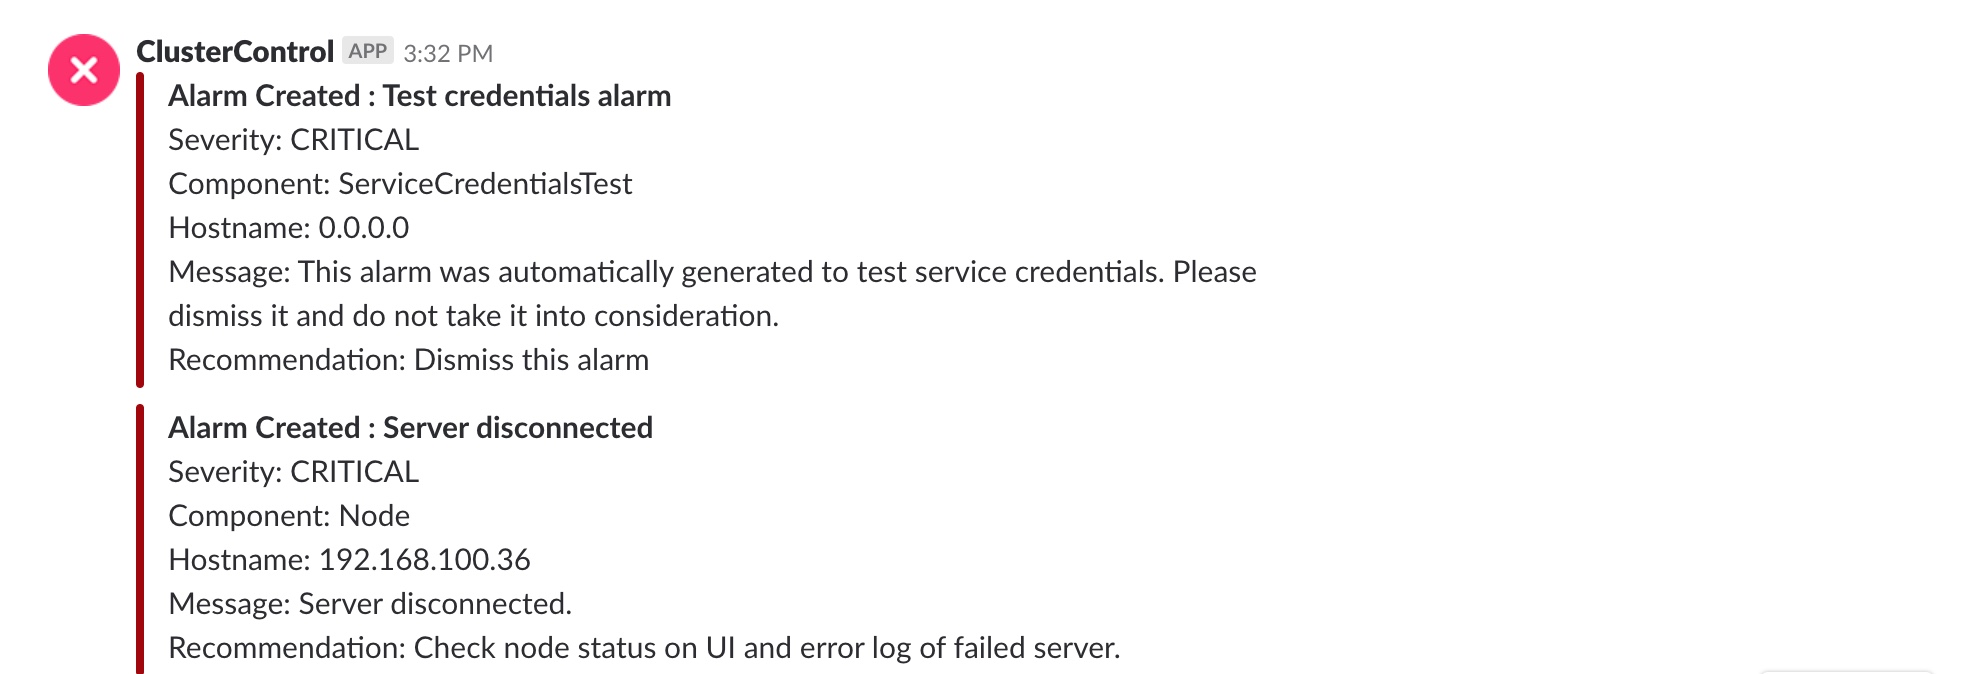
Note that you can use Slack to handle alarms and notifications from ClusterControl. Why? A chat room is a good place to discuss incidents. Seeing an actual alarm in a Slack channel makes it easy to discuss it with the team, because all team members actually know what is being discussed and can chime in.

The main difference between CCBot and the integration of notifications via Slack is that, with CCBot, the user initiates the communication via a specific command, generating a response from the system. For notifications, ClusterControl generates an event, for example, a message about a node failure. This event is then sent to the tool that we have integrated for our notifications, for example, Slack.

You can review this post on how to configure ClusterControl in order to send notifications to Slack.

After this, we can see ClusterControl notifications in our Slack:

ClusterControl Slack Integration

CCBot Installation

To install CCBot, once we have installed ClusterControl, we must execute the following script:

$ /var/www/html/clustercontrol/app/tools/install-ccbot.sh

We select which adapter we want to use, in this blog, we will select Slack.

-- Supported Hubot Adapters --
1. slack
2. hipchat
3. flowdock
Select the hubot adapter to install [1-3]: 1

It will then ask us for some information, such as an email, a description, the name we will give to our bot, the port, the API token and the channel to which we want to add it.

? Owner (User <user@example.com>)
? Description (A simple helpful robot for your Company)
Enter your bot's name (ccbot):
Enter hubot's http events listening port (8081):
Enter your slack API token:
Enter your slack message room (general):

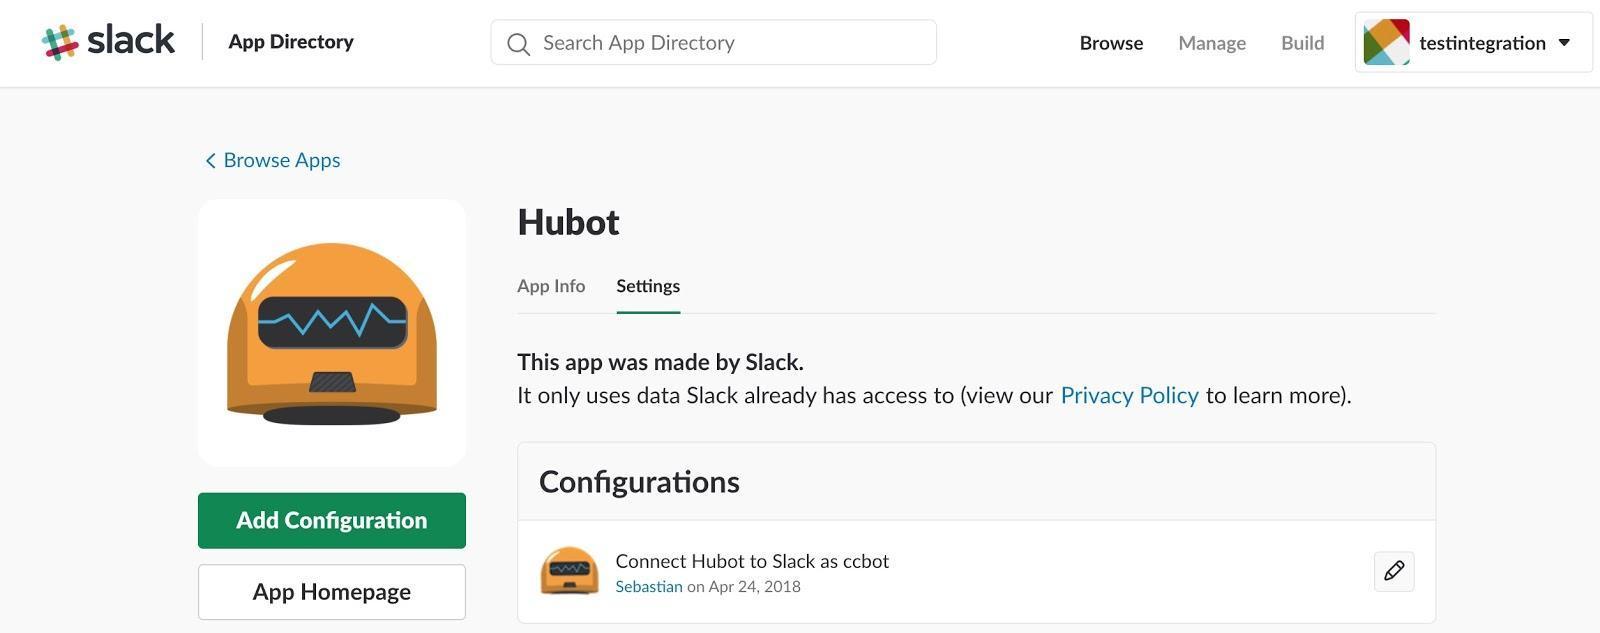
To obtain the API token, we must go to our Slack -> Apps (On the left side of our Slack window), we look for Hubot and select Install.

CCBot Hubot
CCBot Hubot

We enter the Username, which must match our bot name.

In the next window, we can see the API token to use.

CCBot API Token
CCBot API Token
Enter your slack API token: xoxb-111111111111-XXXXXXXXXXXXXXXXXXXXXXXX
CCBot installation completed!

Finally, to be able to use all the s9s command line functions with CCBot, we must create a user from ClusterControl:

$ s9s user --create --cmon-user=cmon --group=admins  --controller="https://localhost:9501" --generate-key cmon

For further information about how to manage users, please check the official documentation.

We can now use our CCBot from Slack.

Here we have some examples of commands:

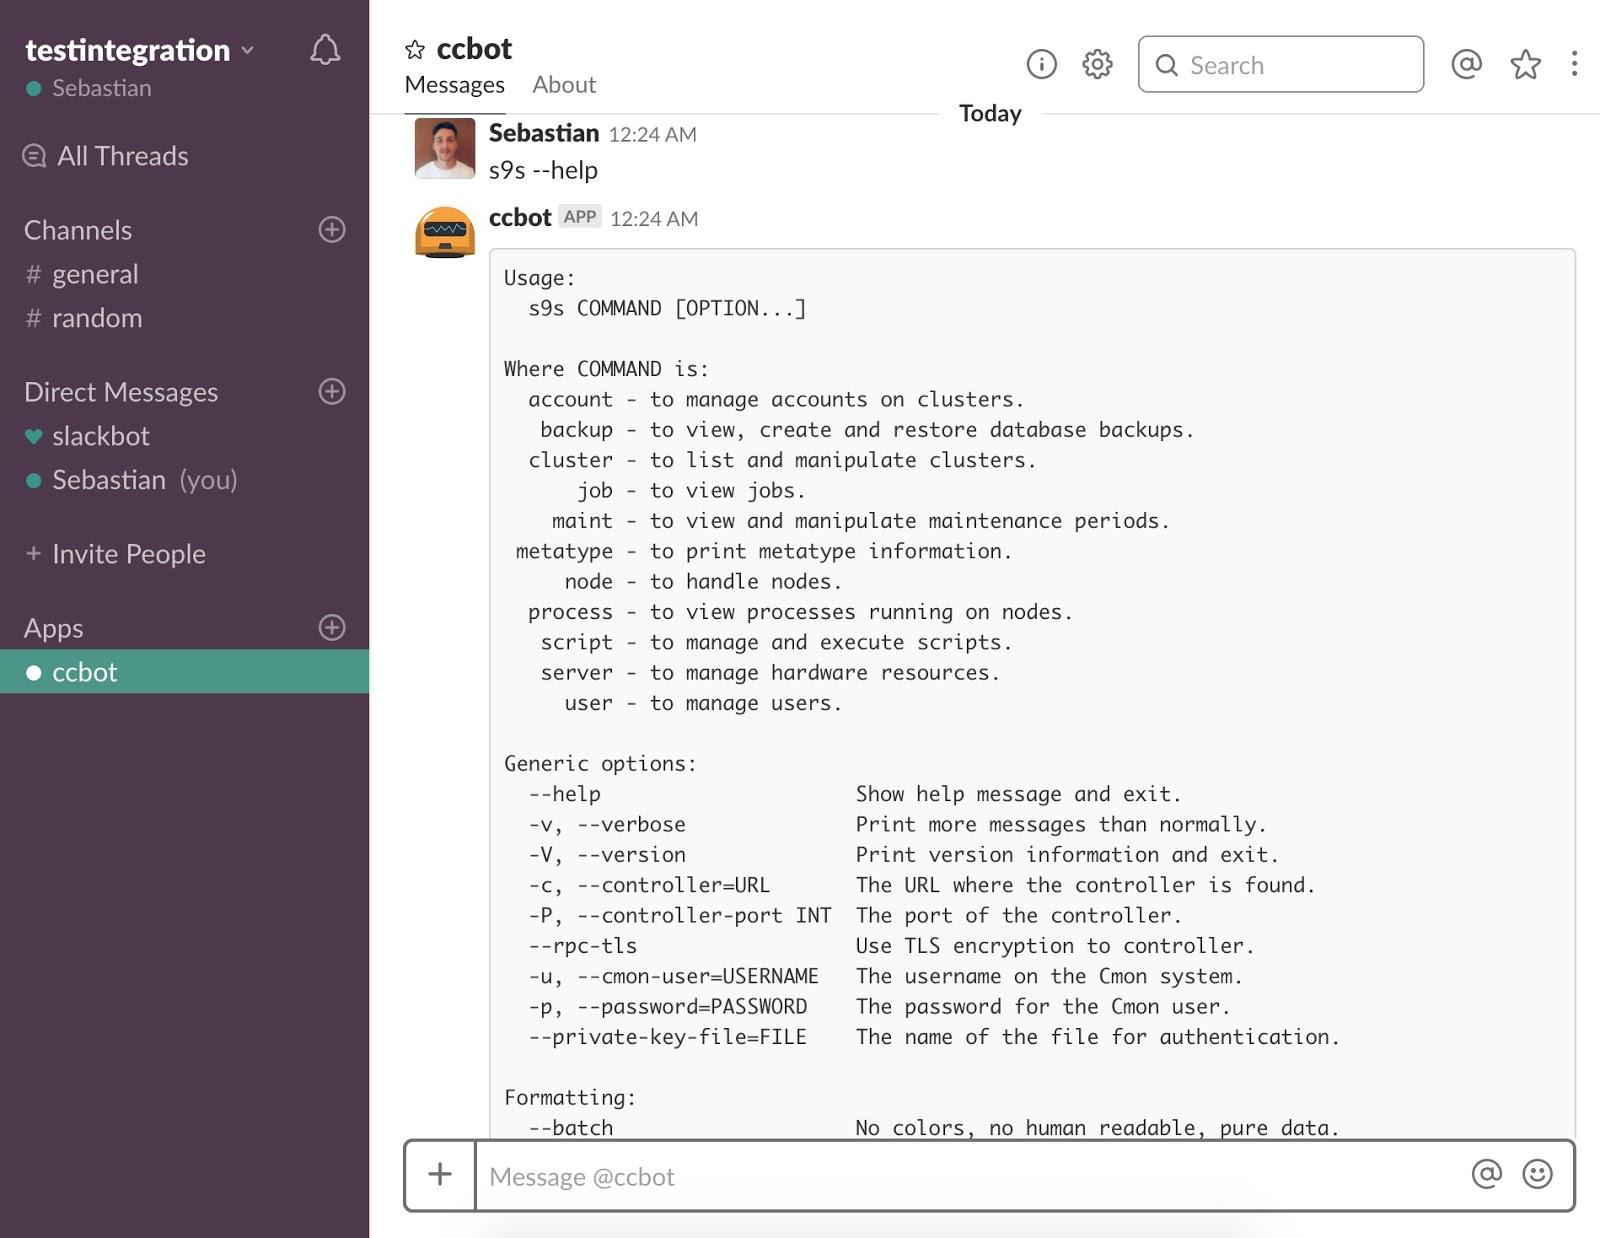
$ s9s --help
CCBot Help
CCBot Help

With this command we can see the help for the s9s CLI.

$ s9s cluster --list --long
CCBot Cluster List
CCBot Cluster List

With this command we can see a list of our clusters.

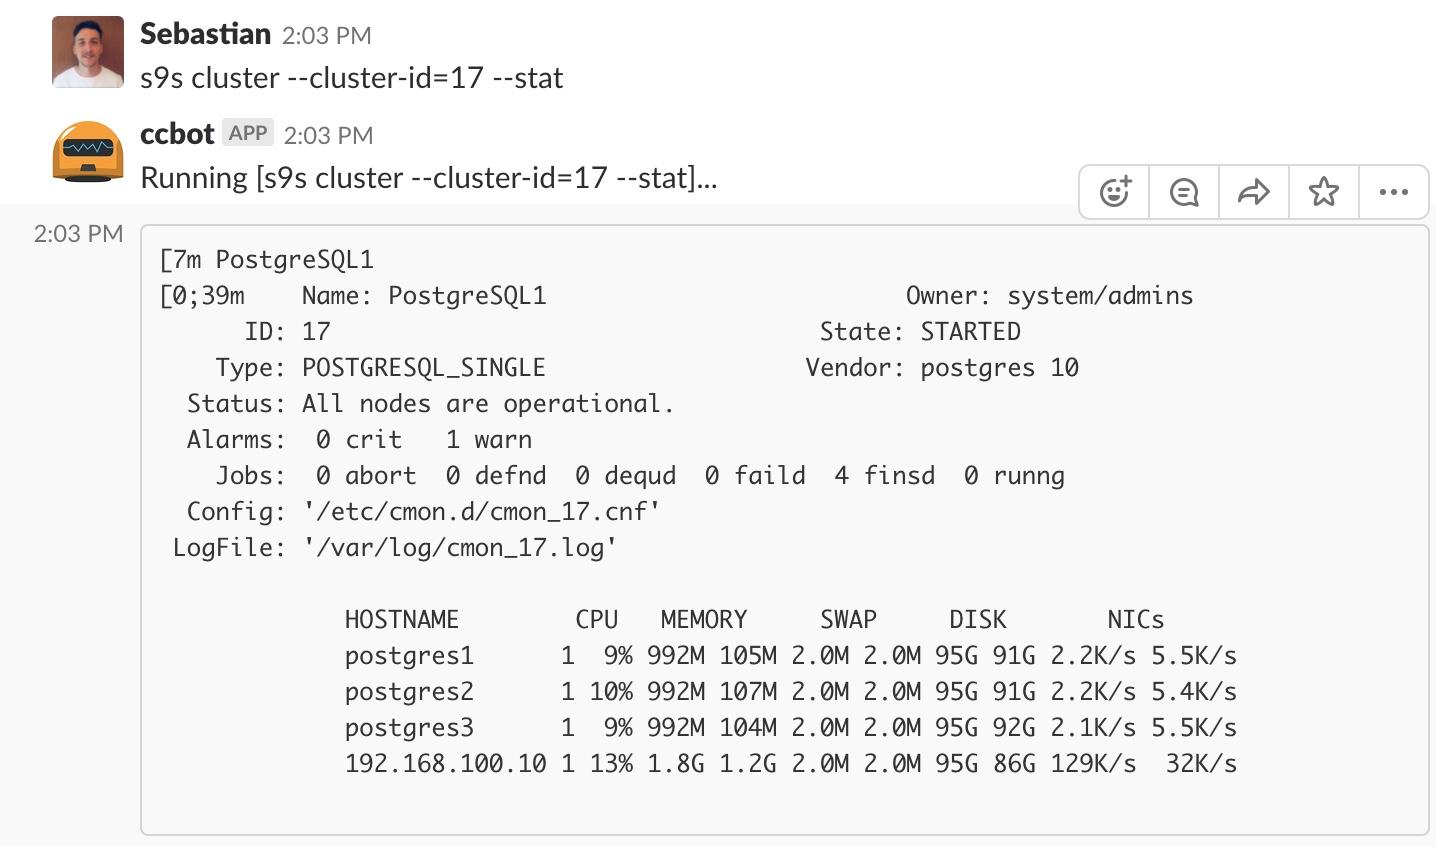
$ s9s cluster --cluster-id=17 --stat
CCBot Cluster Stat
CCBot Cluster Stat

With this command we can see the stats of one cluster, in this case cluster id 17.

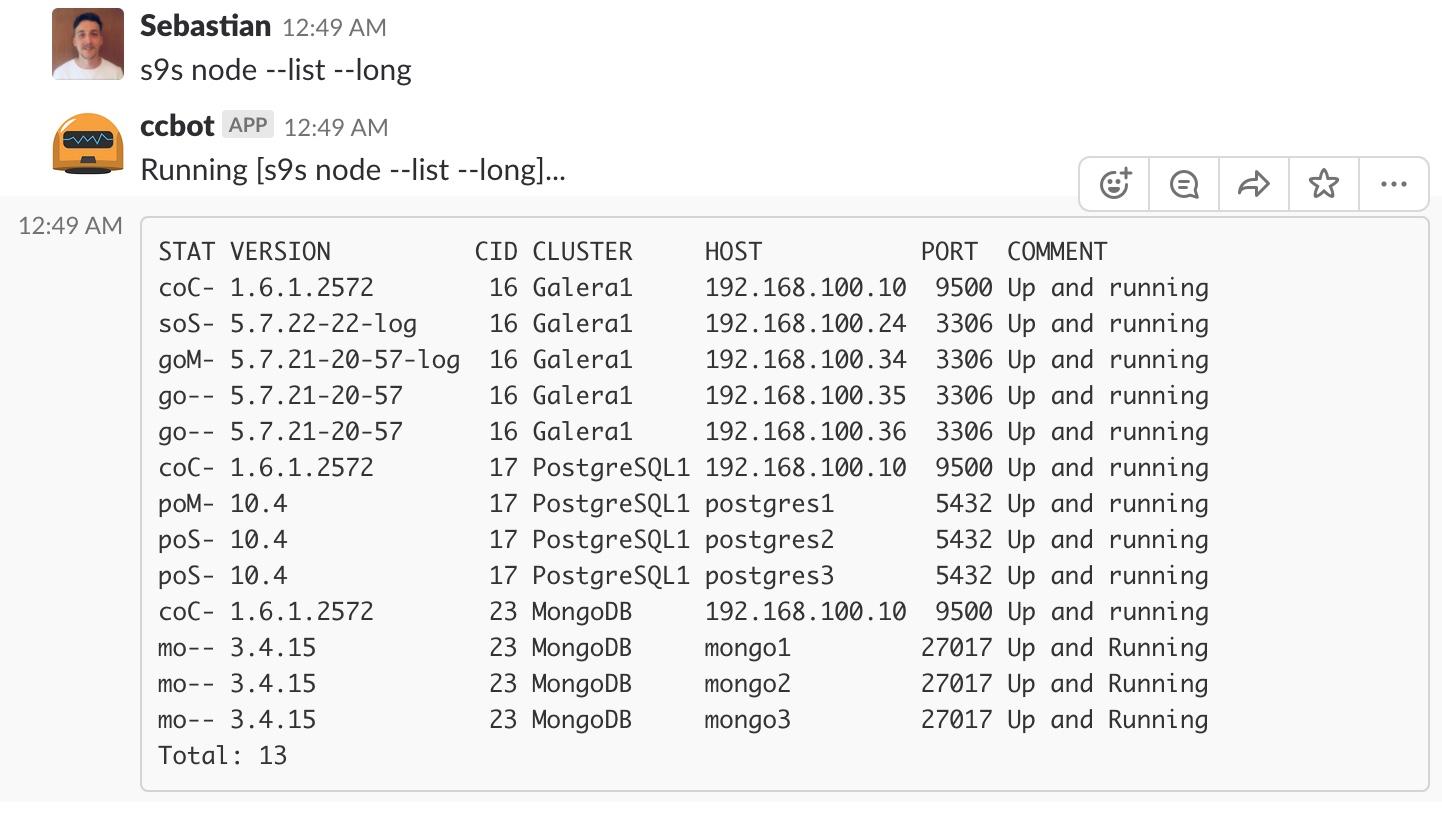
$ s9s node --list --long
CCBot Node List
CCBot Node List

With this command we can see a list of our nodes.

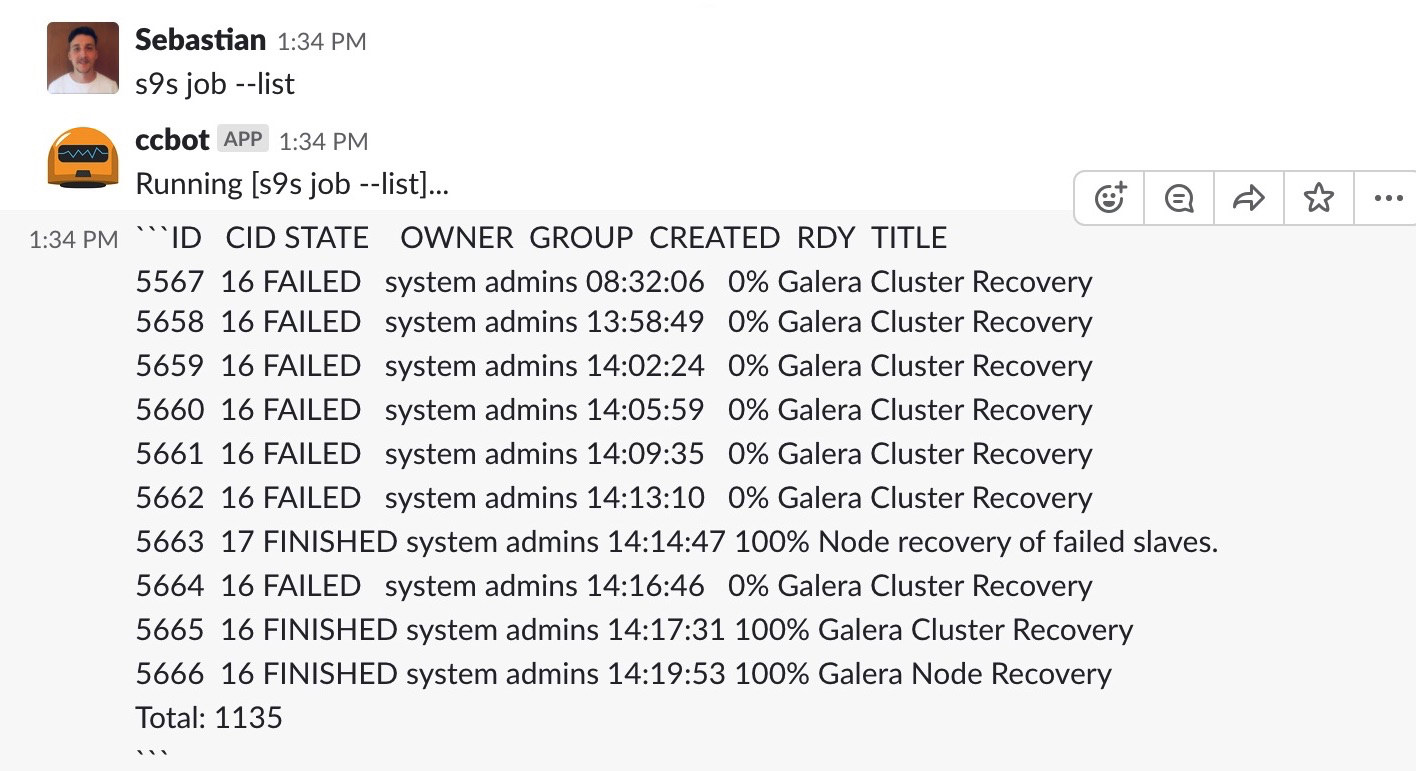
$ s9s job --list
CCBot Job List
CCBot Job List

With this command we can see a list of our jobs.

$ s9s backup --create --backup-method=mysqldump --cluster-id=16 --nodes=192.168.100.34:3306 --backup-directory=/backup
CCBot Backup
CCBot Backup

With this command we can create a backup with mysqldump, in the node 192.168.100.34. The backup will be saved in the /backup directory.

ClusterControl
Single Console for Your Entire Database Infrastructure
Find out what else is new in ClusterControl

Now let's see some more complex examples:

$ s9s cluster --create --cluster-type=mysqlreplication --nodes="mysql1;mysql2" --vendor="percona" --provider-version="5.7" --template="my.cnf.repl57" --db-admin="root" --db-admin-passwd="root123" --os-user="root" --cluster-name="MySQL1"
CCBot Create Replication

With this command we can create a MySQL Master-Slave Replication with Percona for MySQL 5.7 version.

CCBot Check Replication Created

And we can check this new cluster.

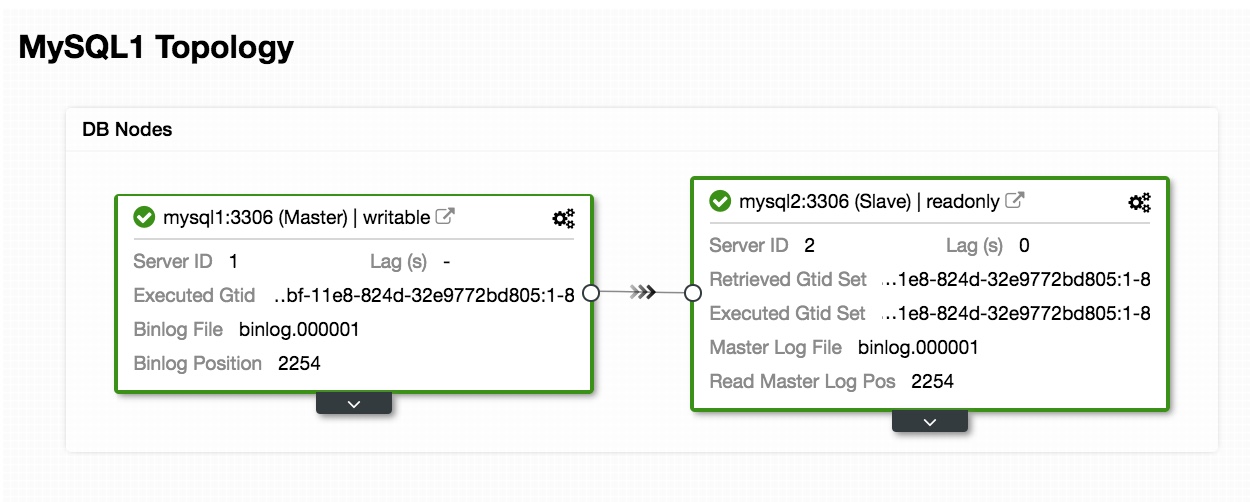
In ClusterControl Topology View, we can check our current topology with one master and one slave node.

Topology View Replication 1
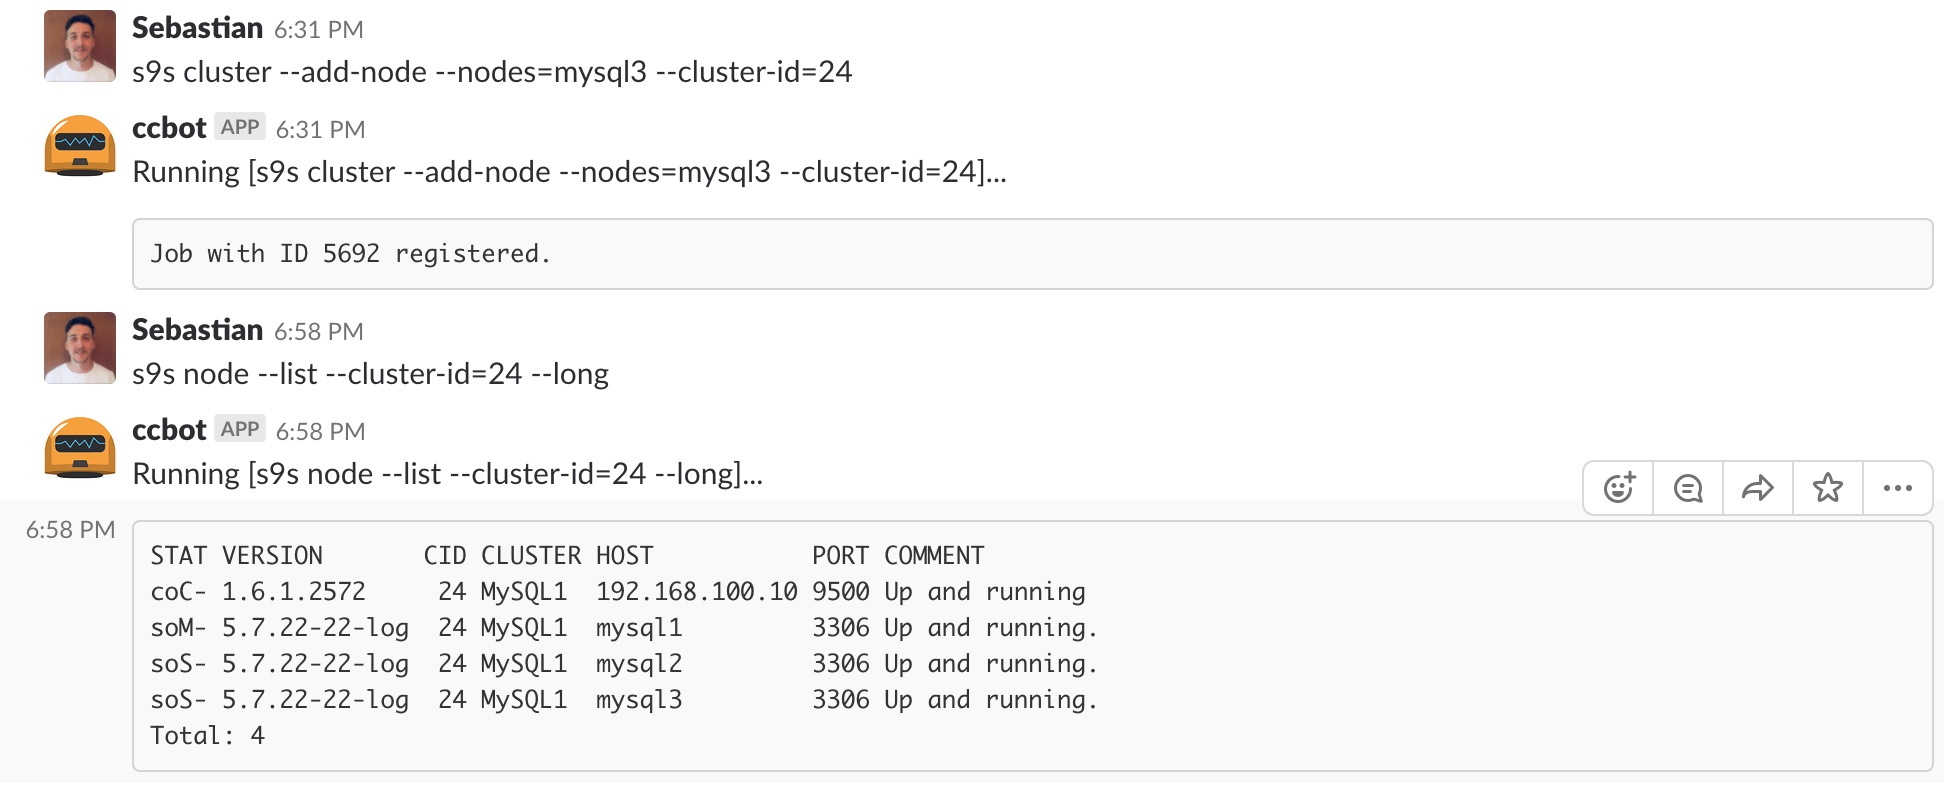
$ s9s cluster --add-node --nodes=mysql3 --cluster-id=24
CCBot Add Node
CCBot Add Node

With this command we can add a new slave in our current cluster.

Topology View Replication 2

And we can check our new topology in ClusterControl Topology View.

$ s9s cluster --add-node --cluster-id=24 --nodes="proxysql://proxysql"
CCBot Add ProxySQL
CCBot Add ProxySQL

With this command we can add a new ProxySQL node named "proxysql" in our current cluster.

Topology View Replication 3

And we can check our new topology in ClusterControl Topology View.

You can check the list of available commands in the documentation.
If we try to use CCBot from a Slack channel, we must add "@ccbot_name" at the beginning of our command:

@ccbot s9s backup --create --backup-method=xtrabackupfull --cluster-id=1 --nodes=10.0.0.5:3306 --backup-directory=/storage/backups

CCBot makes it easier for teams to manage their clusters in a collaborative way. It is fully integrated with the tools they use on a daily basis.

Note

If we have the following error when wanting to run the CCBot installer in our ClusterControl:

-bash: yo: command not found

We must update the version of nodejs package.

Conclusion

As we said previously, there are several ChatBot alternatives for different purposes, we can even create our own ChatBot, but as this technology facilitates our tasks and has several advantages that we mentioned at the beginning of this blog, not everything that shines is gold.

There is a very important detail to keep in mind - security. We must be very careful when using them, and take all the necessary precautions to know what we allow to do, in what way, at what moment, to whom and from where.

Decoding the MongoDB Error Logs

$
0
0

Sometimes decoding MongoDB error logs can be tricky and can consume big chunks of your valuable time. In this article, we will learn how to examine the MongoDB error logs by dissecting each part of the log messages.

Common Format for MongoDB Log Lines

Here is the log line pattern for version 3.0 and above...

<timestamp> <severity> <component> [<context>] <message>

Log line pattern for previous versions of MongoDB only included:

<timestamp> [<context>] <message>

Let’s look at each tag.

Timestamps

Timestamp field of log message stores the exact time when a log message was inserted in the log file. There are 4 types of timestamps supported by MongoDB. The default format is: iso8601-local. You can change it using --timeStampFormat parameter.

Timestamp Format NameExample
iso8601-local1969-12-31T19:00:00.000+0500
iso8601-utc1970-01-01T00:00:00.000Z
ctimeWed Dec 31 19:00:00.000
ctime-no-msWed Dec 31 19:00:00

Severity

The following table describes the meaning of all possible severity levels.

Severity LevelDescription
FFatal- The database error has caused the database to no longer be accessible
EError - Database errors which will stop DB execution.
WWarning - Database messages which explains potentially harmful behaviour of DB.
IInformational - Messages just for information purpose like ‘A new connection accepted’.
DDebug - Mostly useful for debugging the DB errors

Component

After version 3.0, log messages now include “component” to provide a functional categorization of the messages. This allows you to easily narrow down your search by looking at the specific components.

ComponentError Description
AccessRelated to access control
CommandRelated to database commands
ControlRelated to control activities
FTDCRelated to diagnostic data collection activities
GeoRelated to parsing geospatial shapes
IndexRelated to indexing operations
NetworkRelated to network activities
QueryRelated to queries
REPLRelated to replica sets
REPL_HBRelated to replica sets heartbeats
RollbackRelated to rollback db operations
ShardingRelated to sharding
StorageRelated to storage activities
JournalRelated to journal activities
WriteRelated to db write operations

Context

Context part of the error message generally contains the thread or connection id. Other values can be initandlisten. This part is surrounded by square brackets. Log messages of any new connection to MongoDB will have context value as initandlisten, for all other log messages, it will be either thread id or connection id. For e.g

2018-05-29T19:06:29.731+0000 [initandlisten] connection accepted from 127.0.0.1:27017 #1000 (13 connections now open)
2018-05-29T19:06:35.770+0000 [conn1000] end connection 127.0.0.1:27017 (12 connections now open)

Message

Contains the actual log message.

Log File Location

The default location on the server is: /var/log/mongodb/mongodb.log

If log file is not present at this location then you can check in the MongoDB config file. You can find MongoDB config file at either of these two locations.

/etc/mongod.conf or /yourMongoDBpath/mongod.conf

Once you open the config file, search for logpath option in it. logpath option tells MongoDB where to log all the messages.

Analyzing a Simple Log Message

Here is an example of a typical MongoDB error message...

2014-11-03T18:28:32.450-0500 I NETWORK [initandlisten] waiting for connections on port 27017

Timestamp: 2014-11-03T18:28:32.450-0500
Severity: I
Component: NETWORK
Context: [initandlisten]
Message: waiting for connections on port 27017

The most important part of this error is the message portion. In most of the cases, you can figure out the error by looking at this field. Sometimes if the message is not clear to you, then you can go for the component part. For this message, Component’s value is Network which means the log message is related to a network issue.

If you are not able to resolve your error, you can check the severity of the log message which says this message is for informational purpose. Further, you can also check out other parts of the log message like timestamp or context to find the complete root cause.

ClusterControl
Single Console for Your Entire Database Infrastructure
Find out what else is new in ClusterControl

Decoding Common Error Log Messages

  1. Message:

    2018-05-10T21:19:46.942 I CONTROL  [initandlisten] ** WARNING: Access control is not enabled for the database.

    Resolution: Create admin user in authentication database

  2. Message:

    2018-05-10T21:19:46.942 E COMMAND  [initandlisten] ** ERROR: getMore command failed. Cursor not found

    Resolution: Remove the timeout from the cursor or increase the cursor batch size.

  3. Message:

    2018-05-10T21:19:46.942 E INDEX  [initandlisten] ** ERROR:E11000 duplicate key error index: test.collection.$a.b_1 dup key: { : null }

    Resolution: Violation of unique key constraint. Try to insert document with different key.

  4. Message:

    2018-05-10T21:19:46.942 E NETWORK  [initandlisten] ** ERROR:Timed out connecting to localhost:27017.

    Resolution: Latency between the driver and the server is too great, the driver may give up. You can change setting by adding connectionTimeout option in connection string.

  5. Message:

    2018-05-10T21:19:46.942 E WRITE  [initandlisten] ** ERROR: A write operation resulted in an error. E11000 duplicate key error index: test.people.$_id_ dup key: { : 0 }

    Resolution: Remove duplication of _id field value from conflicting documents.

  6. Message:

    2018-05-10T21:19:46.942 E NETWORK  [initandlisten] ** ERROR: No connection could be made because the target machine actively refused it 127.0.0.1:27017 at System.Net.Sockets.Socket.EndConnect

    Resolution: Either server is not running on port 27017 or try to restart the server with correct host and port.

Log Management Tools

MongoDB 3.0 has updated its logging features to provide better insights for all database activities. There are many log management tools available in the market like MongoDB Ops Manager, log entries, mtools etc.

Conclusion

Logging is as important as Replication or Sharding for good and proper database management. For better database management, one should be able to decode the logs easily to rectify the exceptions/errors quickly. I hope that after reading this tutorial, you will feel more comfortable while analyzing complex MongoDB logs.

How to Optimize Performance of MongoDB

$
0
0

Excellent database performance is important when you are developing applications with MongoDB. Sometimes the overall data serving process may become degraded due to a number of reasons, some of which include:

  • Inappropriate schema design patterns
  • Improper use of or no use of indexing strategies
  • Inadequate hardware
  • Replication lag
  • Poorly performing querying techniques

Some of these setbacks might force you to increase hardware resources while others may not. For instance, poor query structures may result in the query taking a long time to be processed, causing replica lag and maybe even some data loss. In this case, one may think that maybe the storage memory is not enough, and that it probably needs scaling up. This article discusses the most appropriate procedures you can employ to boost the performance of your MongoDB database.

Schema Design

Basically the two most commonly employed schema relationships are...

  • One-to-Few
  • One-to-Many

While the most efficient schema design is the One-to-Many relationship, each has got its own merits and limitations.

One-to-Few

In this case, for a given field, there are embedded documents but they are not indexed with object identity.

Here is a simple example:

{
      userName: "Brian Henry",
      Email : "example@gmail.com",
      grades: [
             {subject: ‘Mathematics’,  grade: ‘A’},
             {subject: English,  grade: ‘B’},
      ]
}

One advantage of using this relationship is that you can get the embedded documents with just a single query. However, from a querying standpoint, you cannot access a single embedded document. So if you are not going to reference embedded documents separately, it will be optimal to use this schema design.

One-to-Many

For this relationship data in one database is related to data in a different database. For example, you can have a database for users and another for posts. So if a user makes a post it is recorded with user id.

Users schema

{ 
    Full_name: “John Doh”,
    User_id: 1518787459607.0
}

Posts schema

{
    "_id" : ObjectId("5aa136f0789cf124388c1955"),
    "postTime" : "16:13",
    "postDate" : "8/3/2018",
    "postOwnerNames" : "John Doh",
    "postOwner" : 1518787459607.0,
    "postId" : "1520514800139"
}

The advantage with this schema design is that the documents are considered as standalone (can be selected separately). Another advantage is that this design enables users of different ids to share information from the posts schema (hence the name One-to-Many) and sometimes can be “N-to-N” schema - basically without using table join. The limitation with this schema design is that you have to do at least two queries to fetch or select data in the second collection.

How to model the data will therefore depend on the application’s access pattern. Besides this you need to consider the schema design we have discussed above.

Optimization Techniques for Schema Design

  1. Employ document embedding as much as possible as it reduces the number of queries you need to run for a particular set of data.

  2. Don’t use denormalization for documents that are frequently updated. If anfield is going to be frequently updated, then there will be the task of finding all the instances that need to be updated. This will result in slow query processing, hence overwhelming even the merits associated with denormalization.

  3. If there is a need to fetch a document separately, then there is no need to use embedding since complex queries such as aggregate pipelining take more time to execute.

  4. If the array of documents to be embedded is large enough, don’t embed them. The array growth should at least have a bound limit.

Proper Indexing

This is the more critical part of performance tuning and requires one to have a comprehensive understanding on the application queries, ratio of reads to writes, and how much free memory your system has. If you use an index, then the query will scan the index and not the collection.

An excellent index is one that involves all the fields scanned by a query. This is referred to as a compound index.

To create a single index for a fields you can use this code:

db.collection.createIndex({“fields”: 1})

For a compound index, to create the indexing:

db.collection.createIndex({“filed1”: 1, “field2”:  1})

Besides faster querying by use of indexing, there is an addition advantage of other operations such as sort, samples and limit. For example, if I design my schema as {f: 1, m:1} i can do an additional operation apart from find as

db.collection.find( {f: 1} ).sort( {m: 1} )

Reading data from RAM is more efficient that reading the same data from disk. For this reason, it is always advised to ensure that your index fits entirely in the RAM. To get the current indexSize of your collection, run the command :

db.collection.totalIndexSize()

You will get a value like 36864 bytes. This value should also not be taking a large percentage of the overall RAM size, since you need to cater for the needs of the entire working set of the server.

An efficient query should also enhance Selectivity. Selectivity can be defined as the ability of a query to narrow the result using the index. To be more secant, your queries should limit the number of possible documents with the indexed field. Selectivity is mostly associated with a compound index which includes a low-selectivity field and another field. For example if you have this data:

{ _id: ObjectId(), a: 6, b: "no", c: 45 }
{ _id: ObjectId(), a: 7, b: "gh", c: 28 }
{ _id: ObjectId(), a: 7, b: "cd", c: 58 }
{ _id: ObjectId(), a: 8, b: "kt", c: 33 }

The query {a: 7, b: “cd”} will scan through 2 documents to return 1 matching document. However if the data for the value a is evenly distributed i.e

{ _id: ObjectId(), a: 6, b: "no", c: 45 }
{ _id: ObjectId(), a: 7, b: "gh", c: 28 }
{ _id: ObjectId(), a: 8, b: "cd", c: 58 }
{ _id: ObjectId(), a: 9, b: "kt", c: 33 }

The query {a: 7, b: “cd”} will scan through 1 document and return this document. Hence this will take shorter time than the first data structure.

ClusterControl
Single Console for Your Entire Database Infrastructure
Find out what else is new in ClusterControl

Resources Provisioning

Inadequate storage memory, RAM and other operating parameters can drastically degrade the performance of a MongoDB. For instance, if the number of user connections is very large, it will hinder the ability of the server application from handling requests in a timely manner. As discussed in Key things to monitor in MongoDB, you can get an overview of which limited resources you have and how you can scale them to suit your specifications. For a large number of concurrent application requests, the database system will be overwhelmed in keeping up with the demand.

Replication Lag

Sometimes you may notice some data missing from your database or when you delete something, it appears again. As much as you could have well designed schema, appropriate indexing and enough resources, in the beginning your application will run smoothly without any hiccups but then at some point you notice the latter mentioned problems. MongoDB relies on replication concept where data is redundantly copied to meet some design criteria. An assumption with this is that the process is instantaneous. However, some delay may occur maybe due to network failure or unhandled errors. In a nutshell, there will be a large gap between the time with which an operation is processed on the primary node and the time it will be applied in the secondary node.

Setbacks with Replica Lags

  1. Inconsistent data. This is especially associated with read operations that are distributed across secondaries.

  2. If the lag gap is wide enough, then a lot of unreplicated data may be on the primary node and will need to be reconciled in the secondary node. At some point, this may be impossible especially when the primary node cannot be recovered.

  3. Failure to recover the primary node can force one to run a node with data which is not up to date and consequently may drop the whole database in order to make the primary to recover.

Causes of the Secondary Node Failure

  1. Outmatching primary power over the secondary regarding the CPU, disk IOPS and network I/O specifications.

  2. Complex write operations. For example a command like

    db.collection.update( { a: 7}  , {$set: {m: 4} }, {multi: true} )

    The primary node will record this operation in the oplog quick enough. However, for the secondary node, it has to fetch those ops, read into RAM any index and data pages in order to meet some criteria specifications such as the id. Since it has to do this quick enough in order to keep the rate with the primary node does the operation, if the number of ops is large enough then there will be an expected lag.

  3. Locking of the secondary when making a backup. In this case we may forget to disable the primary hence will continue with its operations as normal. At the time when the lock will be released, replication lag will have be of a large gap especially when dealing with a huge amount of data backup.

  4. Index building. If an index builds up in the secondary node, then all other operations associated with it are blocked. If the index is long-running then the replication lag hiccup will be encountered.

  5. Unconnected secondary. Sometimes the secondary node may fail due to network disconnections and this results in a replication lag when it is reconnected.

How to Minimize the Replication Lag

  • Use unique indexes besides your collection having the _id field. This is to avoid the replication process from failing completely.

  • Consider other types of backup such as point-in-time and filesystem snapshots which not necessarily require locking.

  • Avoid building large indexes since they cause background blocking operation.

  • Make the secondary powerful enough. If the write operation is of lightweight, then using underpowered secondaries will be economical. But, for heavy write loads, the secondary node may lag behind the primary. To be more seccant, the secondary should have enough bandwidth to help reading oplogs fast enough in order to keep its rate with the primary node.

Efficient Query Techniques

Beside creating indexed queries and using Query Selectivity as discussed above, there are other concepts you can employ to fasten and make your queries effective.

Optimizing Your Queries

  1. Using a covered query. A covered query is one which is always completely satisfied by an index hence does not need to examine any document. The covered query therefore should have all fields as part of the index and consequently the result should contain all these fields.

    Let’s consider this example:

    {_id: 1, product: { price: 50 }

    If we create an index for this collection as

    {“product.price”: 1} 

    Considering a find operation, then this index will cover this query;

    db.collection.find( {“product.price”: 50}, {“product.price”: 1, _id: 0}  )

    and return the product.price field and value only.

  2. For embedded documents, use the dot notation (.). The dot notation helps in accessing elements of an array and fields of embedded document.

    Accessing an array:

    {
       prices: [12, 40, 100, 50, 40]  
    }

    To specify the fourth element for example, you can write this command:

    “prices.3”

    Accessing an object array:

    {
    
       vehicles: [{name: toyota, quantity: 50},
                 {name: bmw, quantity: 100},
                 {name: subaru, quantity: 300}                    
    } 

    To specify the name field in the vehicles array you can use this command

    “vehicles.name”
  3. Check if a query is is covered. To do this use the db.collection.explain(). This function will provide information on the execution of other operations -e.g. db.collection.explain().aggregate(). To learn more about the explain function you can check out explain().

In general, the supreme technique as far as querying is concerned is using indexes. Querying only an index is much faster than querying documents outside of the index. They can fit in memory hence available in RAM rather than in disk. This makes the easy and fast enough to fetch them from memory.

A Performance Cheat Sheet for PostgreSQL

$
0
0

Performance is one of the most important and most complex tasks when managing a database. It can be affected by the configuration, the hardware or even the design of the system. By default, PostgreSQL is configured with compatibility and stability in mind, since the performance depends a lot on the hardware and on our system itself. We can have a system with a lot of data being read but the information does not change frequently. Or we can have a system that writes continuously. For this reason, it is impossible to define a default configuration that works for all types of workloads.

In this blog, we will see how one goes about analyzing the workload, or queries, that are running. We shall then review some basic configuration parameters to improve the performance of our PostgreSQL database. As we mentioned, we will see only some of the parameters. The list of PostgreSQL parameters is extensive, we would only touch on some of the key ones. However, one can always consult the official documentation to delve into the parameters and configurations that seem most important or useful in our environment.

EXPLAIN

One of the first steps we can take to understand how to improve the performance of our database is to analyze the queries that are made.

PostgreSQL devises a query plan for each query it receives. To see this plan, we will use EXPLAIN.

The structure of a query plan is a tree of plan nodes. The nodes in the lower level of the tree are scan nodes. They return raw rows from a table. There are different types of scan nodes for different methods of accessing the table. The EXPLAIN output has a line for each node in the plan tree.

world=# EXPLAIN SELECT * FROM city t1,country t2 WHERE id>100 AND t1.population>700000 AND t2.population<7000000;
                               QUERY PLAN                                
--------------------------------------------------------------------------
Nested Loop  (cost=0.00..734.81 rows=50662 width=144)
  ->  Seq Scan on city t1  (cost=0.00..93.19 rows=347 width=31)
        Filter: ((id > 100) AND (population > 700000))
  ->  Materialize  (cost=0.00..8.72 rows=146 width=113)
        ->  Seq Scan on country t2  (cost=0.00..7.99 rows=146 width=113)
              Filter: (population < 7000000)
(6 rows)

This command shows how the tables in our query will be scanned. Let's see what these values correspond to that we can observe in our EXPLAIN.

  • The first parameter shows the operation that the engine is performing on the data in this step.
  • Estimated start-up cost. This is the time spent before the output phase can begin.
  • Estimated total cost. This is stated on the assumption that the plan node is run to completion. In practice, a node's parent node might stop short of reading all available rows.
  • Estimated number of rows output by this plan node. Again, the node is assumed to be run to completion.
  • Estimated average width of rows output by this plan node.

The most critical part of the display is the estimated statement execution cost, which is the planner's guess at how long it will take to run the statement. When comparing how effective one query is against the other, we will in practice be comparing the cost values of them.

It's important to understand that the cost of an upper-level node includes the cost of all its child nodes. It's also important to realize that the cost only reflects things that the planner cares about. In particular, the cost does not consider the time spent transmitting result rows to the client, which could be an important factor in the real elapsed time; but the planner ignores it because it cannot change it by altering the plan.

The costs are measured in arbitrary units determined by the planner's cost parameters. Traditional practice is to measure the costs in units of disk page fetches; that is, seq_page_cost is conventionally set to 1.0 and the other cost parameters are set relative to that.

EXPLAIN ANALYZE

With this option, EXPLAIN executes the query, and then displays the true row counts and true run time accumulated within each plan node, along with the same estimates that a plain EXPLAIN shows.

Let's see an example of the use of this tool.

world=# EXPLAIN ANALYZE SELECT * FROM city t1,country t2 WHERE id>100 AND t1.population>700000 AND t2.population<7000000;
                                                     QUERY PLAN                                                      
----------------------------------------------------------------------------------------------------------------------
Nested Loop  (cost=0.00..734.81 rows=50662 width=144) (actual time=0.081..22.066 rows=51100 loops=1)
  ->  Seq Scan on city t1  (cost=0.00..93.19 rows=347 width=31) (actual time=0.069..0.618 rows=350 loops=1)
        Filter: ((id > 100) AND (population > 700000))
        Rows Removed by Filter: 3729
  ->  Materialize  (cost=0.00..8.72 rows=146 width=113) (actual time=0.000..0.011 rows=146 loops=350)
        ->  Seq Scan on country t2  (cost=0.00..7.99 rows=146 width=113) (actual time=0.007..0.058 rows=146 loops=1)
              Filter: (population < 7000000)
              Rows Removed by Filter: 93
Planning time: 0.136 ms
Execution time: 24.627 ms
(10 rows)

If we do not find the reason why our queries take longer than they should, we can check this blog for more information.

VACUUM

The VACUUM process is responsible for several maintenance tasks within the database, one of them recovering storage occupied by dead tuples. In the normal operation of PostgreSQL, tuples that are deleted or obsoleted by an update are not physically removed from their table; they remain present until a VACUUM is performed. Therefore, it is necessary to do the VACUUM periodically, especially in frequently updated tables.

If the VACUUM is taking too much time or resources, it means that we must do it more frequently, so that each operation has less to clean.

In any case you may need to disable the VACUUM, for example when loading data in large quantities.

The VACUUM simply recovers space and makes it available for reuse. This form of the command can operate in parallel with the normal reading and writing of the table, since an exclusive lock is not obtained. However, the additional space is not returned to the operating system (in most cases); it is only available for reuse within the same table.

VACUUM FULL rewrites all the contents of the table in a new disk file without additional space, which allows the unused space to return to the operating system. This form is much slower and requires an exclusive lock on each table while processing.

VACUUM ANALYZE performs a VACUUM and then an ANALYZE for each selected table. This is a practical way of combining routine maintenance scripts.

ANALYZE collects statistics on the contents of the tables in the database and stores the results in pg_statistic. Subsequently, the query planner uses these statistics to help determine the most efficient execution plans for queries.

Download the Whitepaper Today
 
PostgreSQL Management & Automation with ClusterControl
Learn about what you need to know to deploy, monitor, manage and scale PostgreSQL

Configuration parameters

To modify these parameters we must edit the file $ PGDATA / postgresql.conf. We must bear in mind that some of them require a restart of our database.

max_connections

Determines the maximum number of simultaneous connections to our database. There are memory resources that can be configured per client, therefore, the maximum number of clients can suggest the maximum amount of memory used.

superuser_reserved_connections

In case of reaching the limit of max_connection, these connections are reserved for superuser.

shared_buffers

Sets the amount of memory that the database server uses for shared memory buffers. If you have a dedicated database server with 1 GB or more of RAM, a reasonable initial value for shared_buffers is 25% of your system's memory. Larger configurations for shared_buffers generally require a corresponding increase in max_wal_size, to extend the process of writing large amounts of new or modified data over a longer period of time.

temp_buffers

Sets the maximum number of temporary buffers used for each session. These are local session buffers used only to access temporary tables. A session will assign the temporary buffers as needed up to the limit given by temp_buffers.

work_mem

Specifies the amount of memory that will be used by the internal operations of ORDER BY, DISTINCT, JOIN, and hash tables before writing to the temporary files on disk. When configuring this value we must take into account that several sessions be executing these operations at the same time and each operation will be allowed to use as much memory as specified by this value before it starts to write data in temporary files.

This option was called sort_mem in older versions of PostgreSQL.

maintenance_work_mem

Specifies the maximum amount of memory that maintenance operations will use, such as VACUUM, CREATE INDEX, and ALTER TABLE ADD FOREIGN KEY. Since only one of these operations can be executed at the same time by a session, and an installation usually does not have many of them running simultaneously, it can be larger than the work_mem. Larger configurations can improve performance for VACUUM and database restores.

When the autovacuum is executed, this memory can be assigned the number of times in which the autovacuum_max_workers parameter is configured, so we must take this into account, or otherwise, configure the autovacuum_work_mem parameter to manage this separately.

fsync

If fsync is enabled, PostgreSQL will try to make sure that the updates are physically written to the disk. This ensures that the database cluster can be recovered to a consistent state after an operating system or hardware crash.

While disabling fsync generally improves performance, it can cause data loss in the event of a power failure or a system crash. Therefore, it is only advisable to deactivate fsync if you can easily recreate your entire database from external data.

checkpoint_segments (PostgreSQL < 9.5)

Maximum number of record file segments between automatic WAL control points (each segment is normally 16 megabytes). Increasing this parameter can increase the amount of time needed to recover faults. In a system with a lot of traffic, it can affect the performance if it is set to a very low value. It is recommended to increase the value of checkpoint_segments on systems with many data modifications.

Also, a good practice is to save the WAL files on a disk other than PGDATA. This is useful both for balancing the writing and for security in case of hardware failure.

As of PostgreSQL 9.5 the configuration variable "checkpoint_segments" was removed, and was replaced by "max_wal_size" and "min_wal_size"

max_wal_size (PostgreSQL >= 9.5)

Maximum size the WAL is allowed to grow between the control points. The size of WAL can exceed max_wal_size in special circumstances. Increasing this parameter can increase the amount of time needed to recover faults.

min_wal_size (PostgreSQL >= 9.5)

When the WAL file is kept below this value, it is recycled for future use at a checkpoint, instead of being deleted. This can be used to ensure that enough WAL space is reserved to handle spikes in the use of WAL, for example when executing large batch jobs.

wal_sync_method

Method used to force WAL updates to the disk. If fsync is disabled, this setting has no effect.

wal_buffers

The amount of shared memory used for WAL data that has not yet been written to disk. The default setting is about 3% of shared_buffers, not less than 64KB or more than the size of a WAL segment (usually 16MB). Setting this value to at least a few MB can improve write performance on a server with many concurrent transactions.

effective_cache_size

This value is used by the query planner to take into account plans that may or may not fit in memory. This is taken into account in the cost estimates of using an index; a high value makes it more likely that index scans are used and a low value makes it more likely that sequential scans will be used. A reasonable value would be 50% of the RAM.

default_statistics_target

PostgreSQL collects statistics from each of the tables in its database to decide how queries will be executed on them. By default, it does not collect too much information, and if you are not getting good execution plans, you should increase this value and then run ANALYZE in the database again (or wait for the AUTOVACUUM).

synchronous_commit

Specifies whether the transaction commit will wait for the WAL records to be written to disk before the command returns a "success" indication to the client. The possible values ​​are: "on", "remote_apply", "remote_write", "local" and "off". The default setting is "on". When it is disabled, there may be a delay between the time the client returns, and when the transaction is guaranteed to be secure against a server lock. Unlike fsync, disabling this parameter does not create any risk of database inconsistency: a crash of the operating system or database may result in the loss of some recent transactions allegedly committed, but the state of the database will be exactly the same as if those transactions had been cancelled cleanly. Therefore, deactivating synchronous_commit can be a useful alternative when performance is more important than the exact certainty about the durability of a transaction.

Logging

There are several types of data to log that may be useful or not. Let's see some of them:

  • log_min_error_statement: Sets the minimum logging level.
  • log_min_duration_statement: Used to record slow queries in the system.
  • log_line_prefix: Adheres information at the beginning of each log line.
  • log_statement: You can choose between NONE, DDL, MOD, ALL. Using "all" can cause performance problems.

Design

In many cases, the design of our database can affect performance. We must be careful in our design, normalizing our schema and avoiding redundant data. In many cases it is convenient to have several small tables instead of one huge table. But as we said before, everything depends on our system and there is not a single possible solution.

We must also use the indexes responsibly. We should not create indexes for each field or combination of fields, since, although we do not have to travel the entire table, we are using disk space and adding overhead to write operations.

Another very useful tool is the management of connection pool. If we have a system with a lot of load, we can use this to avoid saturating the connections in the database and to be able to reuse them.

Hardware

As we mentioned at the beginning of this blog, hardware is one of the important factors that directly affect the performance of our database. Let's see some points to keep in mind.

  • Memory: The more RAM we have, the more memory data we can handle, and that means better performance. The speed of writing and reading on disk is much slower than in memory, therefore, the more information we can have in memory, the better performance we will have.
  • CPU: Maybe it does not make much sense to say this, but the more CPU we have, the better. In any case it is not the most important in terms of hardware, but if we can have a good CPU, our processing capacity will improve and that directly impacts our database.
  • Hard disk: We have several types of discs that we can use, SCSI, SATA, SAS, IDE. We also have solid state disks. We must compare quality / price, which we should use to compare its speed. But the type of disk is not the only thing to consider, we must also see how to configure them. If we want good performance, we can use RAID10, keeping the WALs on another disk outside the RAID. It is not recommended to use RAID5 since the performance of this type of RAID for databases is not good.

Conclusion

After taking into account the points mentioned in this blog, we can perform a benchmark to verify the behavior of the database.

It is also important to have our database monitored to determine if we are facing a performance problem and to be able to solve it as soon as possible. For this task there are several tools such as Nagios, ClusterControl or Zabbix, among others, that allow us not only to monitor, but with some of them, allows us to take proactive action before the problem occurs. With ClusterControl, in addition to monitoring, administration and several other utilities, we can receive recommendations on what actions we can take when receiving performance alerts. This allows us to have an idea of how to solve potential problems.

This blog is not intended to be an exhaustive guide to how to improve database performance. Hopefully, It gives a clearer picture of what things can become important and some of the basic parameters that can be configured. Do not hesitate to let us know if we’ve missed any important ones.

Comparing RDS vs EC2 for Managing MySQL or MariaDB on AWS

$
0
0

RDS is a Database as a Service (DBaaS) that automatically configures and maintains your databases in the AWS cloud. The user has limited power over specific configurations in comparison to running MySQL directly on Elastic Compute Cloud (EC2). But RDS is a convenient service, as long as you can live with the instances and configurations that it offers.

Amazon RDS currently supports various MySQL and MariaDB versions as well as the, MySQL-compatible Amazon Aurora DB engine. It does support replication, but as you may expect from a predefined web console, there are some limitations.

Amazon RDS Services
Amazon RDS Services

There are some tradeoffs when using RDS. These may not only affect the way you manage and provision your database instances, but also key things like performance, security, and high availability.

In this blog, we will take a look at the differences between using RDS and running MySQL on EC2, with focus on replication. As we will see, to decide between hosting MySQL on an EC2 instance or using Amazon RDS is not an easy task.

RDS Platform Tradeoffs

The biggest size of database that AWS can host depends on your source environment, the allocation of data in your source database, and how busy your system is.

Amazon RDS Environment options
Amazon RDS instance class

AWS is split into regions. Every AWS account has limits, per region, on the number of AWS resources that can be created. Once a limit for a resource has been reached, additional calls to create that resource will fail.

AWS Regions
AWS Regions

For Amazon RDS MySQL DB instances, the maximum provisioned storage limit constrains the size of a table to a maximum size of 6 TB when using InnoDB file-per-table tablespaces.

InnoDB file-per-table feature is something that you should consider even if you are not looking to migrate a big database into the cloud. You may notice that some existing DB instances have a lower limit. For example, MySQL DB instances created prior to April 2014 have a file and table size limit of 2 TB. This 2-TB file size limit also applies to DB instances or Read Replicas created from DB snapshots taken before April 2014.

One of the key differences which affects the way you set up and maintain database replication is the lack of SUPER user. To address this limitation, Amazon introduced stored procedures that take care of various DBA tasks. Below are the key procedures to manage MySQL RDS replication.

Skip replication error:

CALL mysql.rds_skip_repl_error;

Stop replication:

CALL mysql.rds_stop_replication;

Start replication

CALL mysql.rds_start_replication;

Configures an RDS instance as a Read Replica of a MySQL instance running outside of AWS.

CALL mysql.rds_set_external_master;

Reconfigures a MySQL instance to no longer be a Read Replica of a MySQL instance running outside of AWS.

CALL mysql.rds_reset_external_master;

Imports a certificate. This is needed to enable SSL communication and encrypted replication.

CALL mysql.rds_import_binlog_ssl_material;

Removes a certificate.

CALL mysql.rds_remove_binlog_ssl_material;

Changes the replication master log position to the start of the next binary log on the master.

CALL mysql.rds_next_master_log;

While stored procedures take care of a number of tasks, it is a bit of a learning curve. Lack of SUPER privilege can also create problems in using external replication monitoring.

Amazon RDS does not currently support the following:

  • Global Transaction IDs
  • Transportable Table Space
  • Authentication Plugin
  • Password Strength Plugin
  • Replication Filters
  • Semi-synchronous Replication

Last but not least - access to the shell. Amazon RDS does not allow direct host access to a DB instance via Telnet, Secure Shell (SSH), or Windows Remote Desktop Connection (RDP). You can still use the client on an application host to connect to the DB via standard tools like mysql client.

There are other limitations, as described in the RDS documentation.

High availability with MySQL on EC2

There are options to operate MySQL directly on EC2, and thereby retain control of one’s high availability options. When going down this route, it is important to understand how to leverage the different AWS features that are at your disposal. Make sure you check out our ‘DIY Cloud Database’ white paper.

To automate deployment and management/maintenance tasks (while retaining control), it is possible to use ClusterControl. Just like with RDS, you have the convenience of deploying a database setup in a few minutes via a GUI. Adding nodes, scheduling backups, performing failovers, and so on, can also be conveniently done via the GUI.

Deployment

ClusterControl can automate deployment of different high availability database setups - from master-slave replication to multi-master clusters. All the main MySQL flavours are supported - Oracle MySQL, MariaDB and Percona Server. Some initial setup of VPC/security group is required, and these are well described in the DIY Cloud Database whitepaper. Note that similar concepts apply, whether it is AWS or Google Cloud or Azure

ClusterControl Deploy in EC2

Galera Cluster is a good alternative to consider when deploying a highly available MySQL service. It has established itself as a credible replacement for traditional MySQL master-slave architectures, although it is not a drop-in replacement. Most applications can still be adapted to run on it. It is possible to define different segments for databases that span across multiple AWS regions.

ClusterControl expand cluster in EC2

It is possible to setup ‘hybrid replication’ by combining synchronous replication within a Galera Cluster and asynchronous replication between the cluster and one or more slaves. Options like delaying the slave gives an additional level of protection to the data.

ClusterControl Add replication in EC2

Proxy layer

To achieve high availability, deploying a highly available setup is not enough. The applications have to somehow know which nodes are working and which ones are not. Changes in topology, e.g. moving a master to another host, also need to be propagated somehow so as to avoid errors in the application layer. ClusterControl supports deployments of proxies like HAProxy, MaxScale, and ProxySQL. For HAProxy and ProxySQL, there are additional options to deploy redundant instances with Keepalived and VirtualIP.

ClusterControl manager load balancers on EC2 nodes

Cross-region replica

Amazon RDS provides read replica services. Cross-region replicas give you the ability to scale reads, as AWS has its services in a number of datacenters around the world. All read replicas are accessible and can be used for reading in a maximum number of five regions. These nodes are independent and can be used in your upgrade path, or can be promoted to standalone databases.

In addition to that, Amazon offers Multi-AZ deployments based on DRBD, synchronous disk replication. How is it different from Read Replicas? The main difference is that only the database engine on the primary instance is active, which leads to other architectural variations.

As opposed to read replicas, database engine version upgrades happen on the primary. Another difference is that AWS RDS will failover automatically with DRBD, while read replicas (using asynchronous replication) will require manual operations from you.

Multi-AZ failover on RDS uses a DNS change to point to the standby instance, according to Amazon this should happen within 60-120 seconds during the failover. Because the standby uses the same storage data as the primary, there will probably be transaction/log recovery. Bigger databases may spend a significant amount of time on InnoDB recovery, so please consider that in your DR plan and RTO calculation.

Of course, this goes with additional cost. Let’s take a look at some basic example. The cost of db.t2.medium host with 2vCPU, 4GB ram is 185.98 USD per month, the price will double when you enable Multizone (MZ) replica to 370.98 UDB. The price will vary by region but it will double in MZ.

Cost comparision
Cost comparision
Cost comparision
Cost comparision
Cost comparision

In order to achieve the same with EC2, you can deploy your virtual machines in different regions. Each AWS Region is completely independent. The setting of AWS Region can be changed in the console, by setting the EC2_REGION environment variable, or it can be overridden by using the --region parameter with the AWS Command Line Interface. When your set of servers are ready, you can use ClusterControl to deploy and monitor your replication. You can also manually set up replication through the console using standard commands.

Cross technology replication

It is possible to setup replication between an Amazon RDS MySQL or MariaDB DB instance and a MySQL or MariaDB instance that is external to Amazon RDS. This is done using standard replication method in mysql, through binary logs. To enable binary logs, you need to modify the my.cnf configuration. Without access to the shell, this task became impossible in RDS. It's done in a not so obvious way. You have two options. One is to enable backups - set automated backups on your Amazon RDS DB instance with retention to higher than 0. Or enable replication to a prebuilt slave server. Both tasks will enable binary logs which you can later on use for your replication.

Enable binary logs via RDS backup

Maintain the binlogs in your master instance until you have verified that they have been applied on the replica. This maintenance ensures that you can restore your master instance in the event of a failure.

Another roadblock can be permissions. The permissions required to start replication on an Amazon RDS DB instance are restricted and not available to your Amazon RDS master user. Because of this, you must use the Amazon RDS mysql.rds_set_external_master and mysql.rds_start_replication commands to set up replication between your live database and your Amazon RDS database.

Monitor failover events for the Amazon RDS instance that is your replica. If a failover occurs, then the DB instance that is your replica might be recreated on a new host with a different network address. For information on how to monitor failover events, see Using Amazon RDS Event Notification.

In the below example, we will see how to enable replication from RDS to an external DB located on an EC2 instance.
You should have binary logs enabled, we use an RDS slave here.

Specify the number of hours to retain binary logs.

mysql -h RDS_MASTER -u<username> -u<password>
call mysql.rds_set_configuration('binlog retention hours', 7);

On RDS MASTER, create replication user with the following commands:

CREATE USER 'repl'@'ec2DBslave' IDENTIFIED BY 's3cr3tp4SSw0rd';
GRANT REPLICATION SLAVE ON *.* TO 'repl'@'ec2DBslave';

On RDS SLAVE, run the commands:

mysql -u<username> -u<password> -h RDS_SLAVE
call mysql.rds_stop_replication;
SHOW SLAVE STATUS;  Exec_Master_Log_Pos, Relay_Master_Log_File.

On RDS SLAVE, run mysqldump with the following format:

mysqldump -u<username> -u<password> -h RDS_SLAVE --routines --triggers --single-transaction --databases DB1 DB2 DB3 > mysqldump.sql

Import the DB dump to external database:

mysql -u<username> -u<password> -h ec2DBslave
tee import_database.log;
source mysqldump.sql;
CHANGE MASTER TO 
 MASTER_HOST='RDS_MASTER', 
 MASTER_USER='repl',
 MASTER_PASSWORD='s3cr3tp4SSw0rd',
 MASTER_LOG_FILE='<Relay_Master_Log_File>',
 MASTER_LOG_POS=<Exec_Master_Log_Pos>;

Create a replication filter to ignore tables created by AWS only on RDS

CHANGE REPLICATION FILTER REPLICATE_WILD_IGNORE_TABLE = ('mysql.rds\_%');

Start replication

START SLAVE;

Verify replication status

SHOW SLAVE STATUS;

That’s it for now. Managing MySQL on AWS is a big topic. Do let us know your thoughts in the comments section below.

Using pg_dump and pg_dumpall to Backup PostgreSQL

$
0
0

Businesses and services deliver value based on data. Availability, consistent state, and durability are top priorities for keeping customers and end-users satisfied. Lost or inaccessible data could possibly equate to lost customers.

Database backups should be at the forefront of daily operations and tasks.

We should be prepared for the event that our data becomes corrupted or lost.

I'm a firm believer in an old saying I’ve heard: "It's better to have it and not need it than to need it and not have it."

That applies to database backups as well. Let's face it, without them, you basically have nothing. Operating on the notion that nothing can happen to your data is a fallacy.

Most DBMS's provide some means of built-in backup utilities. PostgreSQL has pg_dump and pg_dumpall out of the box.

Both present numerous customization and structuring options. Covering them all individually in one blog post would be next to impossible. Instead, I'll look at those examples I can apply best, to my personal development/learning environment.

That being said, this blog post is not targeted at a production environment. More likely, a single workstation/development environment should benefit the most.

What are pg_dump and pg_dumpall?

The documentation describes pg_dump as: “pg_dump is a utility for backing up a PostgreSQL database”

And the pg_dumpall documentation: “pg_dumpall is a utility for writing out (“dumping”) all PostgreSQL databases of a cluster into one script file.”

Backing up a Database and/or Table(s)

To start, I'll create a practice database and some tables to work with using the below SQL:

postgres=# CREATE DATABASE example_backups;
CREATE DATABASE
example_backups=# CREATE TABLE students(id INTEGER,
example_backups(# f_name VARCHAR(20),
example_backups(# l_name VARCHAR(20));
CREATE TABLE
example_backups=# CREATE TABLE classes(id INTEGER,
example_backups(# subject VARCHAR(20));
CREATE TABLE
example_backups=# INSERT INTO students(id, f_name, l_name)
example_backups-# VALUES (1, 'John', 'Thorn'), (2, 'Phil', 'Hampt'),
example_backups-# (3, 'Sue', 'Dean'), (4, 'Johnny', 'Rames');
INSERT 0 4
example_backups=# INSERT INTO classes(id, subject)
example_backups-# VALUES (1, 'Math'), (2, 'Science'),
example_backups-# (3, 'Biology');
INSERT 0 3
example_backups=# \dt;
         List of relations
Schema |   Name | Type  | Owner
--------+----------+-------+----------
public | classes  | table | postgres
public | students | table | postgres
(2 rows)
example_backups=# SELECT * FROM students;
id | f_name | l_name
----+--------+--------
 1 | John   | Thorn
 2 | Phil   | Hampt
 3 | Sue    | Dean
 4 | Johnny | Rames
(4 rows)
example_backups=# SELECT * FROM classes;
id | subject
----+---------
 1 | Math
 2 | Science
 3 | Biology
(3 rows)

Database and tables all set up.

To note:

In many of these examples, I'll take advantage of psql's \! meta-command, allowing you to either drop into a shell (command-line), or execute whatever shell commands that follow.

Just be aware that in a terminal or command-line session (denoted by a leading '$' in this blog post), the \! meta-command should not be included in any of the pg_dump or pg_dumpall commands. Again, it is a convenience meta-command within psql.

Backing up a single table

In this first example, I'll dump the only the students table:

example_backups=# \! pg_dump -U postgres -t students example_backups > ~/Example_Dumps/students.sql.

Listing out the directory's contents, we see the file is there:

example_backups=# \! ls -a ~/Example_Dumps
.  .. students.sql

The command-line options for this individual command are:

  • -U postgres: the specified username
  • -t students: the table to dump
  • example_backups: the database

What's in the students.sql file?

$ cat students.sql
--
-- PostgreSQL database dump
--
-- Dumped from database version 10.4 (Ubuntu 10.4-2.pgdg16.04+1)
-- Dumped by pg_dump version 10.4 (Ubuntu 10.4-2.pgdg16.04+1)
SET statement_timeout = 0;
SET lock_timeout = 0;
SET idle_in_transaction_session_timeout = 0;
SET client_encoding = 'UTF8';
SET standard_conforming_strings = on;
SELECT pg_catalog.set_config('search_path', '', false);
SET check_function_bodies = false;
SET client_min_messages = warning;
SET row_security = off;
 
SET default_tablespace = '';
 
SET default_with_oids = false;
 
--
-- Name: students; Type: TABLE; Schema: public; Owner: postgres
--
CREATE TABLE public.students (
   id integer,
   f_name character varying(20),
   l_name character varying(20)
);
 
ALTER TABLE public.students OWNER TO postgres;
 
--
-- Data for Name: students; Type: TABLE DATA; Schema: public; Owner: postgres
--
COPY public.students (id, f_name, l_name) FROM stdin;
1 John Thorn
2 Phil Hampt
3 Sue Dean
4 Johnny Rames
\.
--
-- PostgreSQL database dump complete

We can see the file has the necessary SQL commands to re-create and re-populate table students.

But, is the backup good? Reliable and working?

We will test it out and see.

example_backups=# DROP TABLE students;
DROP TABLE
example_backups=# \dt;
         List of relations
Schema |  Name | Type  | Owner
--------+---------+-------+----------
public | classes | table | postgres
(1 row)

It's gone.

Then from the command-line pass the saved backup into psql:

$ psql -U postgres -W -d example_backups -f ~/Example_Dumps/students.sql
Password for user postgres:
SET
SET
SET
SET
SET
set_config
------------
(1 row)
 
SET
SET
SET
SET
SET
CREATE TABLE
ALTER TABLE
COPY 4

Let's verify in the database:

example_backups=# \dt;
         List of relations
Schema |   Name | Type  | Owner
--------+----------+-------+----------
public | classes  | table | postgres
public | students | table | postgres
(2 rows)
example_backups=# SELECT * FROM students;
id | f_name | l_name
----+--------+--------
 1 | John   | Thorn
 2 | Phil   | Hampt
 3 | Sue    | Dean
 4 | Johnny | Rames
(4 rows)

Table and data have been restored.

Backing up multiple tables

In this next example, we will back up both tables using this command:

example_backups=# \! pg_dump -U postgres -W -t classes -t students -d example_backups > ~/Example_Dumps/all_tables.sql
Password:

(Notice I needed to specify a password in this command due to the -W option, where I did not in the first example. More on this to come.)

Let's again verify the file was created by listing out the directory contents:

example_backups=# \! ls -a ~/Example_Dumps
.  .. all_tables.sql  students.sql

Then drop the tables:

example_backups=# DROP TABLE classes;
DROP TABLE
example_backups=# DROP TABLE students;
DROP TABLE
example_backups=# \dt;
Did not find any relations.

Then restore with the all_tables.sql backup file:

$ psql -U postgres -W -d example_backups -f ~/Example_Dumps/all_tables.sql
Password for user postgres:
SET
SET
SET
SET
SET
set_config
------------
(1 row)
 
SET
SET
SET
SET
SET
CREATE TABLE
ALTER TABLE
CREATE TABLE
ALTER TABLE
COPY 3
COPY 4
example_backups=# \dt;
         List of relations
Schema |   Name | Type  | Owner
--------+----------+-------+----------
public | classes  | table | postgres
public | students | table | postgres
(2 rows)

Both tables have been restored.

As we can see with pg_dump, you can back up just one, or multiple tables within a specific database.

Backing up a database

Let's now see how to backup the entire example_backups database with pg_dump.

example_backups=# \! pg_dump -U postgres -W -d example_backups > ~/Example_Dumps/ex_back_db.sql
Password:
 
example_backups=# \! ls -a ~/Example_Dumps
.  .. all_tables.sql  ex_back_db.sql students.sql

The ex_back_db.sql file is there.

I'll connect to the postgres database in order to drop the example_backups database.

postgres=# DROP DATABASE example_backups;
DROP DATABASE

Then restore from the command-line:

$ psql -U postgres -W -d example_backups -f ~/Example_Dumps/ex_back_db.sql
Password for user postgres:
psql: FATAL:  database "example_backups" does not exist

It's not there. Why not? And where is it?

We have to create it first.

postgres=# CREATE DATABASE example_backups;
CREATE DATABASE

Then restore with the same command:

$ psql -U postgres -W -d example_backups -f ~/Example_Dumps/ex_back_db.sql
Password for user postgres:
SET
SET
SET
SET
SET
set_config
------------
(1 row)
 
SET
SET
SET
CREATE EXTENSION
COMMENT
SET
SET
CREATE TABLE
ALTER TABLE
CREATE TABLE
ALTER TABLE
COPY 3
COPY 4
postgres=# \c example_backups;
You are now connected to database "example_backups" as user "postgres".
example_backups=# \dt;
         List of relations
Schema |   Name | Type  | Owner
--------+----------+-------+----------
public | classes  | table | postgres
public | students | table | postgres
(2 rows)

Database and all tables present and accounted for.

We can avoid this scenario of having to create the target database first, by including the -C option when taking the backup.

example_backups=# \! pg_dump -U postgres -W -C -d example_backups > ~/Example_Dumps/ex_back2_db.sql
Password:

I'll reconnect to the postgres database and drop the example_backups database so we can see how the restore works now (Note those connect and DROP commands not shown for brevity).

Then on the command-line (notice no -d dbname option included):

$ psql -U postgres -W -f ~/Example_Dumps/ex_back2_db.sql
Password for user postgres:
……………..
(And partway through the output...)
CREATE DATABASE
ALTER DATABASE
Password for user postgres:
You are now connected to database "example_backups" as user "postgres".
SET
SET
SET
SET
SET
set_config
------------
(1 row)
 
SET
SET
SET
CREATE EXTENSION
COMMENT
SET
SET
CREATE TABLE
ALTER TABLE
CREATE TABLE
ALTER TABLE
COPY 3
COPY 4

Using the -C option, we are prompted for a password to make a connection as mentioned in the documentation concerning the -C flag:

“Begin the output with a command to create the database itself and reconnect to the created database.”

Then in the psql session:

postgres=# \c example_backups;
You are now connected to database "example_backups" as user "postgres".

Everything is restored, good to go, and without the need to create the target database prior to the restore.

pg_dumpall for the entire cluster

So far, we have backed up a single table, multiple tables, and a single database.

But if we want more than that, for instance backing up the entire PostgreSQL cluster, that's where we need to use pg_dumpall.

So what are some notable differences between pg_dump and pg_dumpall?

For starters, here is an important distinction from the documentation:

“Since pg_dumpall reads tables from all databases, you will most likely have to connect as a database superuser in order to produce a complete dump. Also, you will need superuser privileges to execute the saved script in order to be allowed to add users and groups and to create databases.”

Using the below command, I'll back up my entire PostgreSQL cluster and save it in the entire_cluster.sql file:

$ pg_dumpall -U postgres -W -f ~/Example_Dumps/Cluster_Dumps/entire_cluster.sql
Password:
Password:
Password:
Password:
Password:
Password:
Password:
Password:
Password:
Password:
Password:
Password:
Password:
Password:
Password:
Password:
Password:
Password:
Password:
Password:
Password:
Password:
Password:
Password:

What on earth? Are you wondering did I have to enter a password for each prompt?

Yep, sure did. 24 times.

Count 'em. (Hey, I like to explore and delve into different databases as I learn? What can I say?)

But why all the prompts?

First of all, after all that hard work, did pg_dumpall create the backup file?

postgres=# \! ls -a ~/Example_Dumps/Cluster_Dumps
.  .. entire_cluster.sql

Yep, the backup file is there.

Let's shed some light on all that 'typing practice’ by looking at this passage from the documentation:

“pg_dumpall needs to connect several times to the PostgreSQL server (once per database). If you use password authentication it will ask for a password each time.”

I know what you're thinking.

This may not be ideal or even feasible. What about processes, scripts, or cron jobs that run in the middle of the night?

Is someone going to hover over the keyboard, waiting to type?

Probably not.

One effective measure to prevent facing those repeated password prompts is a ~/.pgpass file.

Here is the syntax the ~/.pgpass file requires to work (example provided from the documentation see link above):

hostname:port:database:username:password

With a ~/.pgpass file present in my development environment, containing the necessary credentials for the postgres role, I can omit the -W (also -w) option and run pg_dumpall without manually authenticating with the password:

$ pg_dumpall -U postgres -f ~/Example_Dumps/Cluster_Dumps/entire_cluster2nd.sql

Listing out the directory contents:

postgres=# \! ls -a ~/Example_Dumps/Cluster_Dumps
.  .. entire_cluster2nd.sql  entire_cluster.sql

The file is created and no repeating password prompts.

The saved file can be reloaded with psql similar to pg_dump.

The connection database is less critical as well according to this passage from the documentation: ”It is not important to which database you connect here since the script file created by pg_dumpall will contain the appropriate commands to create and connect to the saved databases.”

Download the Whitepaper Today
 
PostgreSQL Management & Automation with ClusterControl
Learn about what you need to know to deploy, monitor, manage and scale PostgreSQL

pg_dump, pg_dumpall, and shell scripts - A handy combination

In this section, we will see a couple of examples of incorporating pg_dump and pg_dumpall into simple shell scripts.

The be clear, this is not a shell script tutorial. Nor am I a shell script guru. I'll mainly provide a couple of examples I use in my local development/learning environment.

Up first, let's look at a simple shell script you can use to backup a single database:

#!/bin/bash
# This script performs a pg_dump, saving the file the specified dir.
# The first arg ($1) is the database user to connect with.
# The second arg ($2) is the database to backup and is included in the file name.
# $(date +"%Y_%m_%d") includes the current system date into the actual file name.

pg_dump -U $1 -W -C -d $2 > ~/PG_dumps/Dump_Scripts/$(date +"%Y_%m_%d")_$2.sql

As you can see, this script accepts 2 arguments: the first one is the user (or role) to connect with for the backup, while the second is the name of the database you want to back up.

Notice the -C option in the command so that we can restore if the database happens to be non-existent, without the need to manually create it beforehand.

Let's call the script with the postgres role for the example_backups database (Don't forget to make the script executable with at least chmod +x prior to calling for the first time):

$ ~/My_Scripts/pgd.sh postgres example_backups
Password:

And verify it's there:

$ ls -a ~/PG_dumps/Dump_Scripts/
.  .. 2018_06_06_example_backups.sql

Restoration is performed with this backup script as in the previous examples.

A similar shell script can be used with pg_dumpall for backing up the entire PostgreSQL cluster.

This shell script will pipe (|) pg_dumpall into gzip, which is then directed to a designated file location:

#!/bin/bash
# This shell script calls pg_dumpall and pipes into the gzip utility, then directs to
# a directory for storage.
# $(date +"%Y_%m_%d") incorporates the current system date into the file name.
 
pg_dumpall -U postgres | gzip > ~/PG_dumps/Cluster_Dumps/$(date +"%Y_%m_%d")_pg_bck.gz

Unlike the previous example script, this one does not accept any arguments.

I'll call this script on the command-line, (no password prompt since the postgres role utilizes the ~/.pgpass file - See section above.)

$ ~/My_Scripts/pgalldmp.sh

Once complete, I'll list the directory contents also showing file sizes for comparison between the .sql and gz files:

postgres=# \! ls -sh ~/PG_dumps/Cluster_Dumps
total 957M
37M 2018_05_22_pg_bck.gz   32M 2018_06_06_pg_bck.gz 445M entire_cluster2nd.sql  445M entire_cluster.sql

A note for the gz archive format from the docs:

“The alternative archive file formats must be used with pg_restore to rebuild the database.”

Summary

I have assembled key points from the documentation on pg_dump and pg_dumpall, along with my observations, to close out this blog post:

Note: Points provided from the documentation are in quotes.

  • “pg_dump only dumps a single database”
  • The plain-text SQL file format is the default output for pg_dump.
  • A role needs the SELECT privilege to run pg_dump according to this line in the documentation: “pg_dump internally executes SELECT statements. If you have problems running pg_dump, make sure you are able to select information from the database using, for example, psql”
  • To include the necessary DDL CREATE DATABASE command and a connection in the backup file, include the -C option.
  • -W: This option forces pg_dump to prompt for a password. This flag is not necessary since if the server requires a password, you are prompted anyway. Nevertheless, this passage in the documentation caught my eye so I thought to include it here: “However, pg_dump will waste a connection attempt finding out that the server wants a password. In some cases it is worth typing -W to avoid the extra connection attempt.”
  • -d: Specifies the database to connect to. Also in the documentation: ”This is equivalent to specifying dbname as the first non-option argument on the command line.”
  • Utilizing flags such as -t (table) allows users to backup portions of the database, namely tables, they do have access privileges for.
  • Backup file formats can vary. However, .sql files are a great choice among others. Backup files are read back in by psql for a restore.
  • pg_dump can back up a running, active database without interfering with other operations (i.e., other readers and writers).
  • One caveat: pg_dump does not dump roles or other database objects including tablespaces, only a single database.
  • To take backups on your entire PostgreSQL cluster, pg_dumpall is the better choice.
  • pg_dumpall can handle the entire cluster, backing up information on roles, tablespaces, users, permissions, etc... where pg_dump cannot.
  • Chances are, a role with SUPERUSER privileges will have to perform the dump, and restore/recreate the file when it is read back in through psql because during restore, the privilege to read all tables in all databases is required.

My hope is through this blog post, I have provided adequate examples and details for a beginner level overview on pg_dump and pg_dumpall for a single development/learning PostgreSQL environments.

Although all available options were not explored, the official documentation contains a wealth of information with examples for both utilities so be sure and consult that resource for further study, questions, and reading.


MySQL on Docker: Running a MariaDB Galera Cluster without Orchestration Tools - DB Container Management - Part 2

$
0
0

As we saw in the first part of this blog, a strongly consistent database cluster like Galera does not play well with container orchestration tools like Kubernetes or Swarm. We showed you how to deploy Galera and configure process management for Docker, so you retain full control of the behaviour.  This blog post is the continuation of that, we are going to look into operation and maintenance of the cluster.

To recap some of the main points from the part 1 of this blog, we deployed a three-node Galera cluster, with ProxySQL and Keepalived on three different Docker hosts, where all MariaDB instances run as Docker containers. The following diagram illustrates the final deployment:

Graceful Shutdown

To perform a graceful MySQL shutdown, the best way is to send SIGTERM (signal 15) to the container:

$ docker kill -s 15 {db_container_name}

If you would like to shutdown the cluster, repeat the above command on all database containers, one node at a time. The above is similar to performing "systemctl stop mysql" in systemd service for MariaDB. Using "docker stop" command is pretty risky for database service because it waits for 10 seconds timeout and Docker will force SIGKILL if this duration is exceeded (unless you use a proper --timeout value).

The last node that shuts down gracefully will have the seqno not equal to -1 and safe_to_bootstrap flag is set to 1 in the /{datadir volume}/grastate.dat of the Docker host, for example on host2:

$ cat /containers/mariadb2/datadir/grastate.dat
# GALERA saved state
version: 2.1
uuid:    e70b7437-645f-11e8-9f44-5b204e58220b
seqno:   7099
safe_to_bootstrap: 1

Detecting the Most Advanced Node

If the cluster didn't shut down gracefully, or the node that you were trying to bootstrap wasn't the last node to leave the cluster, you probably wouldn't be able to bootstrap one of the Galera node and might encounter the following error:

2016-11-07 01:49:19 5572 [ERROR] WSREP: It may not be safe to bootstrap the cluster from this node.
It was not the last one to leave the cluster and may not contain all the updates.
To force cluster bootstrap with this node, edit the grastate.dat file manually and set safe_to_bootstrap to 1 .

Galera honours the node that has safe_to_bootstrap flag set to 1 as the first reference node. This is the safest way to avoid data loss and ensure the correct node always gets bootstrapped.

If you got the error, we have to find out the most advanced node first before picking up the node as the first to be bootstrapped. Create a transient container (with --rm flag), map it to the same datadir and configuration directory of the actual database container with two MySQL command flags, --wsrep_recover and --wsrep_cluster_address. For example, if we want to know mariadb1 last committed number, we need to run:

$ docker run --rm --name mariadb-recover \
        --env MYSQL_ROOT_PASSWORD="PM7%cB43$sd@^1" \
        --volume /containers/mariadb1/datadir:/var/lib/mysql \
        --volume /containers/mariadb1/conf.d:/etc/mysql/conf.d \
        mariadb:10.2.15 \
        --wsrep_recover \
        --wsrep_cluster_address=gcomm://
2018-06-12  4:46:35 139993094592384 [Note] mysqld (mysqld 10.2.15-MariaDB-10.2.15+maria~jessie) starting as process 1 ...
2018-06-12  4:46:35 139993094592384 [Note] InnoDB: Mutexes and rw_locks use GCC atomic builtins
...
2018-06-12  4:46:35 139993094592384 [Note] Plugin 'FEEDBACK' is disabled.
2018-06-12  4:46:35 139993094592384 [Note] Server socket created on IP: '::'.
2018-06-12  4:46:35 139993094592384 [Note] WSREP: Recovered position: e70b7437-645f-11e8-9f44-5b204e58220b:7099

The last line is what we are looking for. MariaDB prints out the cluster UUID and the sequence number of the most recently committed transaction. The node which holds the highest number is deemed as the most advanced node. Since we specified --rm, the container will be removed automatically once it exits. Repeat the above step on every Docker host by replacing the --volume path to the respective database container volumes.

Once you have compared the value reported by all database containers and decided which container is the most up-to-date node, change the safe_to_bootstrap flag to 1 inside /{datadir volume}/grastate.dat manually. Let's say all nodes are reporting the same exact sequence number, we can just pick mariadb3 to be bootstrapped by changing the safe_to_bootstrap value to 1:

$ vim /containers/mariadb3/datadir/grasate.dat
...
safe_to_bootstrap: 1

Save the file and start bootstrapping the cluster from that node, as described in the next chapter.

Bootstrapping the Cluster

Bootstrapping the cluster is similar to the first docker run command we used when starting up the cluster for the first time. If mariadb1 is the chosen bootstrap node, we can simply re-run the created bootstrap container:

$ docker start mariadb0 # on host1

Otherwise, if the bootstrap container does not exist on the chosen node, let's say on host2, run the bootstrap container command and map the existing mariadb2's volumes. We are using mariadb0 as the container name on host2 to indicate it is a bootstrap container:

$ docker run -d \
        --name mariadb0 \
        --hostname mariadb0.weave.local \
        --net weave \
        --publish "3306" \
        --publish "4444" \
        --publish "4567" \
        --publish "4568" \
        $(weave dns-args) \
        --env MYSQL_ROOT_PASSWORD="PM7%cB43$sd@^1" \
        --volume /containers/mariadb2/datadir:/var/lib/mysql \
        --volume /containers/mariadb2/conf.d:/etc/mysql/mariadb.conf.d \
        mariadb:10.2.15 \
        --wsrep_cluster_address=gcomm:// \
        --wsrep_sst_auth="root:PM7%cB43$sd@^1" \
        --wsrep_node_address=mariadb0.weave.local

You may notice that this command is slightly shorter as compared to the previous bootstrap command described in this guide. Since we already have the proxysql user created in our first bootstrap command, we may skip these two environment variables:

  • --env MYSQL_USER=proxysql
  • --env MYSQL_PASSWORD=proxysqlpassword

Then, start the remaining MariaDB containers, remove the bootstrap container and start the existing MariaDB container on the bootstrapped host. Basically the order of commands would be:

$ docker start mariadb1 # on host1
$ docker start mariadb3 # on host3
$ docker stop mariadb0 # on host2
$ docker start mariadb2 # on host2

At this point, the cluster is started and is running at full capacity.

Resource Control

Memory is a very important resource in MySQL. This is where the buffers and caches are stored, and it's critical for MySQL to reduce the impact of hitting the disk too often. On the other hand, swapping is bad for MySQL performance. By default, there will be no resource constraints on the running containers. Containers use as much of a given resource as the host’s kernel will allow. Another important thing is file descriptor limit. You can increase the limit of open file descriptor, or "nofile" to something higher to cater for the number of files MySQL server can open simultaneously. Setting this to a high value won't hurt.

To cap memory allocation and increase the file descriptor limit to our database container, one would append --memory, --memory-swap and --ulimit parameters into the "docker run" command:

$ docker kill -s 15 mariadb1
$ docker rm -f mariadb1
$ docker run -d \
        --name mariadb1 \
        --hostname mariadb1.weave.local \
        --net weave \
        --publish "3306:3306" \
        --publish "4444" \
        --publish "4567" \
        --publish "4568" \
        $(weave dns-args) \
        --memory 16g \
        --memory-swap 16g \
        --ulimit nofile:16000:16000 \
        --env MYSQL_ROOT_PASSWORD="PM7%cB43$sd@^1" \
        --volume /containers/mariadb1/datadir:/var/lib/mysql \
        --volume /containers/mariadb1/conf.d:/etc/mysql/mariadb.conf.d \
        mariadb:10.2.15 \
        --wsrep_cluster_address=gcomm://mariadb0.weave.local,mariadb1.weave.local,mariadb2.weave.local,mariadb3.weave.local \
        --wsrep_sst_auth="root:PM7%cB43$sd@^1" \
        --wsrep_node_address=mariadb1.weave.local

Take note that if --memory-swap is set to the same value as --memory, and --memory is set to a positive integer, the container will not have access to swap. If --memory-swap is not set, container swap will default to --memory multiply by 2. If --memory and --memory-swap are set to the same value, this will prevent containers from using any swap. This is because --memory-swap is the amount of combined memory and swap that can be used, while --memory is only the amount of physical memory that can be used.

Some of the container resources like memory and CPU can be controlled dynamically through "docker update" command, as shown in the following example to upgrade the memory of container mariadb1 to 32G on-the-fly:

$ docker update \
    --memory 32g \
    --memory-swap 32g \
    mariadb1

Do not forget to tune the my.cnf accordingly to suit the new specs. Configuration management is explained in the next section.

Configuration Management

Most of the MySQL/MariaDB configuration parameters can be changed during runtime, which means you don't need to restart to apply the changes. Check out the MariaDB documentation page for details. The parameter listed with "Dynamic: Yes" means the variable is loaded immediately upon changing without the necessity to restart MariaDB server. Otherwise, set the parameters inside the custom configuration file in the Docker host. For example, on mariadb3, make the changes to the following file:

$ vim /containers/mariadb3/conf.d/my.cnf

And then restart the database container to apply the change:

$ docker restart mariadb3

Verify the container starts up the process by looking at the docker logs. Perform this operation on one node at a time if you would like to make cluster-wide changes.

Backup

Taking a logical backup is pretty straightforward because the MariaDB image also comes with mysqldump binary. You simply use the "docker exec" command to run the mysqldump and send the output to a file relative to the host path. The following command performs mysqldump backup on mariadb2 and saves it to /backups/mariadb2 inside host2:

$ docker exec -it mariadb2 mysqldump -uroot -p --single-transaction > /backups/mariadb2/dump.sql

Binary backup like Percona Xtrabackup or MariaDB Backup requires the process to access the MariaDB data directory directly. You have to either install this tool inside the container, or through the machine host or use a dedicated image for this purpose like "perconalab/percona-xtrabackup" image to create the backup and stored it inside /tmp/backup on the Docker host:

$ docker run --rm -it \
    -v /containers/mariadb2/datadir:/var/lib/mysql \
    -v /tmp/backup:/xtrabackup_backupfiles \
    perconalab/percona-xtrabackup \
    --backup --host=mariadb2 --user=root --password=mypassword

You can also stop the container with innodb_fast_shutdown set to 0 and copy over the datadir volume to another location in the physical host:

$ docker exec -it mariadb2 mysql -uroot -p -e 'SET GLOBAL innodb_fast_shutdown = 0'
$ docker kill -s 15 mariadb2
$ cp -Rf /containers/mariadb2/datadir /backups/mariadb2/datadir_copied
$ docker start mariadb2

Restore

Restoring is pretty straightforward for mysqldump. You can simply redirect the stdin into the container from the physical host:

$ docker exec -it mariadb2 mysql -uroot -p < /backups/mariadb2/dump.sql

You can also use the standard mysql client command line remotely with proper hostname and port value instead of using this "docker exec" command:

$ mysql -uroot -p -h127.0.0.1 -P3306 < /backups/mariadb2/dump.sql

For Percona Xtrabackup and MariaDB Backup, we have to prepare the backup beforehand. This will roll forward the backup to the time when the backup was finished. Let's say our Xtrabackup files are located under /tmp/backup of the Docker host, to prepare it, simply:

$ docker run --rm -it \
    -v mysql-datadir:/var/lib/mysql \
    -v /tmp/backup:/xtrabackup_backupfiles \
    perconalab/percona-xtrabackup \
    --prepare --target-dir /xtrabackup_backupfiles

The prepared backup under /tmp/backup of the Docker host then can be used as the MariaDB datadir for a new container or cluster. Let's say we just want to verify restoration on a standalone MariaDB container, we would run:

$ docker run -d \
    --name mariadb-restored \
    --env MYSQL_ROOT_PASSWORD="PM7%cB43$sd@^1" \
    -v /tmp/backup:/var/lib/mysql \
    mariadb:10.2.15

If you performed a backup using stop and copy approach, you can simply duplicate the datadir and use the duplicated directory as a volume maps to MariaDB datadir to run on another container. Let's say the backup was copied over under /backups/mariadb2/datadir_copied, we can run a new container by running:

$ mkdir -p /containers/mariadb-restored/datadir
$ cp -Rf /backups/mariadb2/datadir_copied /containers/mariadb-restored/datadir
$ docker run -d \
    --name mariadb-restored \
    --env MYSQL_ROOT_PASSWORD="PM7%cB43$sd@^1" \
    -v /containers/mariadb-restored/datadir:/var/lib/mysql \
    mariadb:10.2.15

The MYSQL_ROOT_PASSWORD must match the actual root password for that particular backup.

Severalnines
 
MySQL on Docker: How to Containerize Your Database
Discover all you need to understand when considering to run a MySQL service on top of Docker container virtualization

Database Version Upgrade

There are two types of upgrade - in-place upgrade or logical upgrade.

In-place upgrade involves shutting down the MariaDB server, replacing the old binaries with the new binaries and then starting the server on the old data directory. Once started, you have to run mysql_upgrade script to check and upgrade all system tables and also to check the user tables.

The logical upgrade involves exporting SQL from the current version using a logical backup utility such as mysqldump, running the new container with the upgraded version binaries, and then applying the SQL to the new MySQL/MariaDB version. It is similar to backup and restore approach described in the previous section.

Nevertheless, it's a good approach to always backup your database before performing any destructive operations. The following steps are required when upgrading from the current image, MariaDB 10.1.33 to another major version, MariaDB 10.2.15 on mariadb3 resides on host3:

  1. Backup the database. It doesn't matter physical or logical backup but the latter using mysqldump is recommended.

  2. Download the latest image that we would like to upgrade to:

    $ docker pull mariadb:10.2.15
  3. Set innodb_fast_shutdown to 0 for our database container:

    $ docker exec -it mariadb3 mysql -uroot -p -e 'SET GLOBAL innodb_fast_shutdown = 0'
  4. Graceful shut down the database container:

    $ docker kill --signal=TERM mariadb3
  5. Create a new container with the new image for our database container. Keep the rest of the parameters intact except using the new container name (otherwise it would conflict):

    $ docker run -d \
            --name mariadb3-new \
            --hostname mariadb3.weave.local \
            --net weave \
            --publish "3306:3306" \
            --publish "4444" \
            --publish "4567" \
            --publish "4568" \
            $(weave dns-args) \
            --env MYSQL_ROOT_PASSWORD="PM7%cB43$sd@^1" \
            --volume /containers/mariadb3/datadir:/var/lib/mysql \
            --volume /containers/mariadb3/conf.d:/etc/mysql/mariadb.conf.d \
            mariadb:10.2.15 \
            --wsrep_cluster_address=gcomm://mariadb0.weave.local,mariadb1.weave.local,mariadb2.weave.local,mariadb3.weave.local \
            --wsrep_sst_auth="root:PM7%cB43$sd@^1" \
            --wsrep_node_address=mariadb3.weave.local
  6. Run mysql_upgrade script:

    $ docker exec -it mariadb3-new mysql_upgrade -uroot -p
  7. If no errors occurred, remove the old container, mariadb3 (the new one is mariadb3-new):

    $ docker rm -f mariadb3
  8. Otherwise, if the upgrade process fails in between, we can fall back to the previous container:

    $ docker stop mariadb3-new
    $ docker start mariadb3

Major version upgrade can be performed similarly to the minor version upgrade, except you have to keep in mind that MySQL/MariaDB only supports major upgrade from the previous version. If you are on MariaDB 10.0 and would like to upgrade to 10.2, you have to upgrade to MariaDB 10.1 first, followed by another upgrade step to MariaDB 10.2.

Take note on the configuration changes being introduced and deprecated between major versions.

Failover

In Galera, all nodes are masters and hold the same role. With ProxySQL in the picture, connections that pass through this gateway will be failed over automatically as long as there is a primary component running for Galera Cluster (that is, a majority of nodes are up). The application won't notice any difference if one database node goes down because ProxySQL will simply redirect the connections to the other available nodes.

If the application connects directly to the MariaDB bypassing ProxySQL, failover has to be performed on the application-side by pointing to the next available node, provided the database node meets the following conditions:

  • Status wsrep_local_state_comment is Synced (The state "Desynced/Donor" is also possible, only if wsrep_sst_method is xtrabackup, xtrabackup-v2 or mariabackup).
  • Status wsrep_cluster_status is Primary.

In Galera, an available node doesn't mean it's healthy until the above status are verified.

Scaling Out

To scale out, we can create a new container in the same network and use the same custom configuration file for the existing container on that particular host. For example, let's say we want to add the fourth MariaDB container on host3, we can use the same configuration file mounted for mariadb3, as illustrated in the following diagram:

Run the following command on host3 to scale out:

$ docker run -d \
        --name mariadb4 \
        --hostname mariadb4.weave.local \
        --net weave \
        --publish "3306:3307" \
        --publish "4444" \
        --publish "4567" \
        --publish "4568" \
        $(weave dns-args) \
        --env MYSQL_ROOT_PASSWORD="PM7%cB43$sd@^1" \
        --volume /containers/mariadb4/datadir:/var/lib/mysql \
        --volume /containers/mariadb3/conf.d:/etc/mysql/mariadb.conf.d \
        mariadb:10.2.15 \
        --wsrep_cluster_address=gcomm://mariadb1.weave.local,mariadb2.weave.local,mariadb3.weave.local,mariadb4.weave.local \
        --wsrep_sst_auth="root:PM7%cB43$sd@^1" \
        --wsrep_node_address=mariadb4.weave.local

Once the container is created, it will join the cluster and perform SST. It can be accessed on port 3307 externally or outside of the Weave network, or port 3306 within the host or within the Weave network. It's not necessary to include mariadb0.weave.local into the cluster address anymore. Once the cluster is scaled out, we need to add the new MariaDB container into the ProxySQL load balancing set via admin console:

$ docker exec -it proxysql1 mysql -uadmin -padmin -P6032
mysql> INSERT INTO mysql_servers(hostgroup_id,hostname,port) VALUES (10,'mariadb4.weave.local',3306);
mysql> INSERT INTO mysql_servers(hostgroup_id,hostname,port) VALUES (20,'mariadb4.weave.local',3306);
mysql> LOAD MYSQL SERVERS TO RUNTIME;
mysql> SAVE MYSQL SERVERS TO DISK;

Repeat the above commands on the second ProxySQL instance.

Finally for the the last step, (you may skip this part if you already ran "SAVE .. TO DISK" statement in ProxySQL), add the following line into proxysql.cnf to make it persistent across container restart on host1 and host2:

$ vim /containers/proxysql1/proxysql.cnf # host1
$ vim /containers/proxysql2/proxysql.cnf # host2

And append mariadb4 related lines under mysql_server directive:

mysql_servers =
(
        { address="mariadb1.weave.local" , port=3306 , hostgroup=10, max_connections=100 },
        { address="mariadb2.weave.local" , port=3306 , hostgroup=10, max_connections=100 },
        { address="mariadb3.weave.local" , port=3306 , hostgroup=10, max_connections=100 },
        { address="mariadb4.weave.local" , port=3306 , hostgroup=10, max_connections=100 },
        { address="mariadb1.weave.local" , port=3306 , hostgroup=20, max_connections=100 },
        { address="mariadb2.weave.local" , port=3306 , hostgroup=20, max_connections=100 },
        { address="mariadb3.weave.local" , port=3306 , hostgroup=20, max_connections=100 },
        { address="mariadb4.weave.local" , port=3306 , hostgroup=20, max_connections=100 }
)

Save the file and we should be good on the next container restart.

Scaling Down

To scale down, simply shuts down the container gracefully. The best command would be:

$ docker kill -s 15 mariadb4
$ docker rm -f mariadb4

Remember, if the database node left the cluster ungracefully, it was not part of scaling down and would affect the quorum calculation.

To remove the container from ProxySQL, run the following commands on both ProxySQL containers. For example, on proxysql1:

$ docker exec -it proxysql1 mysql -uadmin -padmin -P6032
mysql> DELETE FROM mysql_servers WHERE hostname="mariadb4.weave.local";
mysql> LOAD MYSQL SERVERS TO RUNTIME;
mysql> SAVE MYSQL SERVERS TO DISK;

You can then either remove the corresponding entry inside proxysql.cnf or just leave it like that. It will be detected as OFFLINE from ProxySQL point-of-view anyway.

Summary

With Docker, things get a bit different from the conventional way on handling MySQL or MariaDB servers. Handling stateful services like Galera Cluster is not as easy as stateless applications, and requires proper testing and planning.

In our next blog on this topic, we will evaluate the pros and cons of running Galera Cluster on Docker without any orchestration tools.

Tuning Input/Output (I/O) Operations for PostgreSQL

$
0
0

PostgreSQL is one of the most popular open-source databases in the world and has successful implementations across several mission-critical environments across various domains, using real-time high-end OLTP applications performing millions and billions of transactions per day. PostgreSQL I/O is quite reliable, stable and performant on pretty much any hardware, including even cloud.

To ensure that databases perform at the expected scale with expected response times, there is a need for some performance engineering. Well, the accomplishment of good database performance depends on various factors. Database performance can go bad for various reasons such as infrastructure dimensioning, inefficient database maintenance strategy, poor SQL code or badly configured database processes that fail to utilize all the available resources - CPU, memory, network bandwidth and disk I/O.

What can cause database performance to degrade?

  • Badly written queries with bad joins, logic etc. that take a lot of CPU and memory
  • Queries performing full-table-scans on big tables due to improper Indexing
  • Bad database maintenance with no proper statistics in place
  • Inefficient capacity planning resulting in inadequately dimensioned infrastructure
  • Improper logical and physical design
  • No connection pooling in place, which cause applications to make huge number of connections in an uncontrollable manner

So that’s a lot of potential areas which can cause performance problems. One of the significant areas I would like to focus on in this blog is how to tune PostgreSQL I/O (Input / Output) performance. Tuning the Input / Output operations of PostgreSQL is essential, especially in a high-transactional environment like OLTP or in a Data warehousing environment with complex data analysis on huge size data sets.

Most of the times, database performance problems are caused mainly due to high I/O. This means, database processes are spending more time either writing to or reading from the disk. Any real-time data operation is I/O bound, it is imperative to ensure the database is I/O tuned. In this blog, I will be focusing on common I/O problems PostgreSQL databases can encounter in real-time production environments.

Tuning PostgreSQL I/O

Tuning PostgreSQL I/O is imperative for building a highly performant and scalable database architecture. Let us look at various factors impacting I/O performance:

  • Indexing
  • Partitioning
  • Checkpoints
  • VACUUM, ANALYZE (with FILLFACTOR)
  • Other I/O problems
  • PostgreSQL I/O on Cloud
  • Tools

Indexing

Indexing is one of the core tuning techniques which plays an imperative role in improving database I/O performance. This applies to any database really. PostgreSQL supports various index types which can speed up read operations to a great extent, yielding enhanced scalability for applications. Whilst creating indexes is fairly simple and straightforward, it is essential for DBAs and developers to have the knowledge of what type of index to choose, and on what columns. The latter is based on various factors like query complexity, data type, data cardinality, volume of writes, data size, disk architecture, infrastructure (public cloud, private cloud or on-premises), etc..

Whilst indexing can dramatically improve query read performance, it can also slow down the writes hitting the indexed columns. Let us look at an example:

Impact of Indexes on READ operations

A table called emp with around 1 million rows.

READ Performance without an Index

postgres=# select * from emp where eid=10;

 eid | ename    | peid | did  |    doj
-----+---------------+--------+------+------------
  10 | emp        |          |   1   | 2018-06-06
(1 row)
 
Time: 70.020 ms => took about 70+ milli-seconds to respond with on row

READ Performance with an Index

Let us put an index on eid column and see the difference

postgres=# create index indx001 on emp ( eid );
CREATE INDEX

postgres=# select * from emp where eid=10;

 eid | ename  | peid | did |    doj
------+-------------+-------+------+------------
  10 | emp      |          |   1   | 2018-06-06
(1 row)
 
Time: 0.454 ms =>  0.4+ milli-seconds!!! thats a huge difference - isn’t it?

So, Indexing is important.

Impact of Indexes on WRITE operations

Indexes slow down the performance of writes. Whilst the Indexes have an impact on all types of write operations, let us look at some analysis on the impact of Indexes on INSERTs

Inserting 1 million rows into a Table without indexes

postgres=# do $$
postgres$# declare
postgres$# i integer;
postgres$# begin
postgres$# for i in 1..1000000 loop
postgres$# insert into emp values (i,'emp',null,1,current_date);
postgres$# end loop;
postgres$# end $$;
DO

Time: 4818.470 ms (00:04.818) => Takes about 4.8 seconds

Inserting the same 1 million rows with an Index

Let us create an Index first

postgres=# create index indx001 on emp ( eid );
CREATE INDEX

postgres=# do $$
postgres$# declare
postgres$# i integer;
postgres$# begin
postgres$# for i in 1..1000000 loop
postgres$# insert into emp values (i,'emp',null,1,current_date);
postgres$# end loop;
postgres$# end $$;
DO

Time: 7825.494 ms (00:07.825) =>  Takes about 7.8 seconds

So, as we can observe, the INSERT time increased by 80% with just one index and can take much higher time to finish when there are multiple indexes. It can get even worse when there are function based indexes. That is what DBAs have to live with! Indexes will increase the write performance. There are ways to tackle this problem though, which is disk architecture dependent. If the database server is using multiple disk file systems, then the indexes and tables can be placed across multiple tablespaces sitting across multiple disk file systems. In this way, better I/O performance can be achieved.

Index management TIPS

  • Understand the need for indexes. Intelligent indexing is key.
  • Avoid creating multiple indexes, and definitely no unnecessary indexes, this can really degrade write performance.
  • Monitor the usage of indexes and drop any unused indexes.
  • When indexed columns are subjected to data changes, indexes get bloated as well. So, regularly reorganize indexes.

Partitioning

An effective partitioning strategy can reduce I/O performance problems to a great extent. Large tables can be partitioned based on business logic. PostgreSQL supports table partitioning. Although it does not fully support all the features at the moment, it can only help with some of the real-time use-cases. In PostgreSQL, partitioned child tables are completely individual to the master table which is a bottleneck. E.g., Constraints created on the master table cannot be automatically inherited to the child tables.

However, from balancing I/O perspective, partitioning can really help. All the child partitions can be split across multiple tablespaces and disk file systems. Queries with a date range in the “where” clause hitting the table, partitioned based on date range, can benefit from partitioning by just scanning one or two partitions instead of the full table.

Checkpointing

Checkpoints define the consistent state of the database. They are critical and it is important that checkpoints occur regularly enough to ensure data changes are permanently saved to disk and the database is at consistent state all the time. That being said, improper configuration of checkpoints can lead to I/O performance issues. DBAs must be meticulous about configuring checkpoints to ensure there is no I/O spike and also this depends on how good the disks are and how well the data files layout is architected.

What checkpoint does ?

In simple terms, checkpoints will ensure:

  • All the committed data is written to the data files on the disk.
  • clog files are updated with commit status.
  • Transaction log files in pg_xlog (now pg_wal) directory are recycled.

That explains how I/O intensive checkpoints are. There are parameters in postgresql.conf which can be configured / tuned to control checkpoint behavior and those parameters are max_wal_size, min_wal_size, checkpoint_timeout and checkpoint_completion_target. These parameters will decide how frequently the checkpoints should occur, and within how much time the checkpoints have to finish.

How to understand what configuration is better for checkpoints? How to tune them?

Here are some tips:

  • Evaluate the database TPS. Evaluate the total volume of transactions occurring in the database in a business day and also identify at what time the highest number of transactions hits the database.
  • Discuss with application developers and other technical teams regularly to understand the database transaction rate statistics as well as future transaction growth.
  • This can be done from the database end as well:
    • Monitor the database and evaluate the number of transactions occurring during the day. This can be done by querying pgcatalog tables like pg_stat_user_tables.

    • Evaluate the number of wal archive files generated per day

    • Monitor to understand how the checkpoints are performing by enabling log_checkpoints parameter

      2018-06-06 15:03:16.446 IST [2111] LOG:  checkpoint starting: xlog
      2018-06-06 15:03:22.734 IST [2111] LOG:  checkpoint complete: wrote 12112 buffers (73.9%); 0 WAL file(s) added, 0 removed, 25 recycled; write=6.058 s, sync=0.218 s, total=6.287 s; sync files=4, longest=0.178 s, average=0.054 s; distance=409706 kB, estimate=412479 kB
    • Understand if the current checkpoint configuration is good enough for the database. Configure checkpoint_warning parameter (by default configured to 30 seconds) to see the below warnings in the postgres log files.

      2018-06-06 15:02:42.295 IST [2111] LOG:  checkpoints are occurring too frequently (11 seconds apart)
      2018-06-06 15:02:42.295 IST [2111] HINT:  Consider increasing the configuration parameter "max_wal_size".

What does the above warning mean?

Checkpoints generally occur whenever max_wal_size (1 GB by default which means 64 WAL files) worth of logfiles are filled up or when checkpoint_timeout (every 5 mins every default) is reached. The above warning means configured max_wal_size is not adequate and the checkpoints are occurring every 11 seconds, that in-turn means 64 WAL files in PG_WAL directory are getting filled up in just 11 seconds, which is too frequent. In other words, if there are less frequent transactions, then, the checkpoints will occur every 5 minutes. So, as the hint suggests, increase the max_wal_size parameter to a higher value, max_min_size parameter can be increased to the same or a lesser than former.

Another critical parameter to consider from I/O performance perspective is checkpoint_completion_target which is by default configured to 0.5.

checkpoint_completion_target = 0.5 x checkpoint_timeout = 2.5 minutes

That means, checkpoints have got 2.5 mins to sync the dirty blocks to the disk. Are 2.5 minutes enough? That needs to be evaluated. If the number of dirty blocks to be written is very high, then 2.5 minutes can seem very very aggressive and that is when an I/O spike can be observed. Configuring the completion_target parameter must be done based on max_wal_size and checkpoint_timeout values. If these parameters are raised to a higher value, consider raising checkpoint_completion_target accordingly.

VACUUM, ANALYZE (with FILLFACTOR)

VACUUM is one of the most powerful features of PostgreSQL. It can be used to remove bloats (fragmented space) within tables and indexes, and is generated by transactions. The database must be subjected to VACUUMing regularly to ensure healthy maintenance and better performance. Again, not VACUUMing the database regularly can lead to serious performance problems. ANALYZE must be performed along with VACUUM (VACUUM ANALYZE) to ensure up-to-date statistics for the query planner.

VACUUM ANALYZE can be performed in two ways: manual, automatic or both. In a real-time production environment, it is generally both. Automatic VACUUM is enabled by the parameter “autovacuum” which is by default configured to “on”. With autovacuum enabled, PostgreSQL automatically starts VACUUMing the Tables periodically. The candidate tables in need of vacuuming are picked up by autovacuum processes based on various thresholds set by various autovacuum* parameters, these parameters can be tweaked / tuned to ensure bloats of the tables are cleared periodically. Let us look at some parameters and their use -

Autovacuum parameters

autovacuum=onThis parameter is used to enable / disable autovacuum. Default is “on”.
log_autovacuum_min_duration = -1Logs the duration of the autovacuum process. This is important to understand how long the autovacuum process was running for.
autovacuum_max_workers = 3Number of autovacuum processes needed. This depends on how aggressive database transactions are, and how many CPUs you can offer for autovacuum processes.
autovacuum_naptime = 1 minAutovacuum rest time between autovacuum runs.

Parameters defining threshold for Autovacuum process to kick off

Autovacuum job(s) kick off when a certain threshold is reached. Below are the parameters which can be used to set a certain threshold, based on which, the autovacuum process will start.

autovacuum_vacuum_threshold = 50The table will be vacuumed when minimum of 50 rows will be updated / deleted in a Table.
autovacuum_analyze_threshold = 50The table will be analyzed when minimum of 50 rows will be updated / deleted in a Table.
autovacuum_vacuum_scale_factor = 0.2The table will be vacuumed when minimum of 20% of the rows are updated / deleted in a Table.
autovacuum_analyze_scale_factor = 0.1The table will be vacuumed when minimum of 10% of the rows are updated / deleted in a Table.

Above threshold parameters can be modified based on database behavior. DBAs will need to analyze and identify the hot tables and ensure those tables are vacuumed as frequently as possible to ensure good performance. Arriving at a certain value for these parameters could be a challenge in a high-transaction environment, wherein data changes happen every second. Many-a-times I did notice that autovacuum processes take quite long to complete, ending up consuming too much resources in production systems.

I would suggest not to depend completely on autovacuum process, the best way is to schedule a nightly VACUUM ANALYZE job so that the burden on autovacuum is reduced. To start with, consider manually VACUUMing big tables with a high-transaction rate.

VACUUM FULL

VACUUM FULL helps reclaim the bloated space in the tables and indexes. This utility cannot be used when the database is online as it locks the table. Tables must be subjected to VACUUM FULL only when the applications are shutdown. Indexes will also be re-organized along with tables during VACUUM FULL.

Let us take a look at the impact of VACUUM ANALYZE

Bloats: How to identify bloats? When are bloats generated?

Here are some tests:

I have got a table of size 1 GB with 10 million rows.

postgres=# select pg_relation_size('pgbench_accounts')/1024/1024/1024;

 ?column? 
----------------
        1

postgres=# select count(*) From pgbench_accounts ;
  count   
-----------------
 10000000

Let us look at the impact of bloats on a simple query: select * from pgbench_accounts;

Below is the explain plan for the query:

postgres=# explain analyze select * from pgbench_accounts;

QUERY PLAN
------------------------------------------------------------------------------------------------------------------------------------------------
 Seq Scan on pgbench_accounts  (cost=0.00..263935.00 rows=10000000 width=97) 
 (actual time=0.033..1054.257 rows=10000000 loops=1)
 Planning time: 0.255 ms
 Execution time: 1494.448 ms

Now, let us update all the rows in the table and see the impact of the above SELECT query.

postgres=# update pgbench_accounts set abalance=1;
UPDATE 10000000

postgres=# select count(*) From pgbench_accounts ;
  count   
-----------------
 10000000

Below is the EXPLAIN PLAN of the query post UPDATE execution.

postgres=# explain analyze select * from pgbench_accounts;

QUERY PLAN                                                             
----------------------------------------------------------------------------------------------------------------------------------------------------------
 Seq Scan on pgbench_accounts  (cost=0.00..527868.39 rows=19999939 width=97) 
 (actual time=404.474..1520.175 rows=10000000 loops=1)
 Planning time: 0.051 ms
 Execution time: 1958.532 ms

The size of the table increased to 2 GB after the UPDATE

postgres=# select pg_relation_size('pgbench_accounts')/1024/1024/1024;

 ?column? 
-----------------
        2

If you can observe and compare the cost numbers of the earlier EXPLAIN PLAN, there is a huge difference. The cost has increased by a big margin. More importantly if you observe carefully, the number of rows (just over 19 million) being scanned after the UPDATE is higher which is almost two times the actual existing rows (10 million). That means, the number of bloated rows are 9+ million and actual time increased as well and the execution time increased from 1.4 seconds to 1.9 seconds.

So, that is the impact of not VACUUMing the TABLE after the UPDATE. The above EXPLAIN PLAN numbers precisely means, the table is bloated.

How to identify if the table is bloated? Use pgstattuple contrib module:

postgres=# select * from pgstattuple('pgbench_accounts');
 table_len  | tuple_count | tuple_len  | tuple_percent | dead_tuple_count | dead_tuple_len | dead_tuple_percent | free_space | free_percent 
------------+-------------+------------+---------------+------------------+----------------+--------------------+------------+--------------
 2685902848 |    10000000 | 1210000000 |         45.05 |          9879891 |     1195466811 |              44.51 |   52096468 |         1.94

The above number indicates that half of the table is bloated.

Let us VACUUM ANALYZE the table and see the impact now:

postgres=# VACUUM ANALYZE pgbench_accounts ;
VACUUM

postgres=# explain analyze select * from pgbench_accounts;

QUERY PLAN
-----------------------------------------------------------------------------------------------------------------------------------------------
 Seq Scan on pgbench_accounts  (cost=0.00..428189.05 rows=10032005 width=97) 
 (actual time=400.023..1472.118 rows=10000000 loops=1)
 Planning time: 4.374 ms
 Execution time: 1913.541 ms

After VACUUM ANALYZE, the cost numbers have decreased. Now, the number of rows scanned is showing up close to 10 million, also the actual time and the execution time did not change much. That is because, though the bloats in the table have vanished, the size of the table to be scanned remains the same. Below is the pgstattuple output post VACUUM ANALYZE.

postgres=# select * from pgstattuple('pgbench_accounts');

 table_len  | tuple_count | tuple_len  | tuple_percent | dead_tuple_count | dead_tuple_len | dead_tuple_percent | free_space | free_percent 
------------+-------------+------------+---------------+------------------+----------------+--------------------+------------+--------------
 2685902848 |    10000000 | 1210000000 |         45.05 |             0 |              0 |                  0 | 1316722516 |        49.02

Above number indicates that all the bloats (dead tuples) have vanished.

Let us look at the impact of VACUUM FULL ANALYZE and see what happens:

postgres=# vacuum full analyze pgbench_accounts ;
VACUUM

postgres=# explain analyze select * from pgbench_accounts;

                            QUERY PLAN                                                            
---------------------------------------------------------------------------
 Seq Scan on pgbench_accounts  (cost=0.00..263935.35 rows=10000035 width=97) 
(actual time=0.015..1089.726 rows=10000000 loops=1)
 Planning time: 0.148 ms
 Execution time: 1532.596 ms

If you observe, the actual time and the execution time numbers are similar to the numbers before UPDATE. Also, the size of the table has now decreased from 2 GB to 1 GB.

postgres=# select pg_relation_size('pgbench_accounts')/1024/1024/1024;

 ?column? 
-----------------
        1

That is the impact of VACUUM FULL.

FILLFACTOR

FILLFACTOR is a very important attribute which can make real difference to the database maintenance strategy at a table and index level. This value indicates the amount of space to be used by the INSERTs within a data block. FILLFACTOR value defaults to 100%, which means, INSERTs can utilize all the space available in a data block. It also means, no space is available for UPDATEs. This value can be decreased to a certain value for heavily updated tables.

This parameter can be configured to each table and an index. If FILLFACTOR is configured to the optimal value, you can see real difference in VACUUM performance and query performance too. In short, optimal FILLFACTOR values ensure unnecessary number of blocks are not allocated.

Let us look at the same example above -

The table has one million rows

postgres=# select count(*) From pgbench_accounts ;
  count   
-----------------
 10000000

Before update the size of the table is 1 GB

postgres=# select pg_relation_size('pgbench_accounts')/1024/1024/1024;

?column? 
--------
   1

postgres=# update pgbench_accounts set abalance=1;
UPDATE 10000000

After update, the size of the table increased to 2 GB after the UPDATE

postgres=# select pg_relation_size('pgbench_accounts')/1024/1024/1024;

?column? 
---------
    2

That means, number of blocks allocated to the table has increased by 100%. If the FILLFACTOR was configured, the size of the table may not have increased by that margin.

How to know what value to configure to FILLFACTOR?

It all depends on what columns are being updated and the size of the updated columns. In general, it would be good to evaluate the FILLFACTOR value by testing it out in UAT Databases. If the columns being updated are say 10% of the whole table, then, consider configuring fillfactor to 90% or 80%.

Important Note:
If you change the FILLFACTOR value for the existing table with the data, you will need to do a VACUUM FULL or a re-organization of the table to ensure FILLFACTOR value is in effect for the existing data.

VACUUMing TIPS

  • As said above, consider running VACUUM ANALYZE job manually every night on the heavily used tables even when autovacuum is enabled.
  • Consider running VACUUM ANALYZE on tables after bulk INSERT. This is important as many believe that VACUUMing may not be needed after INSERTs.
  • Monitor to ensure highly active tables are getting VACUUMed regularly by querying the table pg_stat_user_tables.
  • Use pg_stattuple contrib module to identify the size of the bloated space within the table segments.
  • VACUUM FULL utility cannot be used on production database systems. Consider using tools like pg_reorg or pg_repack which will help reorganize tables and indexes online without locks.
  • Ensure AUTOVACUUM process does run for a longer time during business (high traffic) hours.
  • Enable log_autovacuum_min_duration parameter to log the timings and duration of AUTOVACUUM processes.
  • Importantly, ensure FILLFACTOR is configured to an optimal value on high transaction Tables and Indexes.
Download the Whitepaper Today
 
PostgreSQL Management & Automation with ClusterControl
Learn about what you need to know to deploy, monitor, manage and scale PostgreSQL

Other I/O problems

Disk Sorting

Queries performing sorting is another common occurrence in real-time production databases and most of these cannot be avoided. Queries using clauses like GROUP BY, ORDER BY, DISTINCT, CREATE INDEX, VACUUM FULL etc. perform sorting and the sorting can take place on disk. Sorting takes place in the memory if the selection and sorting is done based on indexed columns. This is where composite-indexes play a key role. Indexes are aggressively cached into memory. Otherwise, if there arises a need to sort the data on disk, the performance would slow down drastically.

To ensure sorting takes place in memory, the work_mem parameter can be used. This parameter can be configured to a value such that the whole sorting can be done in memory. The core advantage of this parameter is that, apart from configuring it in postgresql.conf, it can also be configured at session level, user level or database level. How much should the work_mem value be? How to know which queries are performing disk sorting? How to monitor queries performing disk sorting on a real-time production database?

The answer is - configure log_temp_files parameter to a certain value. The value is in bytes, a value of 0 logs all the temp files (along with their sizes) generated on disk due to disk sorting. Once the parameter is configured, you will be able to see the following messages in the log files

2018-06-07 22:48:02.358 IST [4219] LOG:  temporary file: path "base/pgsql_tmp/pgsql_tmp4219.0", size 200425472
2018-06-07 22:48:02.358 IST [4219] STATEMENT:  create index bid_idx on pgbench_accounts(bid);
2018-06-07 22:48:02.366 IST [4219] LOG:  duration: 6421.705 ms  statement: create index bid_idx on pgbench_accounts(bid);

The above message means that the CREATE INDEX query was performing disk sorting and has generated a file of size 200425472 bytes which is 191+ MB. That precisely means, the work_mem parameter must be configured to 191+ MB or above for this particular query to perform memory sorting.

Well, for the application queries, work_mem parameter can only be configured at the user level. Before doing so, beware of the number of connections that user is making to the database and number of sorting queries being executed by that user. Because PostgreSQL tries to allocate work_mem to each process (performing sorting) in each connection which could potentially starve the memory on the database server.

Database file-system layout

Designing efficient and performance conducive database file-system layout is important from performance and scalability perspective. Importantly, this is not dependent on the database size. In general, the perception is that huge size databases will need high performance disk architecture which is NOT true. Even if the database size is 50 GB, you may be in need of a good disk architecture. And this may not be possible without incurring extra costs.

Here are some TIPS for the same:

  • Ensure the database has multiple tablespaces, with tables and indexes grouped based on the transaction rates.
  • The tablespace must be placed across multiple disk file systems for balanced I/O. This will also ensure multiple CPUs come into play to perform transactions across multiple disks.
  • Consider placing pg_xlog or pg_wal directory on a separate disk on a high transaction database.
  • Ensure *_cost parameters are configured based on the infrastructure
  • Use iostat, mpstat and other I/O monitoring tools to understand the I/O stats across all the disks and architect / manage the database objects accordingly.

PostgreSQL on Cloud

Infrastructure is critical for good database performance. Performance engineering strategies differ based on infrastructure and environment. Special care needs to be taken for PostgreSQL databases hosted in the cloud. Performance benchmarking for databases hosted on physical barebone servers in a local data center can be entirely different from databases hosted in the public cloud.

In general, cloud instances could be a little slower and benchmarks differ by considerable margin especially in terms of I/O. Always perform I/O latency checks before choosing / building a cloud instance. To my surprise, I learnt that performance of cloud instances can vary depending on the regions too, even though they are from the same cloud provider. To explain this further, a cloud instance with same specs built in two different regions could give you different performance results.

Bulk data load

Offline bulk data loading operations are pretty common in the database world. They can generate significant I/O load, which in turn slows down the data load performance. I have faced such challenges in my experience as DBA. Often, data load gets terribly slow and has to be tuned. Here are some tips. Mind you, these apply to offline data loading operations only and cannot be considered for data loading on live production database.

  • Since most of the data load operations are carried out during off business hours, ensure the following parameters are configured during the data load -
    • Configure checkpoint related values big enough so that checkpoints do not cause any performance issues.
    • Switch off full_page_write
    • Switch off wal archiving
    • Configure synchronous_commit parameter to “off”
    • Drop constraints and indexes for those tables subjected to the data load (Constraints and indexes can be re-created post the data load with a bigger work_mem value)
    • If you are doing the data load from a CSV file, bigger maintenance_work_mem can get you good results.
    • Though there will be a significant performance benefit, DO NOT switch off fsync parameter as that could lead to data corruption.

TIPS for cloud performance analysis

  • Perform thorough I/O latency tests using pgbench. In my experience, I had pretty ordinary performance results when doing disk latency checks as part of TPS evaluation. There were issues with cache performance on some public cloud instances. This will help chose the appropriate specs for the cloud instance chosen for the databases.
  • Cloud instances can perform differently from region to region. A cloud instance with certains specs in a region can give different performance results compared to a cloud instance with same specs in another region. My pgbench tests executed on multiple cloud instances (all same specs with the same cloud vendor) across different regions gave me different results on some of them. This is important especially when you are migrating to cloud.
  • Query performance on the cloud might need a different tuning approach. DBAs will need to be using *_cost parameters to ensure healthy query execution plans are generated.

Tools to monitor PostgreSQL performance

There are various tools to monitor PostgreSQL performance. Let me highlight some of those.

  • pg_top is a GREAT tool to monitor PostgreSQL database dynamically. I would highly recommend this tool for DBAs for various reasons. This tool has numerous advantages, let me list them out:
    • pg_top tool uses textual interface and is similar to Unix “top” utility.
    • Will clearly list out the processes and the hardware resources utilized. What excites me with this tool is that it will clearly tell you if a particular process is currently on DISK or CPU - in my view that’s excellent. DBAs can clearly pick the process running for longer time on the disk.
    • You can check the EXPLAIN PLAN of the top SQLs dynamically or instantly
    • You can also find out what Tables or Indexes are being scanned instantly
  • Nagios is a popular monitoring tool for PostgreSQL which has both open-source and commercial versions. Open source version should suffice for monitoring. Custom Perl scripts can be built and plugged into Nagios module.
  • Pgbadger is a popular tool which can be used to analyze PostgreSQL log files and generate performance reports. This report can be used to analyze the performance of checkpoints, disk sorting.
  • Zabbix is another popular tool used for PostgreSQL monitoring.

ClusterControl is an up-and-coming management platform for PostgreSQL. Apart from monitoring, it also has functionality to deploy replication setups with load balancers, automatic failover, backup management, among others.

Disaster Recovery Planning for MySQL & MariaDB

$
0
0

Introduction

The cost of downtime can vary significantly between different organizations, and in some cases, it may be enough to cause a company to go out of business. To mitigate the impact of downtime, organizations need an appropriate disaster recovery plan in place. But how much should a business invest? Designing a highly available system comes at a cost, and not all businesses and certainly not all applications need five 9’s availability.

The best disaster recovery strategy for an application largely depends on it’s importance to the business, and more specifically, RTO (Recovery Time Objective) and RPO (Recovery Point Objective). RTO is the maximum period of time within which an application must be restored after a disruption. RPO is the determined maximum period of time that can pass during which data is lost. Can the business afford to lose 5 hours of data, or no more than 5 minutes? Can it be down for 4 hours, or at most 15 minutes? Knowing these numbers will go a long way in helping IT determine a disaster recovery strategy, as well as the best database solution to support it.

Therefore, disaster recovery can be implemented at different levels. They can be anything from periodic full backups that are archived offsite, to multi-datacenter setups with synchronous data replication. What is right for the business will vary by mission-criticalness.

As we will see in this whitepaper, outages are inevitable but understanding the timeline of an outage can help us better prepare, diagnose and recover from one. With regards to the database, different mechanisms can be implemented as part of a DR plan in order to prepare and respond to an outage. Higher levels of DR require increasing amounts of eventualities that one would have to plan for. We will look at the different levels, and specifically at the database mechanisms required for each level. Finally, we will see how these mechanisms can be fully automated with ClusterControl, a management platform for open source database systems.

Architecture and Tuning of Memory in PostgreSQL Databases

$
0
0

Memory management in PostgreSQL is important for improving the performance of the database server. PostgreSQL configuration file (postgres.conf) manages the configuration of the database server. It uses default values of the parameters, but we can change these values to better reflect workload and operating environment.

In this blog, we’ll cover these memory related parameters. But before we start, let’s have a look at the memory architecture in PostgreSQL.

Memory Architecture

Memory in PostgreSQL can be classified into two categories:

  1. Local Memory area: It is allocated by each backend process for its own use.
  2. Shared memory area: It is used by all processes of a PostgreSQL server.

Local Memory Area

In PostgreSQL, each backend process allocates local memory for query processing; each area is divided into sub-areas whose sizes are either fixed or variable.

The sub-areas are as follow.

Work_mem

The executor uses this area for sorting tuples by ORDER BY and DISTINCT operations. It also uses it for joining tables by merge-join and hash-join operations.

Maintenance_work_mem

This parameter is used for some kinds of maintenance operations (VACUUM, REINDEX).

Temp_buffers

The executor uses this area for storing temporary tables.

Shared Memory Area

Shared memory area is allocated by PostgreSQL server when it starts up. This areas is divided into several fixed sized sub-areas.

Shared buffer pool

PostgreSQL loads pages within tables and indexes from persistent storage to a shared buffer pool, and then operates on them directly.

WAL buffer

PostgreSQL supports the WAL (Write ahead log) mechanism to ensure that no data is lost after a server failure. WAL data is really a transaction log in PostgreSQL and WAL buffer is a buffering area of the WAL data before writing it to a persistent storage.

Commit Log

The, commit log (CLOG) keeps the states of all transactions, and is part of the concurrency control mechanism. The commit log is allocated to the shared memory and used throughout transaction processing.

PostgreSQL defines the following four transaction states.

  1. IN_PROGRESS
  2. COMMITTED
  3. ABORTED
  4. SUB-COMMITTED
Download the Whitepaper Today
 
PostgreSQL Management & Automation with ClusterControl
Learn about what you need to know to deploy, monitor, manage and scale PostgreSQL

Tuning PostgreSQL Memory parameters

There are some important parameters which are recommended for memory management in PostgreSQL. You should take into account the following.

Shared_buffers

This parameter designates the amount of memory used for shared memory buffers. The shared_buffers parameter determines how much memory is dedicated to to the server for caching data. The default value of shared_buffers is typically 128 megabytes (128MB).

The default value of this parameter is very low because on some platforms like older Solaris versions and SGI, having large values requires invasive action like recompiling the kernel. Even on the modern Linux systems, the kernel will likely not allow setting shared_buffers to over 32MB without adjusting kernel settings first.

The mechanism has changed in PostgreSQL 9.4 and later, so kernel settings will not have to be adjusted there.

If there is high load on the database server, then setting a high value will improve performance.

If you have a dedicated DB server with 1GB or more of RAM, a reasonable starting value for shared_buffer configuration parameter is 25% of the memory in your system.

Default value of shared_buffers = 128 MB. The change requires restart of PostgreSQL server.

General recommendation to set the shared_buffers is as follows.

  • Below 2GB memory, set the value of shared_buffers to 20% of total system memory.
  • Below 32GB memory, set the value of shared_buffers to 25% of total system memory.
  • Above 32GB memory, set the value of shared_buffers to 8GB

Work_mem

This parameter specifies the amount of memory to be used by internal sort operations and hash tables before writing to temporary disk files. If a lot of complex sorts are happening, and you have enough memory, then increasing the work_mem parameter allows PostgreSQL to do larger in-memory sorts which will be faster than disk based equivalents.

Note that for a complex query, many sort or hash operations might be running in parallel. Each operation will be allowed to use as much memory as this value specifies before it starts to write data into the temporary files. There is one possibility that several sessions could be doing such operations concurrently. Therefore, the total memory used could be many times the value of work_mem parameter.

Please remember that when choosing the right value. Sort operations are used for ORDER BY, DISTINCT and merge joins. Hash tables are used in hash joins, hash based processing of IN subqueries and hash based aggregation.

The parameter log_temp_files can be used to log sorts, hashes and temp files which can be useful in figuring out if sorts are spilling to disk instead of fitting in memory. You can check the sorts spilling to disk using EXPLAIN ANALYZE plans. For example, in the output of EXPLAIN ANALYZE, if you see the line like: “Sort Method: external merge Disk: 7528kB”, a work_mem of at least 8MB would keep the intermediate data in memory and improve the query response time.

The default value of work_mem = 4MB.

General recommendation to set the work_mem is as follows.

  • Start with low value: 32-64MB
  • Then look for ‘temporary file’ lines in logs
  • Set to 2-3 times the largest temp file

maintenance _work_mem

This parameter specifies the maximum amount of memory used by maintenance operations such as VACUUM, CREATE INDEX and ALTER TABLE ADD FOREIGN KEY. Since only one of these operations can be executed at a time by a database session and a PostgreSQL installation doesn’t have many of them running concurrently, it is safe to set the value of maintenance_work_mem significantly larger than work_mem.

Setting the larger value might improve performance for vacuuming and restoring database dumps.

It is necessary to remember that when autovacuum runs, up to autovacuum_max_workers times this memory may be allocated, so be careful not to set the default value too high.

The default value of maintenance_work_mem = 64MB.

General recommendation to set maintenance_work_mem is as follows.

  • Set the value 10% of system memory, up to 1GB
  • Maybe you can set it even higher if you are having VACUUM problems

Effective_cache_size

The effective_cache_size should be set to an estimate of how much memory is available for disk caching by the operating system and within the database itself. This is a guideline for how much memory you expect to be available in the operating system and PostgreSQL buffer caches, not an allocation.

PostgreSQL query planner uses this value to figure out whether the plans it’s considering would be expected to fit in RAM or not. If it is set too low, indexes may not be used for executing queries the way you would expect. As most Unix systems are fairly aggressive when caching, at least 50% of the available RAM on a dedicated database server will be full of cached data.

General recommendation for effective_cache_size is as follows.

  • Set the value to the amount of file system cache available
  • If you don’t know, set the value to the 50% of total system memory

The default value of effective_cache_size = 4GB.

Temp_buffers

This parameter sets the maximum number of temporary buffers used by each database session. The session local buffers are used only for access to temporary tables. The setting of this parameter can be changed within individual sessions but only before the first use of temporary tables within the session.

PostgreSQL database utilizes this memory area for holding the temporary tables of each session, these will be cleared when the connection is closed.

The default value of temp_buffer = 8MB.

Conclusion

Understanding the memory architecture and tuning the appropriate parameters is important to improve the performance. This is especially necessary for high workload systems. For more generic performance tuning tips, please review this performance cheat sheet for PostgreSQL.

Schema Management Tips for MySQL & MariaDB

$
0
0

Database schema is not something that is written in stone. It is designed for a given application, but then the requirements may and usually do change. New modules and functionalities are added to the application, more data is collected, code and data model refactoring is performed. Thereby the need to modify the database schema to adapt to these changes; adding or modifying columns, creating new tables or partitioning large ones. Queries change too as developers add new ways for users to interact with the data - new queries could use new, more efficient indexes so we rush to create them in order to provide the application with the best database performance.

So, how do we best approach a schema change? What tools are useful? How to minimize the impact on a production database? What are the most common issues with schema design? What tools can help you to stay on top of your schema? In this blog post we will give you a short overview of how to do schema changes in MySQL and MariaDB. Please note that we will not discuss schema changes in the context of Galera Cluster. We already discussed Total Order Isolation, Rolling Schema Upgrades and tips to minimize impact from RSU in previous blog posts. We will also discuss tips and tricks related to schema design and how ClusterControl can help you to stay on top of all schema changes.

Types of Schema Changes

First things first. Before we dig into the topic, we have to understand how MySQL and MariaDB perform schema changes. You see, one schema change is not equal to another schema change.

You may have heard about online alters, instant alters or in-place alters. All of this is a result of work which is ongoing to minimize the impact of the schema changes on the production database. Historically, almost all schema changes were blocking. If you executed a schema change, all of the queries will start to pile up, waiting for the ALTER to complete. Obviously, this posed serious issues for production deployments. Sure, people immediately start to look for workarounds, and we will discuss them later in this blog, as even today those are still relevant. But also, work started to improve capability of MySQL to run DDL’s (Data Definition Language) without much impact to other queries.

Instant Changes

Sometimes it is not needed to touch any data in the tablespace, because all that has to be changed is the metadata. An example here will be dropping an index or renaming a column. Such operations are quick and efficient. Typically, their impact is limited. It is not without any impact, though. Sometimes it takes couple of seconds to perform the change in the metadata and such change requires a metadata lock to be acquired. This lock is on a per-table basis, and it may block other operations which are to be executed on this table. You’ll see this as “Waiting for table metadata lock” entries in the processlist.

An example of such change may be instant ADD COLUMN, introduced in MariaDB 10.3 and MySQL 8.0. It gives the possibility to execute this quite popular schema change without any delay. Both MariaDB and Oracle decided to include code from Tencent Game which allows to instantly add a new column to the table. This is under some specific conditions; column has to be added as the last one, full text indexes cannot exist in the table, row format cannot be compressed - you can find more information on how instant add column works in MariaDB documentation. For MySQL, the only official reference can be found on mysqlserverteam.com blog, although a bug exists to update the official documentation.

In Place Changes

Some of the changes require modification of the data in the tablespace. Such modifications can be performed on the data itself, and there’s no need to create a temporary table with a new data structure. Such changes, typically (although not always) allow other queries touching the table to be executed while the schema change is running. An example of such operation is to add a new secondary index to the table. This operation will take some time to perform but will allow DML’s to be executed.

Table Rebuild

If it is not possible to make a change in place, InnoDB will create a temporary table with the new, desired structure. It will then copy existing data to the new table. This operation is the most expensive one and it is likely (although it doesn’t always happen) to lock the DML’s. As a result, such schema change is very tricky to execute on a large table on a standalone server, without help of external tools - typically you cannot afford to have your database locked for long minutes or even hours. An example of such operation would be to change the column data type, for example from INT to VARCHAR.

Schema Changes and Replication

Ok, so we know that InnoDB allow online schema changes and if we consult MySQL documentation, we will see that the majority of the schema changes (at least among the most common ones) can be performed online. What is the reason behind dedicating hours of development to create online schema change tools like gh-ost? We can accept that pt-online-schema-change is a remnant of the old, bad times but gh-ost is a new software.

The answer is complex. There are two main issues.

For starters, once you start a schema change, you do not have control over it. You can abort it but you cannot pause it. You cannot throttle it. As you can imagine, rebuilding the table is an expensive operation and even if InnoDB allows DML’s to be executed, additional I/O workload from the DDL affects all other queries and there’s no way to limit this impact to a level that is acceptable to the application.

Second, even more serious issue, is replication. If you execute a non-blocking operation, which requires a table rebuild, it will indeed not lock DML’s but this is true only on the master. Let’s assume such DDL took 30 minutes to complete - ALTER speed depends on the hardware but it is fairly common to see such execution times on tables of 20GB size range. It is then replicated to all slaves and, from the moment DDL starts on those slaves, replication will wait for it to complete. It does not matter if you use MySQL or MariaDB, or if you have multi-threaded replication. Slaves will lag - they will wait those 30 minutes for the DDL to complete before the commence applying the remaining binlog events. As you can imagine, 30 minutes of lag (sometimes even 30 seconds will be not acceptable - it all depends on the application) is something which makes impossible to use those slaves for scale-out. Of course, there are workarounds - you can perform schema changes from the bottom to the top of the replication chain but this seriously limits your options. Especially if you use row-based replication, you can only execute compatible schema changes this way. Couple of examples of limitations of row-based replication; you cannot drop any column which is not the last one, you cannot add a column into a position other than the last one. You cannot also change column type (for example, INT -> VARCHAR).

As you can see, replication adds complexity into how you can perform schema changes. Operations which are non-blocking on the standalone host become blocking while executed on slaves. Let’s take a look at couple of methods you can use to minimize the impact of schema changes.

Online Schema Change Tools

As we mentioned earlier, there are tools, which are intended to perform schema changes. The most popular ones are pt-online-schema-change created by Percona and gh-ost, created by GitHub. In a series of blog posts we compared them and discussed how gh-ost can be used to perform schema changes and how you can throttle and reconfigure an undergoing migration. Here we will not go into details, but we would still like to mention some of the most important aspects of using those tools. For starters, a schema change executed through pt-osc or gh-ost will happen on all database nodes at once. There is no delay whatsoever in terms of when the change will be applied. This makes it possible to use those tools even for schema changes that are incompatible with row-based replication. The exact mechanisms about how those tools track changes on the table is different (triggers in pt-osc vs. binlog parsing in gh-ost) but the main idea is the same - a new table is created with the desired schema and existing data is copied from the old table. In the meantime, DML’s are tracked (one way or the other) and applied to the new table. Once all the data is migrated, tables are renamed and the new table replaces the old one. This is atomic operation so it is not visible to the application. Both tools have an option to throttle the load and pause the operations. Gh-ost can stop all of the activity, pt-osc only can stop the process of copying data between old and new table - triggers will stay active and they will continue duplicating data, which adds some overhead. Due to the rename table, both tools have some limitations regarding foreign keys - not supported by gh-ost, partially supported by pt-osc either through regular ALTER, which may cause replication lag (not feasible if the child table is large) or by dropping the old table before renaming the new one - it’s dangerous as there’s no way to rollback if, for some reason, data wasn’t copied to the new table correctly. Triggers are also tricky to support.

They are not supported in gh-ost, pt-osc in MySQL 5.7 and newer has limited support for tables with existing triggers. Other important limitations for online schema change tools is that unique or primary key has to exist in the table. It is used to identify rows to copy between old and new tables. Those tools are also much slower than direct ALTER - a change which takes hours while running ALTER may take days when performed using pt-osc or gh-ost.

On the other hand, as we mentioned, as long as the requirements are satisfied and limitations won’t come into play, you can run all schema changes utilizing one of the tools. All will happen at the same time on all hosts thus you don’t have to worry about compatibility. You have also some level of control over how the process is executed (less in pt-osc, much more in gh-ost).

You can reduce the impact of the schema change, you can pause them and let them run only under supervision, you can test the change before actually performing it. You can have them track replication lag and pause should an impact be detected. This makes those tools a really great addition to the DBA’s arsenal while working with MySQL replication.

ClusterControl
Single Console for Your Entire Database Infrastructure
Find out what else is new in ClusterControl

Rolling Schema Changes

Typically, a DBA will use one of the online schema change tools. But as we discussed earlier, under some circumstances, they cannot be used and a direct alter is the only viable option. If we are talking about standalone MySQL, you have no choice - if the change is non-blocking, that’s good. If it is not, well, there’s nothing you can do about it. But then, not that many people run MySQL as single instances, right? How about replication? As we discussed earlier, direct alter on the master is not feasible - most of the cases it will cause lag on the slave and this may not be acceptable. What can be done, though, is to execute the change in a rolling fashion. You can start with slaves and, once the change is applied on all of them, promote one of the slaves as a new master, demote the old master to a slave and execute the change on it. Sure, the change has to be compatible but, to tell the truth, the most common cases where you cannot use online schema changes is because of a lack of primary or unique key. For all other cases, there is some sort of workaround, especially in pt-online-schema-change as gh-ost has more hard limitations. It is a workaround you would call “so so” or “far from ideal”, but it will do the job if you have no other option to pick from. What is also important, most of the limitations can be avoided if you monitor your schema and catch the issues before the table grows. Even if someone creates a table without a primary key, it is not a problem to run a direct alter which takes half a second or less, as the table is almost empty.

If it will grow, this will become a serious problem but it is up to the DBA to catch this kind of issues before they actually start to create problems. We will cover some tips and tricks on how to make sure you will catch such issues on time. We will also share generic tips on how to design your schemas.

Tips and Tricks

Schema Design

As we showed in this post, online schema change tools are quite important when working with a replication setup therefore it is quite important to make sure your schema is designed in such a way that it will not limit your options for performing schema changes. There are three important aspects. First, primary or unique key has to exist - you need to make sure there are no tables without a primary key in your database. You should monitor this on a regular basis, otherwise it may become a serious problem in the future. Second, you should seriously consider if using foreign keys is a good idea. Sure, they have their uses but they also add overhead to your database and they can make it problematic to use online schema change tools. Relations can be enforced by the application. Even if it means more work, it still may be a better idea than to start using foreign keys and be severely limited to which types of schema changes can be performed. Third, triggers. Same story as with foreign keys. They are a nice feature to have, but they can become a burden. You need to seriously consider if the gains from using them outweight the limitations they pose.

Tracking Schema Changes

Schema change management is not only about running schema changes. You also have to stay on top of your schema structure, especially if you are not the only one doing the changes.

ClusterControl provides users with tools to track some of the most common schema design issues. It can help you to track tables which do not have primary keys:

As we discussed earlier, catching such tables early is very important as primary keys have to be added using direct alter.

ClusterControl can also help you track duplicate indexes. Typically, you don’t want to have multiple indexes which are redundant. In the example above, you can see that there is an index on (k, c) and there’s also an index on (k). Any query which can use index created on column ‘k’ can also use a composite index created on columns (k, c). There are cases where it is beneficial to keep redundant indexes but you have to approach it on case by case basis. Starting from MySQL 8.0, it is possible to quickly test if an index is really needed or not. You can make a redundant index ‘invisible’ by running:

ALTER TABLE sbtest.sbtest1 ALTER INDEX k_1 INVISIBLE;

This will make MySQL ignore that index and, through monitoring, you can check if there was any negative impact on the performance of the database. If everything works as planned for some time (couple of days or even weeks), you can plan on removing the redundant index. In case you detected something is not right, you can always re-enable this index by running:

ALTER TABLE sbtest.sbtest1 ALTER INDEX k_1 VISIBLE;

Those operations are instant and the index is there all the time, and is still maintained - it’s only that it will not be taken into consideration by the optimizer. Thanks to this option, removing indexes in MySQL 8.0 will be much safer operation. In the previous versions, re-adding a wrongly removed index could take hours if not days on large tables.

ClusterControl can also let you know about MyISAM tables.

While MyISAM still may have its uses, you have to keep in mind that it is not a transactional storage engine. As such, it can easily introduce data inconsistency between nodes in a replication setup.

Another very useful feature of ClusterControl is one of the operational reports - a Schema Change Report.

In an ideal world, a DBA reviews, approves and implements all of the schema changes. Unfortunately, this is not always the case. Such review process just does not go well with agile development. In addition to that, Developer-to-DBA ratio typically is quite high which can also become a problem as DBA’s would struggle not to become a bottleneck. That’s why it is not uncommon to see schema changes performed outside of the DBA’s knowledge. Yet, the DBA is usually the one responsible for the database’s performance and stability. Thanks to the Schema Change Report, they can now keep track of the schema changes.

At first some configuration is needed. In a configuration file for a given cluster (/etc/cmon.d/cmon_X.cnf), you have to define on which host ClusterControl should track the changes and which schemas should be checked.

schema_change_detection_address=10.0.0.126
schema_change_detection_databases=sbtest

Once that’s done, you can schedule a report to be executed on a regular basis. An example output may be like below:

As you can see, two tables have changed since the previous run of the report. In the first one, a new composite index has been created on columns (k, c). In the second table, a column was added.

In the subsequent run we got information about new table, which was created without any index or primary key. Using this kind of info, we can easily act when it is needed and solve the issues before they actually start to become blockers.

Our Guide to MySQL & MariaDB Performance Tuning

$
0
0
Wednesday, June 27, 2018 - 11:00

If you’re asking yourself the following questions when it comes to optimally running your MySQL or MariaDB databases:

  • How do I tune them to make best use of the hardware?
  • How do I optimize the Operating System?
  • How do I best configure MySQL or MariaDB for a specific database workload?

Then this replay is for you!

We discuss some of the settings that are most often tweaked and which can bring you significant improvement in the performance of your MySQL or MariaDB database. We also cover some of the variables which are frequently modified even though they should not.

Performance tuning is not easy, especially if you’re not an experienced DBA, but you can go a surprisingly long way with a few basic guidelines.

This webinar builds upon blog posts by Krzysztof from the ‘Become a MySQL DBA’ series.

Watch the Webinar Replay: MySQL & MariaDB Performance Tuning for Dummies

$
0
0

Thanks to everyone who participated in this week’s webinar on Performance Tuning for MySQL & MariaDB!

If you’ve missed the live session or would like to watch it again, it is now available online to view; especially if any of the following questions sound familiar to you:

You’re running MySQL or MariaDB as backend database, how do you tune it to make best use of the hardware? How do you optimize the Operating System? How do you best configure MySQL or MariaDB for a specific database workload?

MySQL & MariaDB Performance Tuning Webinar

A database server needs CPU, memory, disk and network in order to function. Understanding these resources is important for anybody managing a production database. Any resource that is weak or overloaded can become a limiting factor and cause the database server to perform poorly.

In this webinar, we discuss some of the settings that are most often tweaked and which can bring you significant improvement in the performance of your MySQL or MariaDB database. We also cover some of the variables which are frequently modified even though they should not.

Performance tuning is not easy, especially if you’re not an experienced DBA, but you can go a surprisingly long way with a few basic guidelines.

Agenda

  • What to tune and why?
  • Tuning process
  • Operating system tuning
    • Memory
    • I/O performance
  • MySQL configuration tuning
    • Memory
    • I/O performance
  • Useful tools
  • Do’s and do not’s of MySQL tuning
  • Changes in MySQL 8.0

Speaker

Krzysztof Książek, Senior Support Engineer at Severalnines, is a MySQL DBA with experience managing complex database environments for companies like Zendesk, Chegg, Pinterest and Flipboard.

This webinar builds upon blog posts by Krzysztof from the ‘Become a MySQL DBA’ series.


How to Improve Performance of Galera Cluster for MySQL or MariaDB

$
0
0

Galera Cluster comes with many notable features that are not available in standard MySQL replication (or Group Replication); automatic node provisioning, true multi-master with conflict resolutions and automatic failover. There are also a number of limitations that could potentially impact cluster performance. Luckily, if you are not aware of these, there are workarounds. And if you do it right, you can minimize the impact of these limitations and improve overall performance.

We have previously covered many tips and tricks related to Galera Cluster, including running Galera on AWS Cloud. This blog post distinctly dives into the performance aspects, with examples on how to get the most out of Galera.

Replication Payload

A bit of introduction - Galera replicates writesets during the commit stage, transferring writesets from the originator node to the receiver nodes synchronously through the wsrep replication plugin. This plugin will also certify writesets on the receiver nodes. If the certification process passes, it returns OK to the client on the originator node and will be applied on the receiver nodes at a later time asynchronously. Else, the transaction will be rolled back on the originator node (returning error to the client) and the writesets that have been transferred to the receiver nodes will be discarded.

A writeset consists of write operations inside a transaction that changes the database state. In Galera Cluster, autocommit is default to 1 (enabled). Literally, any SQL statement executed in Galera Cluster will be enclosed as a transaction, unless you explicitly start with BEGIN, START TRANSACTION or SET autocommit=0. The following diagram illustrates the encapsulation of a single DML statement into a writeset:

For DML (INSERT, UPDATE, DELETE..), the writeset payload consists of the binary log events for a particular transaction while for DDLs (ALTER, GRANT, CREATE..), the writeset payload is the DDL statement itself. For DMLs, the writeset will have to be certified against conflicts on the receiver node while for DDLs (depending on wsrep_osu_method, default to TOI), the cluster cluster runs the DDL statement on all nodes in the same total order sequence, blocking other transactions from committing while the DDL is in progress (see also RSU). In simple words, Galera Cluster handles DDL and DML replication differently.

Round Trip Time

Generally, the following factors determine how fast Galera can replicate a writeset from an originator node to all receiver nodes:

  • Round trip time (RTT) to the farthest node in the cluster from the originator node.
  • The size of a writeset to be transferred and certified for conflict on the receiver node.

For example, if we have a three-node Galera Cluster and one of the nodes is located 10 milliseconds away (0.01 second), it's very unlikely you might be able to write more than 100 times per second to the same row without conflicting. There is a popular quote from Mark Callaghan which describes this behaviour pretty well:

"[In a Galera cluster] a given row can’t be modified more than once per RTT"

To measure RTT value, simply perform ping on the originator node to the farthest node in the cluster:

$ ping 192.168.55.173 # the farthest node

Wait for a couple of seconds (or minutes) and terminate the command. The last line of the ping statistic section is what we are looking for:

--- 192.168.55.172 ping statistics ---
65 packets transmitted, 65 received, 0% packet loss, time 64019ms
rtt min/avg/max/mdev = 0.111/0.431/1.340/0.240 ms

The max value is 1.340 ms (0.00134s) and we should take this value when estimating the minimum transactions per second (tps) for this cluster. The average value is 0.431ms (0.000431s) and we can use to estimate the average tps while min value is 0.111ms (0.000111s) which we can use to estimate the maximum tps. The mdev means how the RTT samples were distributed from the average. Lower value means more stable RTT.

Hence, transactions per second can be estimated by dividing RTT (in second) into 1 second:

Resulting,

  • Minimum tps: 1 / 0.00134 (max RTT) = 746.26 ~ 746 tps
  • Average tps: 1 / 0.000431 (avg RTT) = 2320.19 ~ 2320 tps
  • Maximum tps: 1 / 0.000111 (min RTT) = 9009.01 ~ 9009 tps

Note that this is just an estimation to anticipate replication performance. There is not much we can do to improve this on the database side, once we have everything deployed and running. Except, if you move or migrate the database servers closer to each other to improve the RTT between nodes, or upgrade the network peripherals or infrastructure. This would require maintenance window and proper planning.

Chunk Up Big Transactions

Another factor is the transaction size. After the writeset is transferred, there will be a certification process. Certification is a process to determine whether or not the node can apply the writeset. Galera generates MD5 checksum pseudo keys from every full row. The cost of certification depends on the size of the writeset, which translates into a number of unique key lookups into the certification index (a hash table). If you update 500,000 rows in a single transaction, for example:

# a 500,000 rows table
mysql> UPDATE mydb.settings SET success = 1;

The above will generate a single writeset with 500,000 binary log events in it. This huge writeset does not exceed wsrep_max_ws_size (default to 2GB) so it will be transferred over by Galera replication plugin to all nodes in the cluster, certifying these 500,000 rows on the receiver nodes for any conflicting transactions that are still in the slave queue. Finally, the certification status is returned to the group replication plugin. The bigger the transaction size, the higher risk it will be conflicting with other transactions that come from another master. Conflicting transactions waste server resources, plus cause a huge rollback to the originator node. Note that a rollback operation in MySQL is way slower and less optimized than commit operation.

The above SQL statement can be re-written into a more Galera-friendly statement with the help of simple loop, like the example below:

(bash)$ for i in {1..500}; do \
mysql -uuser -ppassword -e "UPDATE mydb.settings SET success = 1 WHERE success != 1 LIMIT 1000"; \
sleep 2; \
done

The above shell command would update 1000 rows per transaction for 500 times and wait for 2 seconds between executions. You could also use a stored procedure or other means to achieve a similar result. If rewriting the SQL query is not an option, simply instruct the application to execute the big transaction during a maintenance window to reduce the risk of conflicts.

For huge deletes, consider using pt-archiver from the Percona Toolkit - a low-impact, forward-only job to nibble old data out of the table without impacting OLTP queries much.

Parallel Slave Threads

In Galera, the applier is a multithreaded process. Applier is a thread running within Galera to apply the incoming write-sets from another node. Which means, it is possible for all receivers to execute multiple DML operations that come right from the originator (master) node simultaneously. Galera parallel replication is only applied to transactions when it is safe to do so. It improves the probability of the node to sync up with the originator node. However, the replication speed is still limited to RTT and writeset size.

To get the best out of this, we need to know two things:

  • The number of cores the server has.
  • The value of wsrep_cert_deps_distance status.

The status wsrep_cert_deps_distance tells us the potential degree of parallelization. It is the value of the average distance between highest and lowest seqno values that can be possibly applied in parallel. You can use the wsrep_cert_deps_distance status variable to determine the maximum number of slave threads possible. Take note that this is an average value across time. Hence, in order get a good value, you have to hit the cluster with writes operations through test workload or benchmark until you see a stable value coming out.

To get the number of cores, you can simply use the following command:

$ grep -c processor /proc/cpuinfo
4

Ideally, 2, 3 or 4 threads of slave applier per CPU core is a good start. Thus, the minimum value for the slave threads should be 4 x number of CPU cores, and must not exceed the wsrep_cert_deps_distance value:

MariaDB [(none)]> SHOW STATUS LIKE 'wsrep_cert_deps_distance';
+--------------------------+----------+
| Variable_name            | Value    |
+--------------------------+----------+
| wsrep_cert_deps_distance | 48.16667 |
+--------------------------+----------+

You can control the number of slave applier threads using wsrep_slave_thread variable. Even though this is a dynamic variable, only increasing the number would have an immediate effect. If you reduce the value dynamically, it would take some time, until the applier thread exits after it finishes applying. A recommended value is anywhere between 16 to 48:

mysql> SET GLOBAL wsrep_slave_threads = 48;

Take note that in order for parallel slave threads to work, the following must be set (which is usually pre-configured for Galera Cluster):

innodb_autoinc_lock_mode=2

Galera Cache (gcache)

Galera uses a preallocated file with a specific size called gcache, where a Galera node keeps a copy of writesets in circular buffer style. By default, its size is 128MB, which is rather small. Incremental State Transfer (IST) is a method to prepare a joiner by sending only the missing writesets available in the donor’s gcache. IST is faster than state snapshot transfer (SST), it is non-blocking and has no significant performance impact on the donor. It should be the preferred option whenever possible.

IST can only be achieved if all changes missed by the joiner are still in the gcache file of the donor. The recommended setting for this is to be as big as the whole MySQL dataset. If disk space is limited or costly, determining the right size of the gcache size is crucial, as it can influence the data synchronization performance between Galera nodes.

The below statement will give us an idea of the amount of data replicated by Galera. Run the following statement on one of the Galera nodes during peak hours (tested on MariaDB >10.0 and PXC >5.6, galera >3.x):

mysql> SET @start := (SELECT SUM(VARIABLE_VALUE/1024/1024) FROM information_schema.global_status WHERE VARIABLE_NAME LIKE 'WSREP%bytes'); do sleep(60); SET @end := (SELECT SUM(VARIABLE_VALUE/1024/1024) FROM information_schema.global_status WHERE VARIABLE_NAME LIKE 'WSREP%bytes'); SET @gcache := (SELECT SUBSTRING_INDEX(SUBSTRING_INDEX(@@GLOBAL.wsrep_provider_options,'gcache.size = ',-1), 'M', 1)); SELECT ROUND((@end - @start),2) AS `MB/min`, ROUND((@end - @start),2) * 60 as `MB/hour`, @gcache as `gcache Size(MB)`, ROUND(@gcache/round((@end - @start),2),2) as `Time to full(minutes)`;
+--------+---------+-----------------+-----------------------+
| MB/min | MB/hour | gcache Size(MB) | Time to full(minutes) |
+--------+---------+-----------------+-----------------------+
|   7.95 |  477.00 |  128            |                 16.10 |
+--------+---------+-----------------+-----------------------+

We can estimate that the Galera node can have approximately 16 minutes of downtime, without requiring SST to join (unless Galera cannot determine the joiner state). If this is too short time and you have enough disk space on your nodes, you can change the wsrep_provider_options="gcache.size=<value>" to a more appropriate value. In this example workload, setting gcache.size=1G allows us to have 2 hours of node downtime with high probability of IST when the node rejoins.

It's also recommended to use gcache.recover=yes in wsrep_provider_options (Galera >3.19), where Galera will attempt to recover the gcache file to a usable state on startup rather than delete it, thus preserving the ability to have IST and avoiding SST as much as possible. Codership and Percona have covered this in details in their blogs. IST is always the best method to sync up after a node rejoins the cluster. It is 50% faster than xtrabackup or mariabackup and 5x faster than mysqldump.

Asynchronous Slave

Galera nodes are tightly-coupled, where the replication performance is as fast as the slowest node. Galera use a flow control mechanism, to control replication flow among members and eliminate any slave lag. The replication can be all fast or all slow on every node and is adjusted automatically by Galera. If you want to know about flow control, read this blog post by Jay Janssen from Percona.

In most cases, heavy operations like long running analytics (read-intensive) and backups (read-intensive, locking) are often inevitable, which could potentially degrade the cluster performance. The best way to execute this type of queries is by sending them to a loosely-coupled replica server, for instance, an asynchronous slave.

An asynchronous slave replicates from a Galera node using the standard MySQL asynchronous replication protocol. There is no limit on the number of slaves that can be connected to one Galera node, and chaining it out with an intermediate master is also possible. MySQL operations that execute on this server won't impact the cluster performance, apart from the initial syncing phase where a full backup must be taken on the Galera node to stage the slave before establishing the replication link (although ClusterControl allows you to build the async slave from an existing backup first, before connecting it to the cluster).

GTID (Global Transaction Identifier) provides a better transactions mapping across nodes, and is supported in MySQL 5.6 and MariaDB 10.0. With GTID, the failover operation on a slave to another master (another Galera node) is simplified, without the need to figure out the exact log file and position. Galera also comes with its own GTID implementation but these two are independent to each other.

Scaling out an asynchronous slave is one-click away if you are using ClusterControl -> Add Replication Slave feature:

Take note that binary logs must be enabled on the master (the chosen Galera node) before we can proceed with this setup. We have also covered the manual way in this previous post.

The following screenshot from ClusterControl shows the cluster topology, it illustrates our Galera Cluster architecture with an asynchronous slave:

ClusterControl automatically discovers the topology and generates the super cool diagram like above. You can also perform administration tasks directly from this page by clicking on the top-right gear icon of each box.

SQL-aware Reverse Proxy

ProxySQL and MariaDB MaxScale are intelligent reverse-proxies which understand MySQL protocol and is capable of acting as a gateway, router, load balancer and firewall in front of your Galera nodes. With the help of Virtual IP Address provider like LVS or Keepalived, and combining this with Galera multi-master replication technology, we can have a highly available database service, eliminating all possible single-point-of-failures (SPOF) from the application point-of-view. This will surely improve the availability and reliability the architecture as whole.

Another advantage with this approach is you will have the ability to monitor, rewrite or re-route the incoming SQL queries based on a set of rules before they hit the actual database server, minimizing the changes on the application or client side and routing queries to a more suitable node for optimal performance. Risky queries for Galera like LOCK TABLES and FLUSH TABLES WITH READ LOCK can be prevented way ahead before they would cause havoc to the system, while impacting queries like "hotspot" queries (a row that different queries want to access at the same time) can be rewritten or being redirected to a single Galera node to reduce the risk of transaction conflicts. For heavy read-only queries like OLAP or backup, you can route them over to an asynchronous slave if you have any.

Reverse proxy also monitors the database state, queries and variables to understand the topology changes and produce an accurate routing decision to the backend servers. Indirectly, it centralizes the nodes monitoring and cluster overview without the need to check on each and every single Galera node regularly. The following screenshot shows the ProxySQL monitoring dashboard in ClusterControl:

There are also many other benefits that a load balancer can bring to improve Galera Cluster significantly, as covered in details in this blog post, Become a ClusterControl DBA: Making your DB components HA via Load Balancers.

Final Thoughts

With good understanding on how Galera Cluster internally works, we can work around some of the limitations and improve the database service. Happy clustering!

PostgreSQL Tuning: Key Things to Drive Performance

$
0
0

PostgreSQL and Performance

Performance is one of the key requirements in software architecture design, and has been the focus of PostgreSQL developers since its beginnings, also shown in the following PostgreSQL Git sources commit:

commit d31084e9d1118b25fd16580d9d8c2924b5740dff
Author: Marc G. Fournier <scrappy@hub.org>
Date:   Tue Jul 9 06:22:35 1996 +0000

   Postgres95 1.01 Distribution - Virgin Sources

[...]

diff --git a/src/backend/access/heap/stats.c b/src/backend/access/heap/stats.c
new file mode 100644
index 0000000000..d41d01ac1b
--- /dev/null
+++ b/src/backend/access/heap/stats.c
@@ -0,0 +1,329 @@
+/*-------------------------------------------------------------------------
+ *
+ * stats.c--
+ *    heap access method debugging statistic collection routines
+ *
+ * Copyright (c) 1994, Regents of the University of California

[...]

+ * Also note that this routine probably shouldn't have to exist, and does
+ * screw up the call graph rather badly, but we are wasting so much time and
+ * system resources being massively general that we are losing badly in our
+ * performance benchmarks.
+ */

PostgreSQL achieves performance by implementing various features:

  • Several index types
  • Query planner and optimizer that can take advantage of multiprocessors systems
  • MVCC
  • Table partitioning

Environment Selection

With the many options available today come as many questions:

Again, the PostgreSQL wiki is a very good starting point for all things performance.

What Are the Key Things to Look For?

Since there is plenty of literature out there touching various aspects of PostgreSQL performance tuning and system design (hint: search the page for xfs), this blog isn’t meant to be a deep dive into any of those already discussed topics, but rather a sysadmin’s perspective on where to start when the main focus is avoiding resource contention. I will also point out many references that address specific issues in more detail. Expert advice in all areas critical to PostgreSQL performance is available through the many companies offering Professional Services.

Let’s start!

Information Gathering

Assuming a default installation, and knowing that PostgreSQL doesn’t try to be well tuned out of the box and there may even be some quirks, this step involves setting up the necessary monitoring tools.

Good monitoring is critical in understanding application and be able to quickly track down the affected resources, and this is particularly true for cloud providers where access to the database host may not be available in order to run benchmarks for CPU or I/O:

Reacting to system performance alerts

Monitoring tools will graph and alert on system performance indicators:

CPU:

  • Alert — High usage indicates a long running query.

I/O:

Memory:

  • Alert — High memory usage.

Network:

  • Alert — High Latency. Usually this is a DBaaS issue.
    • Impact — Clients, replication.
    • Action — Relocate database hosts closer to frontend servers.
  • Alert — High number of connections.

Database internal performance indicators

The pg_* views are the window to database engine performance, and PostgreSQL management applications have been written to aid in correlating the wealth of information otherwise available through various SQL queries. Additional extensions exist and they are often integrated or available as plugins.

Using such tools simplifies the DBA task and ensures that best practices are followed when setting up and configuring the database cluster.

Database Statistics

Monitoring tools such as ClusterControl use database activity statistics to aid the DBA with performance tuning:

Download the Whitepaper Today
 
PostgreSQL Management & Automation with ClusterControl
Learn about what you need to know to deploy, monitor, manage and scale PostgreSQL

Query Tuning

Starting with version 9.5 PostgreSQL includes considerable query performance improvements such as BRIN indexes and parallel queries:

Locking

Concurrency Control is dedicated a whole chapter in PostgreSQL documentation. Use monitoring tools to be alerted when the number of locks or lock duration exceed the threshold and resolve the issue by looking for missing indexes, reviewing the application code, or by switching to connection polling.

Bulk Load

synchronous_commit can be turned off during large data imports. More options are discussed in the PostgreSQL documentation section Populating a Database.

Conclusion

PostgreSQL performance tuning is a complex task. The complexity comes from the many tunables made available, which is a strong argument in favor of PostgreSQL. There is no silver bullet to solving performance issues, rather it is the application specifics that ultimately dictate the tuning requirements. Therefore monitoring tools can assist in gaining performance insights relative to the system performance and further allow to identify the PostgreSQL specific areas that need tuning as well as the SQL queries that require optimization. Additionally database management systems can assist with the setup and administration of PostgreSQL in order to ensure that best practices are followed.

New Whitepaper: Disaster Recovery Planning for MySQL & MariaDB

$
0
0

We’re happy to announce that our new whitepaper Disaster Recovery Planning for MySQL & MariaDB is now available to download for free!

Database outages are almost inevitable and understanding the timeline of an outage can help us better prepare, diagnose and recover from one. To mitigate the impact of downtime, organizations need an appropriate disaster recovery (DR) plan. However, it makes no business sense to abstract the cost of a DR solution from the design of it, so organizations have to implement the right level of protection at the lowest possible cost.

This white paper provides essential insights into how to build such a plan, discussing the database mechanisms involved as well as how these mechanisms can be fully automated with ClusterControl, a management platform for open source database systems.

Topics included in this whitepaper are…

  • Business Considerations for Disaster Recovery
    • Is 100% Uptime Possible?
    • Analysing Risk
    • Assessing Business Impact
  • Defining Disaster Recovery
    • Recovery Time Objectives
    • Recovery Point Objectives
  • Disaster Recovery Tiers
    • Offsite Data
    • Backups and Hot Sites

Download the whitepaper today!

ClusterControl
Single Console for Your Entire Database Infrastructure
Find out what else is new in ClusterControl

About the Author

Vinay Joosery, CEO & Co-Founder, Severalnines

Vinay Joosery, CEO, Severalnines, is a passionate advocate and builder of concepts and business around distributed database systems. Prior to co-founding Severalnines, Vinay held the post of Vice-President EMEA at Pentaho Corporation - the Open Source BI leader. He has also held senior management roles at MySQL / Sun Microsystems / Oracle, where he headed the Global MySQL Telecoms Unit, and built the business around MySQL's High Availability and Clustering product lines. Prior to that, Vinay served as Director of Sales & Marketing at Ericsson Alzato, an Ericsson-owned venture focused on large scale real-time databases.

About ClusterControl

ClusterControl is the all-inclusive open source database management system for users with mixed environments that removes the need for multiple management tools. ClusterControl provides advanced deployment, management, monitoring, and scaling functionality to get your MySQL, MongoDB, and PostgreSQL databases up-and-running using proven methodologies that you can depend on to work. At the core of ClusterControl is it’s automation functionality that lets you automate many of the database tasks you have to perform regularly like deploying new databases, adding and scaling new nodes, running backups and upgrades, and more.

To learn more about ClusterControl click here.

Disaster Recovery Planning for MySQL & MariaDB with ClusterControl

$
0
0

Join us on July 24th for this webinar on disaster recovery planning for MySQL and MariaDB, which builds on our recent white paper of the same title.

Organizations need an appropriate disaster recovery plan in order to mitigate the impact of downtime. But how much should a business invest? Designing a highly available system comes at a cost, and not all businesses and certainly not all applications need five 9’s availability.

Therefore, disaster recovery can and should be implemented at different levels. These can be anything from periodic full backups that are archived offsite, to multi-datacenter setups with synchronous data replication. What is right for the business will vary by mission-criticalness.

So if you find yourself wondering about disaster recovery planning for MySQL and MariaDB, if you’re unsure about RTO and RPO or whether you should you have a secondary datacenter, or concerned about disaster recovery in the cloud …

Then this webinar is for you!

Join Vinay Joosery, CEO at Severalnines, as he explains key disaster recovery concepts and walks us through the relevant options from the MySQL & MariaDB ecosystem in order to meet different tiers of disaster recovery requirements; and learn how ClusterControl can help fully automate an appropriate disaster recovery plan.

This webinar builds upon a related white paper written by Vinay on disaster recovery, which you can download here: https://severalnines.com/resources/whitepapers/disaster-recovery-planning-mysql-mariadb.

Image: 
Agenda: 
  • Business Considerations for DR
    • Is 100% uptime possible?
    • Analyzing risk
    • Assessing business impact
  • Defining DR
    • Outage Timeline
    • RTO
    • RPO
    • RTO + RPO = 0 ?
  • DR Tiers
    • No offsite data
    • Database backup with no Hot Site
    • Database backup with Hot Site
    • Asynchronous replication to Hot Site
    • Synchronous replication to Hot Site
  • Implementing DR with ClusterControl
    • Demo
  • Q&A
Date & Time v2: 
Tuesday, July 24, 2018 - 10:00 to 11:15
Tuesday, July 24, 2018 - 12:00 to 13:15

A Performance Cheat Sheet for MongoDB

$
0
0

Database performance affects organizational performance, and we tend to want to look for a quick fix. There are many different avenues to improve performance in MongoDB. In this blog, we will help you to understand better your database workload, and things that may cause harm to it. Knowledge of how to use limited resources is essential for anybody managing a production database.

We will show you how to identify the factors that limit database performance. To ensure that database performs as expected, we will start from the free MongoDB Cloud monitoring tool. Then we will check how to manage log files and how to examine queries. To be able to achieve optimal usage of hardware resources, we will take a look into kernel optimization and other crucial OS settings. Finally, we will look into MongoDB replication and how to examine performance.

Free Monitoring of performance

MongoDB introduced a free performance monitoring tool in the cloud for standalone instances and replica sets. When enabled, the monitored data is uploaded periodically to the vendor’s cloud service. That does not require any additional agents, the functionality is built into the new MongoDB 4.0+. The process is fairly simple to setup and manage. After the single command activation, you will get a unique Web address to access your recent performance stats. You can only access monitored data that has been uploaded within the past 24 hours.

Here is how to activate this feature. You can enable/disable free monitoring during runtime using:

-- Enable Free Monitoring
db.enableFreeMonitoring()
-- Disable Free Monitoring
db.disableFreeMonitoring()

You can also enable or disable free monitoring during mongod startup using either the configuration file setting cloud.monitoring.free.state or the command-line option --enableFreeMonitoring

db.enableFreeMonitoring()

After the activation, you will see a message with the actual status.

{
    "state" : "enabled",
    "message" : "To see your monitoring data, navigate to the unique URL below. Anyone you share the URL with will also be able to view this page. You can disable monitoring at any time by running db.disableFreeMonitoring().",
    "url" : "https://cloud.mongodb.com/freemonitoring/cluster/XEARVO6RB2OTXEAHKHLKJ5V6KV3FAM6B",
    "userReminder" : "",
    "ok" : 1
}

Simply copy/paste the URL from the status output to the browser, and you can start checking performance metrics.

MongoDB Free monitoring provides information about the following metrics:

  • Operation Execution Times (READ, WRITES, COMMANDS)
  • Disk utilization (MAX UTIL % OF ANY DRIVE, AVERAGE UTIL % OF ALL DRIVES)
  • Memory (RESIDENT, VIRTUAL, MAPPED)
  • Network - Input / Output (BYTES IN, BYTES OUT)
  • Network - Num Requests (NUM REQUESTS)
  • Opcounters (INSERT, QUERY, UPDATE, DELETE, GETMORE, COMMAND)
  • Opcounters - Replication (INSERT, QUERY, UPDATE, DELETE, GETMORE, COMMAND)
  • Query Targeting (SCANNED / RETURNED, SCANNED OBJECTS / RETURNED)
  • Queues (READERS, WRITERS, TOTAL)
  • System Cpu Usage (USER, NICE, KERNEL, IOWAIT, IRQ, SOFT IRQ, STEAL, GUEST)
MongoDB Free Monitoring first use
MongoDB Free Monitoring System CPU Usage
MongoDB Free Monitoring Charts

To view the state of your free monitoring service, use following method:

db.getFreeMonitoringStatus()

The serverStatus and the helper db.serverStatus() also includes free monitoring statistics in the free Monitoring field.

When running with access control, the user must have the following privileges to enable free monitoring and get status:

{ resource: { cluster : true }, actions: [ "setFreeMonitoring", "checkFreeMonitoringStatus" ] }

This tool may be a good start for those who find it difficult to read MongoDB server status output from the commandline:

db.serverStatus()

Free Monitoring is a good start but it has very limited options, if you need a more advanced tool you may want to check MongoDB Ops Manager or ClusterControl.

Logging database operations

MongoDB drivers and client applications can send information to the server log file. Such information depends on the type of the event. To check current settings, login as admin and execute:

db.getLogComponents()

Log messages include many components. This is to provide a functional categorization of the messages. For each of the component, you can set different log verbosity. The current list of components is:

ACCESS, COMMAND, CONTROL, FTD, GEO, INDEX, NETWORK, QUERY, REPL_HB, REPL, ROLLBACK, REPL, SHARDING, STORAGE, RECOVERY, JOURNAL, STORAGE, WRITE.

For more details about each of the components, check the documentation.

Capturing queries - Database Profiler

MongoDB Database Profiler collects information about operations that run against a mongod instance. By default, the profiler does not collect any data. You can choose to collect all operations (value 2), or those that take longer than the value of slowms. The latter is an instance parameter which can be controled through the mongodb configuration file. To check the current level:

db.getProfilingLevel()

To capture all queries set:

db.setProfilingLevel(2)

In the configuration file, you can set:

profile = <0/1/2>
slowms = <value>

This setting will be applied on a single instance and not propagate across a replica set or shared cluster, so you need to repeat this command of all of the nodes if you want to capture all activities. Database profiling can impact database performance. Enable this option only after careful consideration.

Then to list the 10 most recent:

db.system.profile.find().limit(10).sort(
{ ts : -1 }
).pretty()

To list all:

db.system.profile.find( { op:
{ $ne : 'command' }
} ).pretty()

And to list for a specific collection:

db.system.profile.find(
{ ns : 'mydb.test' }
).pretty()

MongoDB logging

MongoDB log location is defined in your configuration’s logpath setting, and it’s usually /var/log/mongodb/mongod.log. You can find MongoDB configuration file at /etc/mongod.conf.

Here is sample data:

2018-07-01T23:09:27.101+0000 I ASIO     [NetworkInterfaceASIO-Replication-0] Connecting to node1:27017
2018-07-01T23:09:27.102+0000 I ASIO     [NetworkInterfaceASIO-Replication-0] Failed to connect to node1:27017 - HostUnreachable: Connection refused
2018-07-01T23:09:27.102+0000 I ASIO     [NetworkInterfaceASIO-Replication-0] Dropping all pooled connections to node1:27017 due to failed operation on a connection
2018-07-01T23:09:27.102+0000 I REPL_HB  [replexec-2] Error in heartbeat (requestId: 21589) to node1:27017, response status: HostUnreachable: Connection refused
2018-07-01T23:09:27.102+0000 I ASIO     [NetworkInterfaceASIO-Replication-0] Connecting to node1:27017

You can modify log verbosity of the component by setting (query example):

db.setLogLevel(2, "query")

The log file can be significant, so you may want to clear it before profiling. From the MongoDB commandline console, enter:

db.runCommand({ logRotate : 1 });

Checking operating system parameters

Memory limits

To see the limits associated with your login, use the command ulimit -a. The following thresholds and settings are particularly important for mongod and mongos deployments:

-f (file size): unlimited
-t (cpu time): unlimited
-v (virtual memory): unlimited
-n (open files): 64000
-m (memory size): unlimited [1]
-u (processes/threads): 32000

The newer version of the mongod startup script (/etc/init.d/mongod) has the default settings built into the start option:

start()
{
  # Make sure the default pidfile directory exists
  if [ ! -d $PIDDIR ]; then
    install -d -m 0755 -o $MONGO_USER -g $MONGO_GROUP $PIDDIR
  fi

  # Make sure the pidfile does not exist
  if [ -f "$PIDFILEPATH" ]; then
      echo "Error starting mongod. $PIDFILEPATH exists."
      RETVAL=1
      return
  fi

  # Recommended ulimit values for mongod or mongos
  # See http://docs.mongodb.org/manual/reference/ulimit/#recommended-settings
  #
  ulimit -f unlimited
  ulimit -t unlimited
  ulimit -v unlimited
  ulimit -n 64000
  ulimit -m unlimited
  ulimit -u 64000
  ulimit -l unlimited

  echo -n $"Starting mongod: "
  daemon --user "$MONGO_USER" --check $mongod "$NUMACTL $mongod $OPTIONS >/dev/null 2>&1"
  RETVAL=$?
  echo
  [ $RETVAL -eq 0 ] && touch /var/lock/subsys/mongod
}

The role of the memory management subsystem also called the virtual memory manager is to manage the allocation of physical memory (RAM) for the entire kernel and user programs. This is controled by the vm.* parameters. There are two which you should consider in first place in order to tune MongoDB performance - vm.dirty_ratio and vm.dirty_background_ratio.

vm.dirty_ratio is the absolute maximum amount of system memory that can be filled with dirty pages before everything must get committed to disk. When the system gets to this point, all new I/O blocks until dirty pages have been written to disk. This is often the source of long I/O pauses. The default is 30, which is usually too high. vm.dirty_background_ratio is the percentage of system memory that can be filled with “dirty” pages — memory pages that still need to be written to disk. The good start is to go from 10 and measure performance. For a low memory environment, 20 is a good start. A recommended setting for dirty ratios on large-memory database servers is vm.dirty_ratio = 15 and vm.dirty_background_ratio = 5 or possibly less.

To check dirty ratio run:

sysctl -a | grep dirty

You can set this by adding the following lines to “/etc/sysctl.conf”:

Swappiness

On servers where MongoDB is the only service running, it’s a good practice to set vm.swapiness = 1. The default setting is set to 60 which is not appropriate for a database system.

vi /etc/sysctl.conf
vm.swappiness = 1

Transparent huge pages

If you are running your MongoDB on RedHat, make sure that Transparent Huge Pages is disabled.
This can be checked by commnad:

cat /proc/sys/vm/nr_hugepages 
0

0 means that transparent huge pages are disabled.

Filesystem options

ext4 rw,seclabel,noatime,data=ordered 0 0

NUMA (Non-Uniform Memory Access)

MongoDB does not support NUMA, disable it in BIOS.

Network stack

net.core.somaxconn = 4096
net.ipv4.tcp_fin_timeout = 30
net.ipv4.tcp_keepalive_intvl = 30
net.ipv4.tcp_keepalive_time = 120
net.ipv4.tcp_max_syn_backlog = 4096

NTP deamon

To install NTP time server demon, use one of the following system commands.

#Red Hat
sudo yum install ntp
#Debian
sudo apt-get install ntp

You can find more details about OS performance for MongoDB in another blog.

Explain plan

Similar to other popular database systems, MongoDB provides an explain facility which reveals how a database operation was executed. The explain results display the query plans as a tree of stages. Each stage passes its events (i.e. documents or index keys) to the parent node. The leaf nodes access the collection or the indices.You can add explain('executionStats') to a query.

db.inventory.find( {
     status: "A",
     $or: [ { qty: { $lt: 30 } }, { item: /^p/ } ]
} ).explain('executionStats');
or append it to the collection:
db.inventory.explain('executionStats').find( {
     status: "A",
     $or: [ { qty: { $lt: 30 } }, { item: /^p/ } ]
} );

The keys whose values you should watch out for in the output of the above command execution:

  • totalKeysExamined: The total number of index entries scanned to return query.
  • totalDocsExamined: The total number of documents scanned to find the results.
  • executionTimeMillis: Total time in milliseconds required for query plan selection and query execution.

Measuring replication lag performance

Replication lag is a delay between an operation on the primary and the application of that operation from the oplog to the secondary. In other words, it defines how far the secondary is behind the primary node, which in the best case scenario, should be as close as possible to 0.

Replication process can be affected for multiple reasons. One of the main issues could be the secondary members are running out of server capacity. Large write operations on the primary member leading to secondary members being unable to replay the oplogs, or Index building on the primary member.

To check the current replication lag, run in a MongoDB shell:

db.getReplicationInfo()
db.getReplicationInfo() 
{
    "logSizeMB" : 2157.1845703125,
    "usedMB" : 0.05,
    "timeDiff" : 4787,
    "timeDiffHours" : 1.33,
    "tFirst" : "Sun Jul 01 2018 21:40:32 GMT+0000 (UTC)",
    "tLast" : "Sun Jul 01 2018 23:00:19 GMT+0000 (UTC)",
    "now" : "Sun Jul 01 2018 23:00:26 GMT+0000 (UTC)"

Replication status output can be used to assess the current state of replication, and determine if there is any unintended replication delay.

rs.printSlaveReplicationInfo()

It shows the time delay between the secondary members with respect to the primary.

rs.status()

It shows the in-depth details for replication. We can gather enough information about replication by using these commands. Hopefully, these tips give a quick overview of how to review MongoDB performance. Let us know if we’ve missed anything.

Viewing all 1265 articles
Browse latest View live


Latest Images

<script src="https://jsc.adskeeper.com/r/s/rssing.com.1596347.js" async> </script>