Quantcast
Channel: Severalnines
Viewing all 1257 articles
Browse latest View live

An Introduction to TimescaleDB

$
0
0

TimescaleDB is an open-source database invented to make SQL scalable for time-series data. It’s a relatively new database system. TimescaleDB has been introduced to the market two years ago and reached version 1.0 in September 2018. Nevertheless, it’s engineered on top of a mature RDBMS system.

TimescaleDB is packaged as a PostgreSQL extension. All code is licensed under the Apache-2 open-source license, with the exception of some source code related to the time-series enterprise features licensed under the Timescale License (TSL).

As a time-series database, it provides automatic partitioning across date and key values. TimescaleDB native SQL support makes it a good option for those who plan to store time-series data and already have solid SQL language knowledge.

If you’re looking for a time-series database that can use rich SQL, HA, a solid backup solution, replication, and other enterprise features, this blog may put you on the right path.

When to use TimescaleDB

Before we start with TimescaleDB features, let's see where it can fit. TimescaleDB was designed to offer the best of both relational and NoSQL, with the focus of time-series. But what is time series data?

Time series data is at the core of the Internet of Things, monitoring systems and many other solutions focused on frequent changing data. As the name “time-series” suggests, we are talking about data that change with time. The possibilities for such type of DBMS are endless. You can use it in various industrial IoT use cases across manufacturing, mining, oil & gas, retail, healthcare, dev ops monitoring or financial information sector. It can also greatly fit in machine learning pipelines or as a source for business operations and intelligence.

There is no doubt that the demand for IoT and similar solutions will grow. With that said, we may also expect the need to analyze and process data in many different ways. Time-series data typically is only appended - it is quite unlikely that you will be updating old data. You typically do not delete particular rows, on the other hand, you may want some sort of the aggregation of the data over time. We do not only want to store how our data changes with time, but also analyze and learn from it.

The problem with new types of database systems is that they usually use their own query language. It takes time for users to learn a new language. The biggest difference between TimescaleDB and other popular time series databases is the support for SQL. TimescaleDB supports the full range of SQL functionality including time-based aggregates, joins, subqueries, window functions, and secondary indexes. Moreover, if your application is already using PostgreSQL, there are no changes needed to the client code.

Architecture basics

TimescaleDB is implemented as an extension on PostgreSQL, which means that a time-scale database runs within an overall PostgreSQL instance. The extension model allows the database to take advantage of many of the attributes of PostgreSQL such as reliability, security, and connectivity to a wide range of third-party tools. At the same time, TimescaleDB leverages the high degree of customization available to extensions by adding hooks deep into PostgreSQL's query planner, data model, and execution engine.

TimescaleDB architecture

Hypertables

From a user perspective, TimescaleDB data looks like singular tables, called hypertables. Hypertables are a concept or an implicit view of many individual tables holding the data called chunks. The hyper table's data can be either one or two dimensions. It can be aggregated by a time interval, and by an (optional) "partition key" value.

Practically all user interactions with TimescaleDB are with hypertables. Creating tables, indexes, altering tables, selecting data, inserting data ... should be all be executed on the hypertable.

TimescaleDB performs this extensive partitioning both on single-node deployments as well as clustered deployments (in development). While partitioning is traditionally only used for scaling out across multiple machines, it also allows us to scale up to high write rates (and improved parallelized queries) even on single machines.

Relational data support

As a relational database, it has full support for SQL. TimescaleDB supports flexible data models that can be optimized for different use cases. This makes Timescale somewhat different from most other time-series databases. The DBMS is optimized for fast ingest and complex queries, based on PostgreSQL and when needed we have access to robust time-series processing.

Installation

TimescaleDB similarly to PostgreSQL supports many different ways of installation, including installation on Ubuntu, Debian, RHEL/Centos, Windows or cloud platforms.

One of the most convenient ways to play with TimescaleDB is a docker image.

Below command will pull a Docker image from Docker Hub if it has not been already installed and then run it.

docker run -d --name timescaledb -p 5432:5432 -e POSTGRES_PASSWORD=severalnines timescale/timescaledb

First use

Since our instance is up and running, it’s time to create our first timescaledb database. As you can see below, we connect through standard PostgreSQL console so If you have PostgreSQL client tools (e.g., psql) installed locally, you can use those to access the TimescaleDB docker instance.

psql -U postgres -h localhost
CREATE DATABASE severalnines;
\c severalnines
CREATE EXTENSION IF NOT EXISTS timescaledb CASCADE;

Day to day operations

From the perspective of both use and management, TimescaleDB just looks and feels like PostgreSQL, and can be managed and queried as such.

The main bullet points for day to day operations are:

  • Coexists with other TimescaleDBs and PostgreSQL databases on a PostgreSQL server.
  • Uses SQL as its interface language.
  • Uses common PostgreSQL connectors to third-party tools for backups, console etc.

TimescaleDB settings

PostgreSQL's out-of-the-box settings are typically too conservative for modern servers and TimescaleDB. You should make sure your postgresql.conf settings are tuned, either by using timescaledb-tune or doing it manually.

$ timescaledb-tune

The script will ask you to confirm changes. These changes are then written to your postgresql.conf and will take effect on the restart.

Now, let’s take a look at some basic operations from the TimescaleDB tutorial which can give you an idea of how to work with the new database system.

To create a hypertable, you start with a regular SQL table and then convert it into a hypertable via the function create_hypertable.

-- Create extension timescaledb
CREATE EXTENSION timescaledb;
Create a regular table
CREATE TABLE conditions (
  time        TIMESTAMPTZ       NOT NULL,
  location    TEXT              NOT NULL,
  temperature DOUBLE PRECISION  NULL,
  humidity    DOUBLE PRECISION  NULL
);

Convert it to hypertable is simple as:

SELECT create_hypertable('conditions', 'time');

Inserting data into the hypertable is done via normal SQL commands:

INSERT INTO conditions(time, location, temperature, humidity)
  VALUES (NOW(), 'office', 70.0, 50.0);

Selecting data, is old good SQL.

SELECT * FROM conditions ORDER BY time DESC LIMIT 10;

As we can see below we can do a group by, order by, and functions. In addition, TimescaleDB includes functions for time-series analysis that are not present in vanilla PostgreSQL.

SELECT time_bucket('15 minutes', time) AS fifteen_min,
    location, COUNT(*),
    MAX(temperature) AS max_temp,
    MAX(humidity) AS max_hum
  FROM conditions
  WHERE time > NOW() - interval '3 hours'
  GROUP BY fifteen_min, location
  ORDER BY fifteen_min DESC, max_temp DESC;

An Introduction to Couchbase

$
0
0

Relational database systems are falling short in recent years generally due to exponential rise of web applications and drastic growth of the internet. The new generation of enterprise requirements justified the need to establish database systems which are more dynamic, hence the Non-relational DBMS. With the fixed data model of relational databases, it is quite difficult to make major adjustments that could lead to a fast performing database. To be seccant, mobile and modern web applications evolve more rapidly than legacy applications such as enterprise planning applications, hence need to consider speed and agility.

Due to future change expectations in data structure for a given application, it is also advisable to perform the changes in data models within a database in an easy and secure manner. With relational databases, this is very expensive basically because it involves a fixed data model. On the other hand, Non-relational databases offer some flexibility to changes in the data models and schema design and therefore accommodate the rising changes to application needs.

The major reasons to use a Non-Relational DBM include:

  • More users are joining the platform hence need to scale out to support thousands of them and maintain high availability of data so as to improve on data integrity
  • Expectations for data changes and differences. Users have different interests hence your platform need to support different data structures and continuous streams of real-time data.
  • Data is getting bigger. With time you will have to store a lot of customer data and data from different sources.
  • Cloud computing. As the number of customers rises you need to come up with techniques such as scaling on demand, replicating data but at the same time minimize on resources cost.

Couchbase Architecture

Couchbase database is a NoSQL DBMS that has come to rise due to its high performing power as well as integrating the most essential features of a Non-relational database. It achieves this through 2 major technologies that are:

  1. CouchDB a concept that supports storage of data in JSON format hence supporting document-oriented model.
  2. Membase technique that enhances high data availability through replication and sharding thus improving on performance.

CouchDB has a highly tuned storage engine designed to handle update transactions and query processing in real-time.

Couchbase Storage Mechanism

CouchDB storage structure supports SQLite DB and CouchDB through a defined data server interface from which these storage structures can be connected. CouchDB is most preferred since it provides a very powerful storage mechanism as far as the Couchbase technology is concerned.

Unlike other storage technologies whereby an update has to be altered for a selected document, with CouchDB data are written to a file in an append-only manner. This enables sequential writes for updates besides providing an optimized access pattern for inputs and outputs.

Data management in Couchbase server is achieved through buckets which are isolated virtual containers for data. The write file mentioned above is provided by this bucket generally known as vBucket. A bucket in Couchbase can be defined as a logical grouping of physical resources within a cluster of Couchbase servers. Buckets play an important role in ensuring a secure mechanism for managing, organizing and analyzing data storage resources.

Flusher Thread

Updates in Couchbase are asynchronous hence carried out in 3 steps. The update is done by a flusher thread in batches and this is how it works:

  1. All pending write requests are picked from a dirty queue and de-duplicated multiple update requests to the same document.
  2. The requests are sorted by key into corresponding vBucket after opening the corresponding file.
  3. The following is appended to the vBucket file in the same contiguous sequence.
    • All document contents in such write request batch. I.e. [length, crc, content] in a sequential manner.
    • BTree by-id which is an index that stores the mapping from document id to the document’s position on the disk.
    • BTree by-seq which is an index that stores the mapping from sequence number to the document’s position on the disk.

The by-id index enables fast lookup of the document by its id in the file. The lookup starts from the header that is the end of the file then transferred to the root BTree node of the by-id index and then traversed to the leaf BTree node that contains a pointer to the actual document position on the disk.

The by-seq index is used to keep track of the update sequence of lived documents and is used for asynchronous catch-up purposes. Whenever a document is created, modified or deleted, a sequence number is added to the by-seq BTree while the previous seq node is deleted. With this, there is cross-site replication, view index update and compaction that enables quick location of all lived documents in the order of their updates.

When the vBucket replicator inquiries for the list of an update since a particular time, the last sequence number in the previous update is provided and a scan through the by-seq BTree node is triggered to locate all documents with larger sequence number than that.

In the illustration below, there is a greyed out data. This is termed as garbage data which often becomes unreachable within the file. A garbage collection mechanism needs to be in place for clean up. This is done by analyzing the data size of lived documents by the use of the by-id and by-seq BTree nodes. If the ratio of the actual size and vBucket file size fall below a certain threshold, a compaction process is initiated whose job is to open the vBucket file and copy data that had not been cleaned up to another file. It does so by tracing the BTree all the way to the leaf node and copy the corresponding document content to the new file and this happens every time the vBucket is being updated. At the end of the compaction process, the system copies the data that was appended since the beginning of the compaction to the new file.

The flusher process is as illustrated below.

Couchbase Buckets

Buckets are logical groupings of physical resources within a Couchbase Servers cluster that provide a secure mechanism for organizing, managing and analyzing the data storage resources. There are 2 types of data buckets in Couchbase DB so far that is, Memcached and Couchbase. They enable store data in-memory or both in memory and on disk.

When setting up a Couchbase Server, consider these tips when selecting a bucket for your data:

Memcached bucket: These are often designed to be used alongside relational database technology. Frequently used data is cached to reduce the number of queries the database server must perform hence reducing the latency of a request.

Couchbase bucket: This is a more dynamic and highly-available distributed data storage with persistence and replication services. They operate through RAM that is, data is kept in RAM and persisted down to disk. These data is cached within the RAM until the configured RAM is exhausted and data is ejected from RAM. Otherwise, if the data currently requested is absent in RAM, it is automatically loaded from disk.

Severalnines
 
DevOps Guide to Database Management
Learn about what you need to know to automate and manage your open source databases

Major Merits of Couchbase Database

  1. Easy replication and improved high availability: A large number of replica servers can be configured to receive copies of all data objects in the Couchbase-type bucket. Failure of the host machine triggers a promotion of one of the replica servers to be host server hence providing high availability cluster operations via failover.
  2. Caching. Data is kept in the RAM for quick access until the RAM size is exhausted then it is ejected. This generally reduces the latency of a query request.
  3. Persistence of data. Data objects are persisted asynchronously to hard-disk resources from memory to provide protection from server restarts or minor failures.
  4. Rebalancing: according to resources provision, rebalancing enables load distribution through adding or removing buckets and servers in the cluster.
  5. Fully featured SQL for JSON database. With the Memcached bucket, one can easily manipulate data with SQL queries.
  6. Flexible schema to accommodate changes in data structures and ensure continuous delivery.
  7. No hassle to scale out and consistent performance at any scale.
  8. Global deployment at low write latency and full stack security. Working with distributed databases at some point is very hectic. Couchbase provides a single platform of maintenance that is easy in terms of storage, access, transport and enterprise-grade security on premises and across multiple clouds.

Conclusion

User experience has led to technological changes around database management system. Many technologies have been innovated to ascertain comfortability in the usage of mobile and web application in terms of serving speeding. It is thus important to employ a database system that is quite flexible to any future changes in terms of data structure and scaling. Couchbase database comes with these merits more especially with its flexible schema and little maintenance hassles. Besides, it has a capability to support fully feature SQL for JSON database. It also guarantees consistent performance thus creating a seamless user experience.

Tags: 

How to Deploy Open Source Databases

$
0
0

Introduction

Choosing which DB engine to use between all the options we have today is not an easy task. An that is just the beginning. After deciding which engine to use, you need to learn about it and actually deploy it to play with it. We plan to help you on that second step, and show you how to install, configure and secure some of the most popular open source DB engines. In this whitepaper we are going to cover these points, with the aim of fast tracking you on the deploy task.

How to Deploy Open Source Databases - New Whitepaper

$
0
0

We’re happy to announce that our new whitepaper How to Deploy Open Source Databases is now available to download for free!

Choosing which DB engine to use between all the options we have today is not an easy task. An that is just the beginning. After deciding which engine to use, you need to learn about it and actually deploy it to play with it. We plan to help you on that second step, and show you how to install, configure and secure some of the most popular open source DB engines.

In this whitepaper we are going to explore the top open source databases and how to deploy each technology using proven methodologies that are battle-tested.

Topics included in this whitepaper are …

  • An Overview of Popular Open Source Databases
    • Percona
    • MariaDB
    • Oracle MySQL
    • MongoDB
    • PostgreSQL
  • How to Deploy Open Source Databases
    • Percona Server for MySQL
    • Oracle MySQL Community Server
      • Group Replication
    • MariaDB
      • MariaDB Cluster Configuration
    • Percona XtraDB Cluster
    • NDB Cluster
    • MongoDB
    • Percona Server for MongoDB
    • PostgreSQL
  • How to Deploy Open Source Databases by Using ClusterControl
    • Deploy
    • Scaling
    • Load Balancing
    • Management   

Download the whitepaper today!

ClusterControl
Single Console for Your Entire Database Infrastructure
Find out what else is new in ClusterControl

About ClusterControl

ClusterControl is the all-inclusive open source database management system for users with mixed environments that removes the need for multiple management tools. ClusterControl provides advanced deployment, management, monitoring, and scaling functionality to get your MySQL, MongoDB, and PostgreSQL databases up-and-running using proven methodologies that you can depend on to work. At the core of ClusterControl is it’s automation functionality that lets you automate many of the database tasks you have to perform regularly like deploying new databases, adding and scaling new nodes, running backups and upgrades, and more.

To learn more about ClusterControl click here.

About Severalnines

Severalnines provides automation and management software for database clusters. We help companies deploy their databases in any environment, and manage all operational aspects to achieve high-scale availability.

Severalnines' products are used by developers and administrators of all skill levels to provide the full 'deploy, manage, monitor, scale' database cycle, thus freeing them from the complexity and learning curves that are typically associated with highly available database clusters. Severalnines is often called the “anti-startup” as it is entirely self-funded by its founders. The company has enabled over 32,000 deployments to date via its popular product ClusterControl. Currently counting BT, Orange, Cisco, CNRS, Technicolor, AVG, Ping Identity and Paytrail as customers. Severalnines is a private company headquartered in Stockholm, Sweden with offices in Singapore, Japan and the United States. To see who is using Severalnines today visit, https://www.severalnines.com/company.

Announcing ClusterControl 1.7.2: Improved PostgreSQL Backup & Support for TimescaleDB & MySQL 8.0

$
0
0

We are excited to announce the 1.7.2 release of ClusterControl - the only database management system you’ll ever need to take control of your open source database infrastructure.

ClusterControl 1.7.2 marks the first time for supporting time-series data with TimescaleDB; strengthening our mission to provide complete life-cycle support for the best open source databases and expanding our ability to support applications like IoT, Fintech and smart technology.

We continue to improve our support of PostgreSQL by adding new monitoring capabilities to forecast database growth as well as the integration of a top backup technology, pgBackRest, that gives you new ways to manage your PostgreSQL backups.

Release Highlights

New Database Technology Support

  • Support for TimescaleDB 1.2.2 (New Time-Series Database)
  • Support for Oracle MySQL Server 8.0.15
  • Support for Percona Server for MySQL 8.0
  • Improved support for MaxScale 2.2 (Load Balancing)

Improved Monitoring & Backup Management for PostgreSQL

  • New database growth graphs
  • Create or restore full, differential and incremental backups using the pgBackRest technology
  • A new way to do Point in Time Recovery
  • Enable and configure backup compression options

Launch of CC Spotlight

  • CC Spotlight allows you to quickly find and open any page in ClusterControl with a few keystrokes. It also allows you to find individual nodes to quickly perform cluster actions on them.

CMON HA (BETA)

  • CMON HA enables multiple controller servers for fault tolerance. It uses a consensus protocol (raft) to keep multiple controller processes in sync. A production setup consists of a 'leader' CMON process and a set of 'followers' which share storage and state using a MySQL Galera cluster.
ClusterControl
Single Console for Your Entire Database Infrastructure
Find out what else is new in ClusterControl

View Release Details and Resources

Release Details

New Database Technology Support

TimescaleDB: Included in the 1.7.2 release of ClusterControl, we are proud to announce an expansion of the databases we support to include TimescaleDB, a revolutionary new time-series that leverages the stability, maturity and power of PostgreSQL. Learn more about it here.

MySQL 8.0: This new and exciting 8.0 version of MySQL boasts improvements to user management, the introduction of a NoSQL storage engine, new common table expressions, Window functions, and improved spatial support.

Maxscale 2.2: MariaDB Maxscale 2.2 offers full support for MariaDB 10.2, of which support was introduced in ClusterControl 1.5 as well as a variety of other improvements. MariaDB MaxScale is a database proxy that extends the high availability, scalability, and security of MariaDB Server while at the same time simplifying application development by decoupling it from underlying database infrastructure.

Improved Monitoring & Backup Management for PostgreSQL

PostgreSQL Database Growth Graph: This new graph allows you to track the dataset growth of your PostgreSQL database, letting you stay on top performance and plan for your future needs.

Integration of pgBackRest: PgBackRest is among the top open source backup tools for PostgreSQL, mainly because its efficiency to cope with very large volumes of data and the extreme care its creators put into validation of backups via checksums. With it, ClusterControl users will be able to create & restore either full or incremental backups. It also allows for a new method to achieve point-in-time-recovery for PostgreSQL.

Launch of CC Spotlight

This new ClusterControl navigation and search tool can help you easily navigate across both the ClusterControl features as well as your specific deployments. Just click on the search icon or hit CTRL+SPACE on your keyboard to activate Spotlight.

CMON HA (BETA)

CMON HA uses a consensus protocol (raft) to provide a high availability setup with more than one cmon process. It allows you to setup a 'leader' CMON process and a set of 'followers' which share storage and state using a MySQL Galera cluster. In case of failure of the active controller, a new one is promoted to leader.

This enables ClusterControl users to build highly available deployments which would be immune to network partitioning and split brain conditions.

Advanced Database Monitoring & Management for TimescaleDB

$
0
0

Included in the 1.7.2 release of ClusterControl we are proud to announce an expansion of the databases we support to include TimescaleDB, a revolutionary new time-series that leverages the stability, maturity and power of PostgreSQL.

For ClusterControl, this marks the first time for supporting time-series data; strengthening our mission to provide complete life-cycle support for the best open source databases and expanding our ability to support applications like IoT, Fintech and smart technology.

TimescaleDB can ingest large amounts of data and then measure how it changes over time. This ability is crucial to analyzing any data-intensive, time-series data. In addition, anyone who is familiar with SQL-based databases, such as PostgreSQL, would be able to utilize the TimeScaleDB technology.

TimescaleDB Management Features

ClusterControl allows TimescaleDB users the ability to quickly and easily deploy high availability TimeScaleDB setups; point-and-click, using the ClusterControl GUI.

Out of the box monitoring and performance management features provide deep insights into production database workload and query performance.

ClusterControl automates failover and recovery in replication setups, and makes use of HAProxy to provide a single endpoint for applications, ensuring maximum uptime.

In addition, ClusterControl also provides a full-suite of backup management features for TimescaleDB including backup verification, data compression & encryption, Point-in-Time Recovery (PITR), retention management and cloud archiving.

Vinay Joosery, Severalnines CEO, had this to say about Timescale; “TimescaleDB is the first time-series database to be compatible with SQL. This allows the user to leverage the power of the technology with the stability and support of an existing open-source community. ClusterControl is a better way to run TimescaleDB because you do not need to cobble together multiple tools to run and manage the database.”

ClusterControl
Single Console for Your Entire Database Infrastructure
Find out what else is new in ClusterControl

Applications for Timescale and ClusterControl

TimescaleDB is perfectly suited to applications who need to track a large amount of incoming data and examine how that data changes over time.

  • Internet of Things (IoT) - While the array of products that fall in the IoT category are vast, TimescaleDB enables many scenarios to be successful. Timescale allows IoT companies to “go deep” in their analysis of the data hidden inside the usage of these devices, information that can be used to build new products and features.
  • Systems Monitoring - high-traffic applications require time-series data to be able to analyze and understand usage patterns of their users. TimescaleDB provides the ability to do this at scale, handling and making sense of large amounts of data inputs.
  • Business Analytics - Analyzing time-series data allows businesses to extract meaningful statistics and other characteristics. This data could include transaction data, trends, or pricing.
  • FinTech - Time-series financial analysis allows users to better understand the marketplace and improves their ability to generate quality forecasts. Because TimescaleDB is built for volume and speed, FinTech companies can utilize it to “cast a wide net” and process data at an even faster rate than before.

Timescale can be deployed and monitored for free using the ClusterControl Community Edition and all additional features can be tested in a 30-day trial of ClusterControl Enterprise which can be downloaded for free.

Monitoring & Ops Management of MySQL 8.0 with ClusterControl

$
0
0

Users of open source databases often have to use a mixture of tools and homegrown scripts to manage their production database environments. However, even while having own homegrown scripts in the solution, it’s hard to maintain it and keep up with new database features, security requirements or upgrades. With new major versions of a database, including MySQL 8.0, this task can become even harder.

At the heart of ClusterControl is its automation functionality that lets you automate the database tasks you have to perform regularly, like deploying new databases, adding and scaling new nodes, managing backups, high availability and failover, topology changes, upgrades, and more. Automated procedures are accurate, consistent, and repeatable so you can minimize the risk of changes on the production environments.

Moreover, with ClusterControl, MySQL users are no longer subject to vendor lock-in; something that was questioned by many recently. You can deploy and import a variety of MySQL versions and vendors from a single console for free.

In this article, we will show you how to deploy MySQL 8.0 with a battle tested configuration and manage it in an automated way. You will find here how to do:

  • ClusterControl installation
  • MySQL deployment process
    • Deploy a new cluster
    • Import existing cluster
  • Scaling MySQL
  • Securing MySQL
  • Monitoring and Trending
  • Backup and Recovery
  • Node and Cluster autorecovery (auto failover)

ClusterControl installation

To start with ClusterControl you need a dedicated virtual machine or host. The VM and supported systems requirements are described here. The base VM can start from 2 GB, 2 cores and Disk space 20 GB storage space, either on-prem or in the cloud.

The installation is well described in the documentation but basically, you download an installation script which walks you through the steps. The wizard script sets up the internal database, installs necessary packages, repositories, and other necessary tweaks. For environments without internet access, you can use the offline installation process.

ClusterControl requires SSH access to the database hosts, and monitoring can be agent-based or agentless. Management is agentless.

To setup passwordless SSH to all target nodes (ClusterControl and all database hosts), run the following commands on the ClusterControl server:

$ ssh-keygen -t rsa # press enter on all prompts
$ ssh-copy-id -i ~/.ssh/id_rsa [ClusterControl IP address]
$ ssh-copy-id -i ~/.ssh/id_rsa [Database nodes IP address] # repeat this to all target database nodes

One of the most convenient ways to try out cluster control maybe the option to run it in docker container.

docker run -d --name clustercontrol \
--network db-cluster \
--ip 192.168.10.10 \
-h clustercontrol \
-p 5000:80 \
-p 5001:443 \
-v /storage/clustercontrol/cmon.d:/etc/cmon.d \
-v /storage/clustercontrol/datadir:/var/lib/mysql \
-v /storage/clustercontrol/sshkey:/root/.ssh \
-v /storage/clustercontrol/cmonlib:/var/lib/cmon \
-v /storage/clustercontrol/backups:/root/backups \
severalnines/clustercontrol

After successful deployment, you should be able to access the ClusterControl Web UI at {host's IP address}:{host's port}, for example:

HTTP: http://192.168.10.100:5000/clustercontrol
HTTPS: https://192.168.10.100:5001/clustercontrol

Deployment and Scaling

Deploy MySQL 8.0

Once we enter the ClusterControl interface, the first thing to do is to deploy a new database or import an existing one. The new version 1.7.2 introduces support for version 8.0 of Oracle Community Edition and Percona Server. At the time of writing this blog, the current versions are Oracle MySQL Server 8.0.15 and Percona Server for MySQL 8.0-15. Select the option “Deploy Database Cluster” and follow the instructions that appear.

ClusterControl: Deploy Database Cluster

When choosing MySQL, we must specify User, Key or Password and port to connect by SSH to our servers. We also need a name for our new cluster and if we want ClusterControl to install the corresponding software and configurations for us.

After setting up the SSH access information, we must enter the data to access our database. We can also specify which repository to use. Repository configuration is an important aspect for database servers and clusters. You can have three types of repositories when deploying database server/cluster using ClusterControl:

  • Use Vendor Repository
    Provision software by setting up and using the database vendor’s preferred software repository. ClusterControl will install the latest version of what is provided by the database vendor repository.
  • Do Not Setup Vendor Repositories
    Provision software by using the pre-existing software repository already set up on the nodes. The user has to set up the software repository manually on each database node and ClusterControl will use this repository for deployment. This is good if the database nodes are running without internet connection.
  • Use Mirrored Repositories (Create new repository)
    Create and mirror the current database vendor’s repository and then deploy using the local mirrored repository. This allows you to “freeze” the current versions of the software packages.

In the next step, we need to add our servers to the cluster that we are going to create. When adding our servers, we can enter IP or hostname then choose network interface. For the latter, we must have a DNS server or have added our MySQL servers to the local resolution file (/etc/hosts) of our ClusterControl, so it can resolve the corresponding name that you want to add.

On the screen we can see an example deployment with one master and two slave servers. The server list is dynamic and allows you to create sophisticated topologies which can be extended after the initial installation.

ClusterControl: Define Topology

When all is set hit the deploy button. You can monitor the status of the creation of our new replication setup from the ClusterControl activity monitor. The deployment process will also take care of installation of popular mysql tools like percona toolkit and percona-xtradb-backup.

ClusterControl: Deploy Cluster Details

Once the task is finished, we can see our cluster in the main ClusterControl screen and on the topology view. Note that we also added a load balancer (ProxySQL) in front of the database instances.

ClusterControl: Topology

As we can see in the image, once we have our cluster created, we can perform several tasks on it, directly from the topology section.

ClusterControl: Topology Management

Import a New Cluster

We also have the option to manage an existing setup by importing it into ClusterControl. Such an environment can be created by ClusterControl or other methods (puppet, chef, ansible, docker …). The process is simple and doesn't require specialized knowledge.

ClusterControl: Import Existing Cluster

First, we must enter the SSH access credentials to our servers. Then we enter the access credentials to our database, the server data directory, and the version. We add the nodes by IP or hostname, in the same way as when we deploy, and press on Import. Once the task is finished, we are ready to manage our cluster from ClusterControl. At this point we can also define the options for node or cluster auto recovery.

Scaling MySQL

With ClusterControl, adding more servers to the server is an easy step. You can do that from the GUI or CLI. For more advanced users you can use ClusterControl Developer Studio and write a resource base condition to expand your cluster automatically.

When adding a new node to the setup, you have an option to use existing backup so there is no need to overwhelm the production master node with additional work.

ClusterControl Scaling MySQL

With the built-in support for load balancers (ProxySQL, Maxscale, HAProxy), you can add and remove MySQL nodes dynamically. If you wish to know more in-depth about how best to manage MySQL replication and clustering, please read the MySQL replication for HA replication whitepaper.

Securing MySQL

MySQL comes with very little security out of the box. This has been improved with the recent version however production grade systems still require tweeks in the default my.cnf configuration.

ClusterControl removes human error and provides access to a suite of security features, to automatically protect your databases from hacks and other threats.

ClusterControl enables SSL support for MySQL connections. Enabling SSL adds another level of security for communication between the applications (including ClusterControl) and database. MySQL clients open encrypted connections to the database servers and verify the identity of those servers before transferring any sensitive information.

ClusterControl will execute all necessary steps, including creating certificates on all database nodes. Such certificates can be maintained later on in the Key Management tab.

ClusterControl: Manager SSL keys

The Percona server installations comes with additional support for an audit plugin. Continuous auditing is an imperative task for monitoring your database environment. By auditing your database, you can achieve accountability for actions taken or content accessed. Moreover, the audit may include some critical system components, such as the ones associated with financial data to support a precise set of regulations like SOX, or the EU GDPR regulation. The guided process lets you choose what should be audited and how to maintain the audit log files.

ClusterControl: Enable Audit Log for Percona Server 8.0

Monitoring

When working with database systems, you should be able to monitor them. That will enable you to identify trends, plan for upgrades or improvements or react effectively to any problems or errors that may arise.

The new ClusterControl 1.7.2 comes with updated high-resolution monitoring for MySQL 8.0. It's using Prometheus as the data store with PromQL query language. The list of dashboards includes MySQL Server General, MySQL Server Caches, MySQL InnoDB Metrics, MySQL Replication Master, MySQL Replication Slave, System Overview, and Cluster Overview Dashboards.

ClusterControl installs Prometheus agents, configures metrics and maintains access to Prometheus exporters configuration via its GUI, so you can better manage parameter configuration like collector flags for the exporters (Prometheus). We described in details what can be monitored recently in the article How to Monitor MySQL with Prometheus & ClusterControl.

ClusterControl: Dashboard

Alerting

As a database operator, we need to be informed whenever something critical occurs on our database. The three main methods in ClusterControl to get an alert includes:

  • email notifications
  • integrations
  • advisors

You can set the email notifications on a user level. Go to Settings > Email Notifications. Where you can choose between criticality and type of alert to be sent.

ClusterControl: Notification

The next method is to use Integration services. This is to pass the specific category of events to the other service like ServiceNow tickets, Slack, PagerDuty etc. so you can create an advanced notification methods and integrations within your organization.

ClusterControl: Integration

The last one is to involve sophisticated metrics analysis in Advisor section, where you can build intelligent checks and triggers.

ClusterControl: Automatic Advisors

Backup and Recovery

Now that you have your MySQL up and running, and have your monitoring in place, it is time for the next step: ensure you have a backup of your data.

ClusterControl: Create Backup

ClusterControl provides an interface for MySQL backup management with support for scheduling and creative reports. It gives you two options for backup methods.

  • Logical: mysqldump
  • Binary: xtrabackup/mariabackup
ClusterControl: Create Backup Options

A good backup strategy is a critical part of any database management system. ClusterControl offers many options for backups and recovery/restore.

ClusterControl: Backup schedule and Backup Repository

ClusterControl backup retention is configurable; you can choose to retain your backup for any time period or to never delete backups. AES256 encryption is employed to secure your backups against rogue elements. For rapid recovery, backups can be restored directly into a new cluster - ClusterControl handles the full restore process from launch of a new database setup to recovery of data, removing error-prone manual steps from the process.

Backups can be automatically verified upon completion, and then uploaded to cloud storage services (AWS, Azure and Google). Different retention policies can be defined for local backups in the datacenter as well as backups that are uploaded in the cloud.

Node and cluster autorecovery

ClusterControl provides advanced support for failure detection and handling. It also allows you to deploy different proxies to integrate them with your HA stack so there is no need to adjust application connection string or dns entry to redirect application to the new master node.

When master server is down, ClusterControl will create a job to perform automatic failover. ClusterControl does all the background work to elect a new master, deploy fail-over slave servers, and configure load balancers.

ClusterControl: Node autorecovery

ClusterControl automatic failover was designed with the following principles:

  • Make sure the master is really dead before you failover
  • Failover only once
  • Do not failover to an inconsistent slave
  • Only write to the master
  • Do not automatically recover the failed master

With the built-in algorithms, failover can often be performed pretty quickly so you can assure the highest SLA’s for your database environment.

The process is highly configurable. It comes with multiple parameters which you can use to adopt recovery to the specifics of your environment. Among the different options you can find replication_stop_on_error, replication_auto_rebuild_slave, replication_failover_blacklist, replication_failover_whitelist, replication_skip_apply_missing_txs, replication_onfail_failover_script and many others.

How to Easily Deploy TimescaleDB

$
0
0

A few days ago was the release of a new version of ClusterControl, the 1.7.2, where we can see several new features, one of the main ones is the support for TimescaleDB.

TimescaleDB is an open-source time-series database optimized for fast ingest and complex queries that supports full SQL. It’s based on PostgreSQL and it offers the best of NoSQL and Relational worlds for Time-series data. TimescaleDB supports streaming replication as the primary method of replication, which can be used in a high availability setup. However, PostgreSQL does not come with automatic failover and this is a problem in a high availability production environment. Manual failover usually implies that a human is paged and has to find a computer, log into the systems, understand what is going on, before initiating failover procedures. This translates into a long downtime period. Fortunately, there is a way to automate failovers with ClusterControl, which now supports TimescaleDB.

In this blog, we will see how to deploy a replicated TimescaleDB setup with automatic failover in just a few clicks by using ClusterControl. We’ll also see how to add a single database endpoint for applications via HAProxy. As a pre-requisite, you should install the 1.7.2 version of ClusterControl on a dedicated host or VM.

Deploy TimescaleDB

To perform a new installation of TimescaleDB from ClusterControl, simply select the option “Deploy” and follow the instructions that appear. Note that if you already have a TimescaleDB instance running, then you need to select the ‘Import Existing Server/Database’ instead.

When selecting TimescaleDB, we must specify User, Key or Password and port to connect by SSH to our TimescaleDB hosts. We also need a name for our new cluster and if we want ClusterControl to install the corresponding software and configurations for us.

Please check the ClusterControl user requirement for this task here.

After setting up the SSH access information, we must define the database user, version and datadir (optional). We can also specify which repository to use.

In the next step, we need to add our servers to the cluster we are going to create.

When adding our servers, we can enter IP or hostname.

In the last step, we can choose if our replication will be Synchronous or Asynchronous.

We can monitor the status of the creation of our new cluster from the ClusterControl activity monitor.

Once the task is finished, we can see our new TimescaleDB cluster in the main ClusterControl screen.

Once we have our cluster created, we can perform several tasks on it, like adding a load balancer (HAProxy) or a new replica.

ClusterControl
Single Console for Your Entire Database Infrastructure
Find out what else is new in ClusterControl

Scaling TimescaleDB

If we go to cluster actions and select “Add Replication Slave”, we can either create a new replica from scratch or add an existing TimescaleDB database as a replica.

Let's see how adding a new replication slave can be a really easy task.

As you can see in the image, we only need to choose our Master server, enter the IP address for our new slave server and the database port. Then, we can choose if we want ClusterControl to install the software for us and if the replication slave should be Synchronous or Asynchronous.

In this way, we can add as many replicas as we want and spread read traffic between them using a load balancer, which we can also implement with ClusterControl.

From ClusterControl, you can also perform different management tasks like Reboot Host, Rebuild Replication Slave or Promote Slave, with one click.

Conclusion

As we have seen above, you can now deploy TimescaleDB by using ClusterControl. Once deployed, ClusterControl provides a whole range of features, from monitoring, alerting, automatic failover, backup, point-in-time recovery, backup verification, to scaling of read replicas. This can help you manage TimescaleDB in a friendly and intuitive way.


Backup Management Tips for TimescaleDB

$
0
0

Information is one of the most valuable assets in a company, and it goes without saying that one should have a Disaster Recovery Plan (DRP) to prevent data loss in the event of an accident or hardware failure. A backup is the simplest form of DR. It might not always be enough to guarantee an acceptable Recovery Point Objective (RPO), but is a good first approach.

Whether it is a 24x7 highly loaded server or a low-transaction-volume environment, you will need to make backups a seamless procedure without disrupting the performance of the server in a production environment.

If we talk about TimescaleDB, there are different types of backup for this new engine for time-series data. The type of backup that we should use depends on many factors, like the environment, infrastructure, load, etc.

In this blog, we’ll see these different types of backups that are available, and how ClusterControl can help us to centralize our backup management for TimescaleDB.

Backup Types

There are different types of backups for databases. Let’s look at each of them in detail.

  • Logical: The backup is stored in a human-readable format like SQL.
  • Physical: The backup contains binary data.
  • Full/Incremental/Differential: The definition of these three types of backups is implicit in the name. The full backup is a full copy of all your data. Incremental backup only backs up the data that has changed since the previous backup and the differential backup only contains the data that has changed since the last full backup executed. The incremental and differential backups were introduced as a way to decrease the amount of time and disk space usage that it takes to perform a full backup.
  • Point In Time Recovery compatible: PITR Involves restoring the database at any given moment in the past. For being able to do this, we will need to restore a full backup, and then apply all the changes that happened after the backup until right before the failure.

ClusterControl Backup Management Feature

Let’s see how ClusterControl can help us to manage different types of backups.

Creating a Backup

For this task, go to ClusterControl -> Select TimescaleDB Cluster -> Backup -> Create Backup.

We can create a new backup or configure a scheduled one. For our example, we will create a single backup instantly.

Here we have one method for each type of backup that we mentioned earlier.

Backup TypeToolDefinition
Logicalpg_dumpallIt is a utility for writing out all TimescaleDB databases of a cluster into one script file. The script file contains SQL commands that can be used to restore the databases.
Physicalpg_basebackupIt is used to make a binary copy of the database cluster files, while making sure the system is put in and out of backup mode automatically. Backups are always taken of the entire database cluster of a running TimescaleDB database cluster. These are taken without affecting other clients to the database.
Full/Incr/DiffpgbackrestIt is a simple, reliable backup and restore solution that can seamlessly scale up to the largest databases and workloads by utilizing algorithms that are optimized for database-specific requirements. One of the most important features is the support for Full, Incremental, and Differential Backups.
PITRpg_basebackup+WALsTo create a PITR compatible backup, ClusterControl will use pg_basebackup and the WAL files, to be able to restore the database at any given moment in the past.

We must choose one method, the server from which the backup will be taken, and where we want to store the backup. We can also upload our backup to the cloud (AWS, Google or Azure) by enabling the corresponding button.

Keep in mind that if you want to create a backup compatible with PITR, we must use pg_basebackup in this step and we must take the backup from the master node.

Then we specify the use of compression, encryption and the retention of our backup.

On the backup section, we can see the progress of the backup, and information like the method, size, location, and more.

Enabling Point In Time Recovery

If we want to use the PITR feature, we must have the WAL Archiving enabled. For this we can go to ClusterControl -> Select TimescaleDB Cluster -> Node actions -> Enable WAL Archiving, or just go to ClusterControl -> Select TimescaleDB Cluster -> Backup -> Settings and enable the option “Enable Point-In-Time Recovery (WAL Archiving)” as we will see in the following image.

We must keep in mind that to enable the WAL Archiving, we must restart our database. ClusterControl can do this for us too.

In addition to the options common to all backups like the “Backup Directory” and the “Backup Retention Period”, here we can also specify the WAL Retention Period. By default is 0, which means forever.

To confirm that we have WAL Archiving enabled, we can select our Master node in ClusterControl -> Select TimescaleDB Cluster -> Nodes, and we should see the WAL Archiving Enabled message, as we can see in the following image.

Restoring a Backup

Once the backup is finished, we can restore it by using ClusterControl. For this, in our backup section (ClusterControl -> Select TimescaleDB Cluster -> Backup), we can select "Restore Backup", or directly "Restore" on the backup that we want to restore.

We have three options to restore the backup. We can restore the backup in an existing database node, restore and verify the backup on a standalone host or create a new cluster from the backup.

If we are trying to restore a PITR compatible backup, we also need to specify the time.

The data will be restored as it was at the time specified. Take into account that the UTC timezone is used and that our TimescaleDB service in the master will be restarted.

We can monitor the progress of our restore from the Activity section in our ClusterControl.

Automatic Backup Verification

A backup is not a backup if it's not restorable. Verifying backups is something that is usually neglected by many. Let’s see how ClusterControl can automate the verification of TimescaleDB backups and help avoid any surprises.

In ClusterControl, select your cluster and go to the "Backup" section, then, select “Create Backup”.

The automatic verify backup feature is available for the scheduled backups. So, let’s choose the “Schedule Backup” option.

When scheduling a backup, in addition to selecting the common options like method or storage, we also need to specify schedule/frequency.

In the next step, we can compress and encrypt our backup and specify the retention period. Here, we also have the “Verify Backup” feature.

To use this feature, we need a dedicated host (or VM) that is not part of the cluster.

ClusterControl will install the software and it’ll restore the backup in this host. After restoring, we can see the verification icon in the ClusterControl Backup section.

Conclusion

Nowadays, backups are mandatory in any environment. They help you protect your data. Incremental backups can help reduce the amount of time and storage space used for the backup process. Transaction logs are important for Point-in-Time-Recovery. ClusterControl can help automate the backup process for your TimescaleDB databases and, in case of failure, restore it with a few clicks. Also, you can minimize the RPO by using the PITR compatible backup and improve your Disaster Recovery Plan.

Performance Monitoring for TimescaleDB

$
0
0

ClusterControl is an easy-to-use tool for monitoring performance of TimescaleDB in real-time. It provides dozens of predefined charts for displaying a wide variety of performance statistics regarding users, throughput, tablespaces, redo logs, buffers, caches and I/O, for example. It also provides real time information on database workload. My colleague Sebastian previously wrote about how to easily deploy TimescaleDB. In this blog, we will show you how to monitor different aspects of TimescaleDB performance with ClusterControl. First of all, allow me to provide a bit of introduction about TimescaleDB.

TimescaleDB is implemented as an extension on PostgreSQL, which means that a Timescale database runs within a PostgreSQL instance. The extension model allows the database to take advantage of many of the attributes of PostgreSQL such as reliability, security, and connectivity to a wide range of third-party tools. At the same time, TimescaleDB leverages the high degree of customization available to extensions by adding hooks deep into PostgreSQL's query planner, data model, and execution engine. It's ecosystem speaks the native language that PostgreSQL does, and adds specialized functions (and query optimizations) for working with time-series data. One of the advantages that TimescaleDB offers over other specialized datastores for storing IoT or time-series data is that, you can use SQL syntax which means you can take advantage of JOINs. So querying a diverse metadata is easier for developers - it simplifies their stack and eliminates data silos.

TimescaleDB has been tested and benchmarked with hundreds of billions of rows, and it scales very well– especially with upserts or inserts in comparison to vanilla PostgreSQL. If you're interested with their benchmarking tools, you might consider taking a look at their Time Series Benchmark Suite (TSBS).

Using TimescaleDB is pretty easy if you're familiar with an RDBMS such as MySQL or PostgreSQL. You must specify your database and create an extension for the TimescaleDB. Once created, you then create a Hypertable, which virtually handles all user interactions with TimescaleDB. See an example below:

nyc_data=# CREATE EXTENSION IF NOT EXISTS timescaledb CASCADE;
WARNING:  
WELCOME TO
 _____ _                               _     ____________  
|_   _(_)                             | |    |  _  \ ___ \ 
  | |  _ _ __ ___   ___  ___  ___ __ _| | ___| | | | |_/ / 
  | | | |  _ ` _ \ / _ \/ __|/ __/ _` | |/ _ \ | | | ___ \ 
  | | | | | | | | |  __/\__ \ (_| (_| | |  __/ |/ /| |_/ /
  |_| |_|_| |_| |_|\___||___/\___\__,_|_|\___|___/ \____/
               Running version 1.2.2
For more information on TimescaleDB, please visit the following links:

 1. Getting started: https://docs.timescale.com/getting-started
 2. API reference documentation: https://docs.timescale.com/api
 3. How TimescaleDB is designed: https://docs.timescale.com/introduction/architecture

Note: TimescaleDB collects anonymous reports to better understand and assist our users.
For more information and how to disable, please see our docs https://docs.timescaledb.com/using-timescaledb/telemetry.

CREATE EXTENSION
nyc_data=# SELECT create_hypertable('rides_count', 'one_hour');
    create_hypertable     
--------------------------
 (1,public,rides_count,t)
(1 row)

Simple as that. However, once data goes big, a follow-up question you might have would be "How you can monitor the performance of TimescaleDB"? Well, this is what our blog is all about. Let's see how you can do this with ClusterControl.

Monitoring TimescaleDB Clusters

Monitoring a TimescaleDB cluster in ClusterControl is almost the same as monitoring a PostgreSQL database cluster. We have the Cluster- and Node-level graphs, Dashboards, Topologies, Query Monitoring, and Performance. Let's go over each of these.

The "Overview" Tab

The Overview Graphs can be located by going to Cluster → Overview tab.

On this view, you can view server load, cache hit ratio or filter on other metrics - blocks-hit, blocks-read, commits, or number of connections.

You can also create your custom dashboard settings here just like my example below which fetches blocks-hit and blocks-read.

This is a good place to start as well as you monitor network activity, checking the transfer and receive packets.

The "Nodes" Tab

The nodes graphs can be located by going to Cluster → Nodes tab. This contains an in-depth view of your nodes, with host and database-level metrics. See the graph below:

You can also check the top processes running in the host system if you click "Top" tab. See an example screenshot below:

There's also some features upon right-clicking the node wherein you can enable WAL archiving or restart the PostgreSQL daemon or reboot the host. See image as shown below:

This can be helpful if you want to schedule maintenance on an under-performing node.

The "Dashboards" Tab

Dashboards was just released last year and with the support of PostgreSQL dashboards, you can take advantage of these graphs. For example, I inserted 1M rows in nyc_data database. See below how it reflects in the PostgreSQL Overview Dashboard:

After inserting the 1.1 M rows, we can see that the node 192.168.70.40 is still performant and there's no sign of high CPU and high disk utilization. See the following dashboard while we monitor its performance:

Aside from the Cluster Overview Dashboard, you can also have a granular view of system performance. See image below:

ClusterControl
Single Console for Your Entire Database Infrastructure
Find out what else is new in ClusterControl

The "Topology" Tab

This tab is simple but offers a view of your master-slave replication topology. It gives you brief but concise information about how does your master and slaves perform. See image below:

The "Query Monitor" Tab

Monitoring queries in TimescaleDB is very important for a DBA as well as the developers handling the application logic. This tab is very important to understand how queries perform. You can view here the top queries, running queries, query outliers, and query statistics. For example, you can view the queries running on all hosts, or you can filter based on the node you're trying to monitor. An example below shows how it looks like when viewed under the Query Monitor.

If you want to gather statistics of your TimescaleDB chunks/indexes, you can take advantage here under Query Statistics. It shows a list of your indexes that are used by TimescaleDB. See image below:

Not only you can view the stats of specific indexes, you can also filter it by its table I/O statistics, index I/O statistics, or its exclusive lock waits. Hence you can check out the other items in the "Statistic" list which you prefer to monitor.

The "Performance" Tab

Under this tab, this is where you are able to review the variables set for optimization and tuning, set up advisors, check the database growth, and generate a schema analysis to gather tables without Primary Keys.

For example, you can view side-by-side the available nodes in the setup and compare variables. See tab below:

That’s all for now. It would be great to hear your feedback, and especially let us know what we are missing.

How to Achieve Automatic Failover for TimescaleDB

$
0
0

The rising demand for high availability systems and tight SLA’s pushes us to replace manual procedures with automated solutions. But do you have the time and necessary resources to address the complexity of failover operations by yourself? Will you sacrifice production database downtime to learn it the hard way?

ClusterControl provides advanced support for failure detection and handling. It’s used by many enterprise organizations, keeping the most critical productions systems up and running in 24/7 mode.

This database management solution also supports you with the deployment of different load proxies. These proxies play a key role in the HA stack so there is no need to adjust application connection string or DNS entry to redirect application connections to the new master node.

When failure is detected, ClusterControl does all the background work to elect a new master, deploy fail-over slave servers, and configure load balancers. In this blog, you will learn how to achieve automatic failover of TimescaleDB in your production systems.

Deploying Entire Replication Topologies

Starting from ClusterControl 1.7.2 you can deploy an entire TimescaleDB replication setup in the same way as you would deploy PostgreSQL: you can use “Deploy Cluster” menu to deploy a primary and one or more TimescaleDB standby servers. Let’s see what it looks like.

First, you need to define access details when deploying new clusters using ClusterControl. It requires root or sudo password access to all nodes on which your new cluster will be deployed.

ClusterControl: Deploy new cluster

Next, we need to define the user and password for the TimescaleDB user.

ClusterControl: Deploy database cluster

Finally, you want to define the topology - which host should be the primary and which hosts should be configured as standby. While you define hosts in the topology, ClusterControl will check if the ssh access works as expected - this lets you catch any connectivity issues early on. On the last screen, you will be asked about the type of replication synchronous or asynchronous.

ClusterControl deployment

That’s it, it is then a matter of starting the deployment. A job is created in ClusterControl, and you will be able to follow the progress.

ClusterControl: Define topology for TimescleDb cluster

Once you finish you will see the topology setup with roles in the cluster. Note that we also added a load balancer (HAProxy) in front of the database instances so the automatic failover will not require changes in the database connection settings.

ClusterControl: Topology

When Timescale is deployed by ClusterControl automatic recovery is enabled by default. The state can be checked in the cluster bar.

ClusterControl: Auto Recovery Cluster and Node state

Failover Configuration

Once the replication setup is deployed, ClusterControl is able to monitor the setup and automatically recover any failed servers. It can also orchestrate changes in topology.

ClusterControl automatic failover was designed with the following principles:

  • Make sure the master is really dead before you failover
  • Failover only once
  • Do not failover to an inconsistent slave
  • Only write to the master
  • Do not automatically recover the failed master

With the built-in algorithms, failover can often be performed pretty quickly so you can assure the highest SLA’s for your database environment.

The process is configurable. It comes with multiple parameters which you can use to adopt recovery to the specifics of your environment.

max_replication_lagMax allowed replication lag in seconds before
replication_stop_on_errorFailover/switchover procedures will fail if errors are encountered that may cause data loss. Enabled by default. 0 means disable,
replication_auto_rebuild_slaveIf the SQL THREAD is stopped and the error code is non-zero then the slave will be automatically rebuilt. 1 means enable, 0 means disable (default).
replication_failover_blacklistComma-separated list of hostname:port pairs. Blacklisted servers will not be considered as a candidate during failover. replication_failover_blacklist is ignored if replication_failover_whitelist is set.
replication_failover_whitelistComma separated list of hostname:port pairs. Only whitelisted servers will be considered as a candidate during failover. If no server on the whitelist is available (up/connected) the failover will fail. replication_failover_blacklist is ignored if replication_failover_whitelist is set.
ClusterControl
Single Console for Your Entire Database Infrastructure
Find out what else is new in ClusterControl

Failover Handling

When a master failure is detected, a list of master candidates is created and one of them is chosen to be the new master. It is possible to have a whitelist of servers to promote to primary, as well as a blacklist of servers that cannot be promoted to primary. The remaining slaves are now slaved off the new primary, and the old primary is not restarted.

Below we can see a simulation of node failure.

Simulate master node failure with kill

When nodes malfunction is detected and auto recovery is detected ClusterControl triggers job to perform failover. Below we can see actions taken to recover the cluster.

ClusterControl: Job triggered to rebuild the cluster

ClusterControl intentionally keeps the old primary offline because it may happen that some of the data have not been transferred to the standby servers. In such a case, the primary is the only host containing this data and you may want to recover the missing data manually. For those who want to have the failed primary automatically rebuilt, there is an option in the cmon configuration file: replication_auto_rebuild_slave. By default, it’s disabled but when the user enables it, the failed primary will be rebuilt as a slave of the new primary. Of course, if there is any lacking data which exists only on the failed primary, that data will be lost.

Rebuilding Standby Servers

Different feature is “Rebuild Replication Slave” job which is available for all slaves (or standby servers) in the replication setup. This is to be used for instance when you want to clear out the data on the standby and rebuild it again with a fresh copy of data of the primary. It can be beneficial if a standby server is not able to connect and replicate from the primary for some reason.

ClusterControl: Rebuild replication slave
ClusterControl: Rebuild slave

Scaling Your Time-Series Database - How to Simply Scale TimescaleDB

$
0
0

In the previous blogs, my colleagues and I showed you how you can monitor performance, manage and deploy clusters, run backups and even enable automatic failover for TimescaleDB.

In this blog we will show you how to scale your single TimescaleDB instance to multi-node cluster in just a few simple steps.

We will start with a common setup, a single node instance running on CentosOS. The node is up-and-running and it’s already being monitored and managed by the ClusterControl.

If you would like to learn how to deploy or import your TimescaleDB instance, check out the blog written by my colleague Sebastian Insausti, “How to Easily Deploy TimescaleDB.”

The setup looks as follows...

ClusterControl: Single instance TimescaleDB

So, it’s a single production instance and we want to convert it to cluster with no downtime. Our main goal is to scale application read operations to other machines with an option to use them as staging HA servers when writing server crash.

More nodes should also reduce application maintenance downtime. Like patching applied in the rolling restart mode - one node patched at the time while other nodes are serving database connections.

The last requirement is to create a single address for our new cluster so our new nodes will be visible for the application from one place.

We can summarize our action plan into two major steps:

  • Adding a replica reads
  • Install and configure Haproxy

Adding a Replica Reads

If we go to cluster actions and select “Add Replication Slave”, we can either create a new replica from scratch or add an existing TimescaleDB database as a replica.

ClusterControl: Add replication slave
ClusterControl: Add new Replication slave, Import existing Replication Slave

As you can see in the below image, we only need to choose our Master server, enter the IP address for our new slave server and the database port.

ClusterControl: Add replication slave

Then we can choose if we want ClusterControl to install the software for us and if the replication slave should be Synchronous or Asynchronous. When you are importing existing slave server you can use the import option as follows:

ClusterControl: Import replication slave for TimescaleDB

Both ways, we can add as many replicas as we want. In our example case, we will add two nodes. CusterControl will create an internal job and take care of all the necessary steps with one none at a time.

ClusterControl: add read replica
ClusterControl
Single Console for Your Entire Database Infrastructure
Find out what else is new in ClusterControl

Adding a Load Balancer to TimescaleDB

At this point, our data is distributed across multiple nodes or data centers if you chose to add replication slave nodes in a different location. The cluster is scaled out with two additional read replica nodes.

ClusterControl: Two nodes added

The question is how does the application know which database node to access? We will use HAProxy and different ports for write and read operations.

From the TimescaleDB cluster, context menu choose to add load balancer.

Now we need to provide the location of the server where Haproxy should be installed, what policy we want to use for database connections and which nodes take part of the Haproxy configuration.

When all is set hit deploy button. After a few minutes, we should get our cluster configuration ready. ClusterControl will take care of all prerequisites and configurations to deploy load balancer.

After a successful deployment, we can see our new cluster’s topology; with load balancing and additional read nodes. With more nodes on-board, ClusterControl automatically enables auto recovery. This way when the master node goes down, the failover operation will start by itself.

ClusterControl: Final topology

Conclusion

TimescaleDB is an open-source database invented to make SQL scalable for time-series data. Having an automated way to extend their cluster is a key to achieving performance and efficiency. As we have seen above, you can now scale TimescaleDB by using ClusterControl with ease.

Benchmarking Managed PostgreSQL Cloud Solutions - Part Three: Google Cloud

$
0
0

In this 3rd part of Benchmarking Managed PostgreSQL Cloud Solutions, I took advantage of Google’s GCP free tier offering. It has been a worthwhile experience and as a sysadmin spending most of his time at the console I couldn’t miss the opportunity of trying out cloud shell, one of the console features that sets Google apart from the cloud provider I’m more familiar with, Amazon Web Services.

To quickly recap, in Part 1 I looked at the available benchmark tools and explained why I chose AWS Benchmark Procedure for Aurora. I also benchmarked Amazon Aurora for PostgreSQL version 10.6. In Part 2 I reviewed AWS RDS for PostgreSQL version 11.1.

During this round, the tests based on the AWS Benchmark Procedure for Aurora will be run against Google Cloud SQL for PostgreSQL 9.6 since the version 11.1 is still in beta.

Cloud Instances

Prerequisites

As mentioned in the previous two articles, I opted for leaving PostgreSQL settings at their cloud GUC defaults, unless they prevent tests from running (see further down below). Recall from previous articles that the assumption has been that out of the box the cloud provider should have the database instance configured in order to provide a reasonable performance.

The AWS pgbench timing patch for PostgreSQL 9.6.5 applied cleanly to Google Cloud version of PostgreSQL 9.6.10.

Using the information Google put out in their blog Google Cloud for AWS Professionals I matched up the specs for the client and the target instances with respect to the Compute, Storage, and Networking components. For example, Google Cloud equivalent of AWS Enhanced Networking is achieved by sizing the compute node based on the formula:

max( [vCPUs x 2Gbps/vCPU], 16Gbps)

When it comes to setting up the target database instance, similarly to AWS, Google Cloud allows no replicas, however, the storage is encrypted at rest and there is no option to disable it.

Finally, in order to achieve the best network performance, the client and the target instances must be located in the same availability zone.

Client

The client instance specs matching the closest the AWS instance, are:

  • vCPU: 32 (16 Cores x 2 Threads/Core)
  • RAM: 208 GiB (maximum for the 32 vCPU instance)
  • Storage: Compute Engine persistent disk
  • Network: 16 Gbps (max of [32 vCPUs x 2 Gbps/vCPU] and 16 Gbps)

Instance details after initialization:

Client instance: Compute and Network

Note: Instances are by default limited to 24 vCPUs. Google Technical Support must approve the quota increase to 32 vCPUs per instance.

While such requests are usually handled within 2 business days, I have to give Google Support Services a thumbs up for completing my request in only 2 hours.

For the curious, the network speed formula is based on the compute engine documentation referenced in this GCP blog.

DB Cluster

Below are the database instance specs:

  • vCPU: 8
  • RAM: 52 GiB (maximum)
  • Storage: 144 MB/s, 9,000 IOPS
  • Network: 2,000 MB/s

Note that the maximum available memory for an 8 vCPU instance is 52 GiB. More memory can be allocated by selecting a larger instance (more vCPUs):

Database CPU and Memory sizing

While Google SQL can automatically expand the underlying storage, which by the way is a really cool feature, I chose to disable the option in order to be consistent with the AWS feature set, and avoid a potential I/O impact during the resize operation. (“potential”, because it should have no negative impact at all, however in my experience resizing any type of underlying storage increases the I/O, even if for a few seconds).

Recall that the AWS database instance was backed up by an optimized EBS storage which provided a maximum of:

  • 1,700 Mbps bandwidth
  • 212.5 MB/s throughput
  • 12,000 IOPS

With Google Cloud we achieve a similar configuration by adjusting the number of vCPUs (see above) and storage capacity:

Databse storage configuration and backup settings

Running the Benchmarks

Setup

Next, install the benchmark tools, pgbench and sysbench by following the instructions in the Amazon guide adapted to PostgreSQL version 9.6.10.

Initialize the PostgreSQL environment variables in .bashrc and set the paths to PostgreSQL binaries and libraries:

export PGHOST=10.101.208.7
export PGUSER=postgres
export PGPASSWORD=postgres
export PGDATABASE=postgres
export PGPORT=5432
export PATH=$PATH:/usr/local/pgsql/bin
export LD_LIBRARY_PATH=$LD_LIBRARY_PATH:/usr/local/pgsql/lib

Preflight checklist:

[root@client ~]# psql --version
psql (PostgreSQL) 9.6.10
[root@client ~]# pgbench --version
pgbench (PostgreSQL) 9.6.10
[root@client ~]# sysbench --version
sysbench 0.5
postgres=> select version();
                                                 version
---------------------------------------------------------------------------------------------------------
 PostgreSQL 9.6.10 on x86_64-pc-linux-gnu, compiled by gcc (Ubuntu 4.8.4-2ubuntu1~14.04.3) 4.8.4, 64-bit
(1 row)

And we are ready for takeoff:

pgbench

Initialize the pgbench database.

[root@client ~]# pgbench -i --fillfactor=90 --scale=10000

…and several minutes later:

NOTICE:  table "pgbench_history" does not exist, skipping
NOTICE:  table "pgbench_tellers" does not exist, skipping
NOTICE:  table "pgbench_accounts" does not exist, skipping
NOTICE:  table "pgbench_branches" does not exist, skipping
creating tables...
100000 of 1000000000 tuples (0%) done (elapsed 0.09 s, remaining 872.42 s)
200000 of 1000000000 tuples (0%) done (elapsed 0.19 s, remaining 955.00 s)
300000 of 1000000000 tuples (0%) done (elapsed 0.33 s, remaining 1105.08 s)
400000 of 1000000000 tuples (0%) done (elapsed 0.53 s, remaining 1317.56 s)
500000 of 1000000000 tuples (0%) done (elapsed 0.63 s, remaining 1258.72 s)

...

500000000 of 1000000000 tuples (50%) done (elapsed 943.93 s, remaining 943.93 s)
500100000 of 1000000000 tuples (50%) done (elapsed 944.08 s, remaining 943.71 s)
500200000 of 1000000000 tuples (50%) done (elapsed 944.22 s, remaining 943.46 s)
500300000 of 1000000000 tuples (50%) done (elapsed 944.33 s, remaining 943.20 s)
500400000 of 1000000000 tuples (50%) done (elapsed 944.47 s, remaining 942.96 s)
500500000 of 1000000000 tuples (50%) done (elapsed 944.59 s, remaining 942.70 s)
500600000 of 1000000000 tuples (50%) done (elapsed 944.73 s, remaining 942.47 s)

...

999600000 of 1000000000 tuples (99%) done (elapsed 1878.28 s, remaining 0.75 s)
999700000 of 1000000000 tuples (99%) done (elapsed 1878.41 s, remaining 0.56 s)
999800000 of 1000000000 tuples (99%) done (elapsed 1878.58 s, remaining 0.38 s)
999900000 of 1000000000 tuples (99%) done (elapsed 1878.70 s, remaining 0.19 s)
1000000000 of 1000000000 tuples (100%) done (elapsed 1878.83 s, remaining 0.00 s)
vacuum...
set primary keys...
total time: 5978.44 s (insert 1878.90 s, commit 0.04 s, vacuum 2484.96 s, index 1614.54 s)
done.

As we are now used to, the database size must be 160GB. Let’s verify that:

postgres=>  SELECT
postgres->       d.datname AS Name,
postgres->       pg_catalog.pg_get_userbyid(d.datdba) AS Owner,
postgres->       pg_catalog.pg_size_pretty(pg_catalog.pg_database_size(d.datname)) AS SIZE
postgres->    FROM pg_catalog.pg_database d
postgres->    WHERE d.datname = 'postgres';
   name   |       owner       |  size
----------+-------------------+--------
postgres | cloudsqlsuperuser | 160 GB
(1 row)

With all the preparations completed start the read/write test:

[root@client ~]# pgbench --protocol=prepared -P 60 --time=600 --client=1000 --jobs=2048
starting vacuum...end.
connection to database "postgres" failed:
FATAL:  sorry, too many clients already :: proc.c:341
connection to database "postgres" failed:
FATAL:  sorry, too many clients already :: proc.c:341
connection to database "postgres" failed:
FATAL:  remaining connection slots are reserved for non-replication superuser connections

Oops! What is the maximum?

postgres=> show max_connections ;
 max_connections
-----------------
 600
(1 row)

So, while AWS sets a largely enough max_connections as I didn’t encounter that issue, Google Cloud requires a small tweak...Back to the cloud console, update the database parameter, wait a few minutes and then check:

postgres=> show max_connections ;
 max_connections
-----------------
 1005
(1 row)

Restarting the test everything appears to be working just fine:

starting vacuum...end.
progress: 60.0 s, 5461.7 tps, lat 172.821 ms stddev 251.666
progress: 120.0 s, 4444.5 tps, lat 225.162 ms stddev 365.695
progress: 180.0 s, 4338.5 tps, lat 230.484 ms stddev 373.998

...but there is another catch. I was in for a surprise when attempting to open a new psql session in order to count the number of connections:

psql: FATAL: remaining connection slots are reserved for non-replication superuser connections

Could it be that superuser_reserved_connections isn’t at its default?

postgres=> show superuser_reserved_connections ;
 superuser_reserved_connections
--------------------------------
 3
(1 row)

That is the default, then what else could it be?

postgres=> select usename from pg_stat_activity ;
   usename
---------------
cloudsqladmin
cloudsqlagent
postgres
(3 rows)

Bingo! Another bump of max_connections takes care of it, however, it required that I restart the pgbench test. And that is folks the story behind the apparent duplicate run in the graphs below.

And finally, the results are in:

progress: 60.0 s, 4553.6 tps, lat 194.696 ms stddev 250.663
progress: 120.0 s, 3646.5 tps, lat 278.793 ms stddev 434.459
progress: 180.0 s, 3130.4 tps, lat 332.936 ms stddev 711.377
progress: 240.0 s, 3998.3 tps, lat 250.136 ms stddev 319.215
progress: 300.0 s, 3305.3 tps, lat 293.250 ms stddev 549.216
progress: 360.0 s, 3547.9 tps, lat 289.526 ms stddev 454.484
progress: 420.0 s, 3770.5 tps, lat 265.977 ms stddev 470.451
progress: 480.0 s, 3050.5 tps, lat 327.917 ms stddev 643.983
progress: 540.0 s, 3591.7 tps, lat 273.906 ms stddev 482.020
progress: 600.0 s, 3350.9 tps, lat 296.303 ms stddev 566.792
transaction type: <builtin: TPC-B (sort of)>
scaling factor: 10000
query mode: prepared
number of clients: 1000
number of threads: 1000
duration: 600 s
number of transactions actually processed: 2157735
latency average = 278.149 ms
latency stddev = 503.396 ms
tps = 3573.331659 (including connections establishing)
tps = 3591.759513 (excluding connections establishing)

sysbench

Populate the database:

sysbench --test=/usr/local/share/sysbench/oltp.lua \
--pgsql-host=${PGHOST} \
--pgsql-db=${PGDATABASE} \
--pgsql-user=${PGUSER} \
--pgsql-password=${PGPASSWORD} \
--pgsql-port=${PGPORT} \
--oltp-tables-count=250\
--oltp-table-size=450000 \
prepare

Output:

sysbench 0.5:  multi-threaded system evaluation benchmark
Creating table 'sbtest1'...
Inserting 450000 records into 'sbtest1'
Creating secondary indexes on 'sbtest1'...
Creating table 'sbtest2'...
Inserting 450000 records into 'sbtest2'
...
Creating table 'sbtest249'...
Inserting 450000 records into 'sbtest249'
Creating secondary indexes on 'sbtest249'...
Creating table 'sbtest250'...
Inserting 450000 records into 'sbtest250'
Creating secondary indexes on 'sbtest250'...

And now run the test:

sysbench --test=/usr/local/share/sysbench/oltp.lua \
--pgsql-host=${PGHOST} \
--pgsql-db=${PGDATABASE} \
--pgsql-user=${PGUSER} \
--pgsql-password=${PGPASSWORD} \
--pgsql-port=${PGPORT} \
--oltp-tables-count=250 \
--oltp-table-size=450000 \
--max-requests=0 \
--forced-shutdown \
--report-interval=60 \
--oltp_simple_ranges=0 \
--oltp-distinct-ranges=0 \
--oltp-sum-ranges=0 \
--oltp-order-ranges=0 \
--oltp-point-selects=0 \
--rand-type=uniform \
--max-time=600 \
--num-threads=1000 \
run

And the results:

sysbench 0.5:  multi-threaded system evaluation benchmark

Running the test with following options:
Number of threads: 1000
Report intermediate results every 60 second(s)
Random number generator seed is 0 and will be ignored

Forcing shutdown in 630 seconds

Initializing worker threads...

Threads started!

[  60s] threads: 1000, tps: 1320.25, reads: 0.00, writes: 5312.62, response time: 1484.54ms (95%), errors: 0.00, reconnects:  0.00
[ 120s] threads: 1000, tps: 1486.77, reads: 0.00, writes: 5944.30, response time: 1290.87ms (95%), errors: 0.00, reconnects:  0.00
[ 180s] threads: 1000, tps: 1143.62, reads: 0.00, writes: 4585.67, response time: 1649.50ms (95%), errors: 0.02, reconnects:  0.00
[ 240s] threads: 1000, tps: 1498.23, reads: 0.00, writes: 5993.06, response time: 1269.03ms (95%), errors: 0.00, reconnects:  0.00
[ 300s] threads: 1000, tps: 1520.53, reads: 0.00, writes: 6058.57, response time: 1439.90ms (95%), errors: 0.02, reconnects:  0.00
[ 360s] threads: 1000, tps: 1234.57, reads: 0.00, writes: 4958.08, response time: 1550.39ms (95%), errors: 0.02, reconnects:  0.00
[ 420s] threads: 1000, tps: 1722.25, reads: 0.00, writes: 6890.98, response time: 1132.25ms (95%), errors: 0.00, reconnects:  0.00
[ 480s] threads: 1000, tps: 2306.25, reads: 0.00, writes: 9233.84, response time: 842.11ms (95%), errors: 0.00, reconnects:  0.00
[ 540s] threads: 1000, tps: 1432.85, reads: 0.00, writes: 5720.15, response time: 1709.83ms (95%), errors: 0.02, reconnects:  0.00
[ 600s] threads: 1000, tps: 1332.93, reads: 0.00, writes: 5347.10, response time: 1443.78ms (95%), errors: 0.02, reconnects:  0.00
OLTP test statistics:
   queries performed:
      read:                            0
      write:                           3603595
      other:                           1801795
      total:                           5405390
   transactions:                        900895 (1500.68 per sec.)
   read/write requests:                 3603595 (6002.76 per sec.)
   other operations:                    1801795 (3001.38 per sec.)
   ignored errors:                      5      (0.01 per sec.)
   reconnects:                          0      (0.00 per sec.)

General statistics:
   total time:                          600.3231s
   total number of events:              900895
   total time taken by event execution: 600164.2510s
   response time:
         min:                                  6.78ms
         avg:                                666.19ms
         max:                               4218.55ms
         approx.  95 percentile:            1397.02ms

Threads fairness:
   events (avg/stddev):           900.8950/14.19
   execution time (avg/stddev):   600.1643/0.10
Download the Whitepaper Today
 
PostgreSQL Management & Automation with ClusterControl
Learn about what you need to know to deploy, monitor, manage and scale PostgreSQL

Benchmark Metrics

The PostgreSQL plugin for Stackdriver has been deprecated as of February 28th, 2019. While Google recommends Blue Medora, for the purpose of this article I chose to do away with creating an account and to rely on available Stackdriver metrics.

  • CPU Utilization:
    Google Cloud SQL: PostgreSQL CPU Utilization
    Photo author
    Google Cloud SQL: PostgreSQL CPU Utilization
  • Disk Read/Write operations:
    Google Cloud SQL: PostgreSQL Disk Read/Write operations
    Photo author
    Google Cloud SQL: PostgreSQL Disk Read/Write operations
  • Network Sent/Received Bytes:
    Google Cloud SQL: PostgreSQL Network Sent/Received bytes
    Photo author
    Google Cloud SQL: PostgreSQL Network Sent/Received bytes
  • PostgreSQL Connections Count:
    Google Cloud SQL: PostgreSQL Connections Count
    Photo author
    Google Cloud SQL: PostgreSQL Connections Count

Benchmark Results

pgbench Initialization

AWS Aurora, AWS RDS, Google Cloud SQL: PostgreSQL pgbench initialization results

pgbench run

AWS Aurora, AWS RDS, Google Cloud SQL: PostgreSQL pgbench run results

sysbench

AWS Aurora, AWS RDS, Google Cloud SQL: PostgreSQL sysbench results

Conclusion

Amazon Aurora comes first by far in write heavy (sysbench) tests, while being at par with Google Cloud SQL in the pgbench read/write tests. The load test (pgbench initialization) puts Google Cloud SQL in the first place, followed by Amazon RDS. Based on a cursory look at the pricing models for AWS Aurora and Google Cloud SQL, I would hazard to say that out of the box Google Cloud is a better choice for the average user, while AWS Aurora is better suited for high performance environments. More analysis will follow after completing all the benchmarks.

The next and last part of this benchmark series will be on Microsoft Azure PostgreSQL.

Thanks for reading and please comment below if you have feedback.

How to Perform a Failback Operation for MySQL Replication Setup

$
0
0

MySQL master-slave replication is pretty easy and straightforward to set up. This is the main reason why people choose this technology as the first step to achieve better database availability. However, it comes at the price of complexity in management and maintenance; it is up to the admin to maintain the data integrity, especially during failover, failback, maintenance, upgrade and so on.

There are many articles out there describing on how to perform failover operation for replication setup. We have also covered this topic in this blog post, Introduction to Failover for MySQL Replication - the 101 Blog. In this blog post, we are going to cover the post-disaster tasks when restoring to the original topology - performing failback operation.

Why Do We Need Failback?

The replication leader (master) is the most critical node in a replication setup. It requires good hardware specs to ensure it can process writes, generate replication events, process critical reads and so on in a stable way. When failover is required during disaster recovery or maintenance, it might not be uncommon to find us promoting a new leader with inferior hardware. This situation might be okay temporarily, however for a long run, the designated master must be brought back to lead the replication after it is deemed healthy.

Contrary to failover, failback operation usually happens in a controlled environment through switchover, it rarely happens in panic-mode. This gives the operation team some time to plan carefully and rehearse the exercise for a smooth transition. The main objective is simply to bring back the good old master to the latest state and restore the replication setup to its original topology. However, there are some cases where failback is critical, for example when the newly promoted master did not work as expected and affecting the overall database service.

How to Perform Failback Safely?

After failover happened, the old master would be out of the replication chain for maintenance or recovery. To perform the switchover, one must do the following:

  1. Provision the old master to the correct state, by making it the most up-to-date slave.
  2. Stop the application.
  3. Verify all slaves are caught up.
  4. Promote the old master as the new leader.
  5. Repoint all slaves to the new master.
  6. Start up the application by writing to the new master.

Consider the following replication setup:

"A" was a master until a disk-full event causing havoc to the replication chain. After a failover event, our replication topology was lead by B and replicates onto C till E. The failback exercise will bring back A as the leader and restore the original topology before the disaster. Take note that all nodes are running on MySQL 8.0.15 with GTID enabled. Different major version might use different commands and steps.

While this is what our architecture looks like now after failover (taken from ClusterControl's Topology view):

Node Provisioning

Before A can be a master, it must be brought up-to-date with the current database state. The best way to do this is to turn A as slave to the active master, B. Since all nodes are configured with log_slave_updates=ON (it means a slave also produces binary logs), we can actually pick other slaves like C and D as the source of truth for initial syncing. However, the closer to the active master, the better. Keep in mind of the additional load it might cause when taking the backup. This part takes the most of the failback hours. Depending on the node state and dataset size, syncing up the old master could take some time (it could be hours and days).

Once problem on "A" is resolved and ready to join the replication chain, the best first step is to attempt replicating from "B" (192.168.0.42) with CHANGE MASTER statement:

mysql> SET GLOBAL read_only = 1; /* enable read-only */
mysql> CHANGE MASTER TO MASTER_HOST = '192.168.0.42', MASTER_USER = 'rpl_user', MASTER_PASSWORD = 'p4ss', MASTER_AUTO_POSITION = 1; /* master information to connect */
mysql> START SLAVE; /* start replication */
mysql> SHOW SLAVE STATUS\G /* check replication status */

If replication works, you should see the following in the replication status:

             Slave_IO_Running: Yes
            Slave_SQL_Running: Yes

If the replication fails, look at the Last_IO_Error or Last_SQL_Error from slave status output. For example, if you see the following error:

Last_IO_Error: error connecting to master 'rpl_user@192.168.0.42:3306' - retry-time: 60  retries: 2

Then, we have to create the replication user on the current active master, B:

mysql> CREATE USER rpl_user@192.168.0.41 IDENTIFIED BY 'p4ss';
mysql> GRANT REPLICATION SLAVE ON *.* TO rpl_user@192.168.0.41;

Then, restart the slave on A to start replicating again:

mysql> STOP SLAVE;
mysql> START SLAVE;

Other common error you would see is this line:

Last_IO_Error: Got fatal error 1236 from master when reading data from binary log: ...

That probably means the slave is having problem reading the binary log file from the current master. In some occasions, the slave might be way behind whereby the required binary events to start the replication have been missing from the current master, or the binary on the master has been purged during the failover and so on. In this case, the best way is to perform a full sync by taking a full backup on B and restore it on A. On B, you can use either mysqldump or Percona Xtrabackup to take a full backup:

$ mysqldump -uroot -p --all-databases --single-transaction --triggers --routines > dump.sql # for mysqldump
$ xtrabackup --defaults-file=/etc/my.cnf --backup --parallel 1 --stream=xbstream --no-timestamp | gzip -6 - > backup-full-2019-04-16_071649.xbstream.gz # for xtrabackup

Transfer the backup file to A, reinitialize the existing MySQL installation for a proper cleanup and perform database restoration:

$ systemctl stop mysqld # if mysql is still running
$ rm -Rf /var/lib/mysql # wipe out old data
$ mysqld --initialize --user=mysql # initialize database
$ systemctl start mysqld # start mysql
$ grep -i 'temporary password' /var/log/mysql/mysqld.log # retrieve the temporary root password
$ mysql -uroot -p -e 'ALTER USER root@localhost IDENTIFIED BY "p455word"' # mandatory root password update
$ mysql -uroot -p < dump.sql # restore the backup using the new root password

Once restored, setup the replication link to the active master B (192.168.0.42) and enable read-only. On A, run the following statements:

mysql> SET GLOBAL read_only = 1; /* enable read-only */
mysql> CHANGE MASTER TO MASTER_HOST = '192.168.0.42', MASTER_USER = 'rpl_user', MASTER_PASSWORD = 'p4ss', MASTER_AUTO_POSITION = 1; /* master information to connect */
mysql> START SLAVE; /* start replication */
mysql> SHOW SLAVE STATUS\G /* check replication status */

For Percona Xtrabackup, please refer to the documentation page on how to restore to A. It involves a prerequisite step to prepare the backup first before replacing the MySQL data directory.

Once A has started replicating correctly, monitor the Seconds_Behind_Master in the slave status. This will give you an idea on how far the slave has left behind and how long you need to wait before it catches up. At this point, our architecture looks like this:

Once Seconds_Behind_Master falls back to 0, that's the moment when A has caught up as an up-to-date slave.

If you are using ClusterControl, you have the option to resync the node by restoring from an existing backup or create and stream the backup directly from the active master node:

Staging the slave with existing backup is the recommended way to do in order to build the slave, since it doesn't bring any impact the active master server when preparing the node.

Promote the Old Master

Before promoting A as the new master, the safest way is to stop all writes operation on B. If this is not possible, simply force B to operate in read-only mode:

mysql> SET GLOBAL read_only = 'ON';
mysql> SET GLOBAL super_read_only = 'ON';

Then, on A, run SHOW SLAVE STATUS and check the following replication status:

Read_Master_Log_Pos: 45889974
Exec_Master_Log_Pos: 45889974
Seconds_Behind_Master: 0
Slave_SQL_Running_State: Slave has read all relay log; waiting for more updates

The value of Read_Master_Log_Pos and Exec_Master_Log_Pos must be identical, while Seconds_Behind_Master is 0 and the state must be 'Slave has read all relay log'. Make sure that all slaves have processed any statements in their relay log, otherwise you will risk that the new queries will affect transactions from the relay log, triggering all sorts of problems (for example, an application may remove some rows which are accessed by transactions from relay log).

On A, stop the replication and use RESET SLAVE ALL statement to remove all replication-related configuration and disable read only:

mysql> STOP SLAVE;
mysql> RESET SLAVE ALL;
mysql> SET GLOBAL read_only = 'OFF';
mysql> SET GLOBAL super_read_only = 'OFF';

At this point, A is ready to accept writes (read_only=OFF), however slaves are not connected to it, as illustrated below:

For ClusterControl users, promoting A can be done by using "Promote Slave" feature under Node Actions. ClusterControl will automatically demote the active master B, promote slave A as master and repoint C and D to replicate from A. B will be put aside and user has to explicitly choose "Change Replication Master" to rejoin B replicating from A at a later stage.

ClusterControl
Single Console for Your Entire Database Infrastructure
Find out what else is new in ClusterControl

Slave Repointing

It's now safe to change the master on related slaves to replicate from A (192.168.0.41). On all slaves except E, configure the following:

mysql> STOP SLAVE;
mysql> CHANGE MASTER TO MASTER_HOST = '192.168.0.41', MASTER_USER = 'rpl_user', MASTER_PASSWORD = 'p4ss', MASTER_AUTO_POSITION = 1;
mysql> START SLAVE;

If you are a ClusterControl user, you may skip this step as repointing is being performed automatically when you decided to promote A previously.

We can then start our application to write on A. At this point, our architecture is looking something like this:

From ClusterControl topology view, we have restored our replication cluster to its original architecture which looks like this:

Take note that failback exercise is much less risky if compared to failover. It's important to schedule this exercise during off-peak hours to minimize the impact to your business.

Final Thoughts

Failover and failback operation must be performed carefully. The operation is fairly simple if you have a small number of nodes but for multiple nodes with complex replication chain, it could be a risky and error-prone exercise. We also showed how ClusterControl can be used to simplify complex operations by performing them through the UI, plus the topology view is visualized in real-time so you have the understanding on the replication topology you want to build.

Benchmarking Manual Database Deployments vs Automated Deployments

$
0
0

There are multiple ways of deploying a database. You can install it by hand, you can rely on the widely available infrastructure orchestration tools like Ansible, Chef, Puppet or Salt. Those tools are very popular and it is quite easy to find scripts, recipes, playbooks, you name it, which will help you automate the installation of a database cluster. There are also more specialized database automation platforms, like ClusterControl, which can also be used to automated deployment. What would be the best way of deploying your cluster? How much time you will actually need to deploy it?

First, let us clarify what we want to do. Let’s assume we will be deploying Percona XtraDB Cluster 5.7. It will consist of three nodes and for that we will use three Vagrant virtual machines running Ubuntu 16.04 (bento/ubuntu-16.04 image). We will attempt to deploy a cluster manually, then using Ansible and ClusterControl. Let’s see how the results will look like.

Manual Deployment

Repository Setup - 1 minute, 45 seconds.

First of all, we have to configure Percona repositories on all Ubuntu nodes. Quick google search, ssh into the virtual machines and running required commands takes 1m45s

We found the following page with instructions:
https://www.percona.com/doc/percona-repo-config/percona-release.html

and we executed steps described in “DEB-BASED GNU/LINUX DISTRIBUTIONS” section. We also ran apt update, to refresh apt’s cache.

Installing PXC Nodes - 2 minutes 45 seconds

This step basically consists of executing:

root@vagrant:~# apt install percona-xtradb-cluster-5.7

The rest is mostly dependent on your internet connection speed as packages are being downloaded. Your input will also be needed (you’ll be passing a password for the superuser) so it is not unattended installation. When everything is done, you will end up with three running Percona XtraDB Cluster nodes:

root     15488  0.0  0.2   4504  1788 ?        S    10:12   0:00 /bin/sh /usr/bin/mysqld_safe
mysql    15847  0.3 28.3 1339576 215084 ?      Sl   10:12   0:00  \_ /usr/sbin/mysqld --basedir=/usr --datadir=/var/lib/mysql --plugin-dir=/usr/lib/mysql/plugin --user=mysql --wsrep-provider=/usr/lib/galera3/libgalera_smm.so --log-error=/var/log/mysqld.log --pid-file=/var/run/mysqld/mysqld.pid --socket=/var/run/mysqld/mysqld.sock --wsrep_start_position=00000000-0000-0000-0000-000000000000:-1

Configuring PXC nodes - 3 minutes, 25 seconds

Here starts the tricky part. It is really hard to quantify experience and how much time one would need to actually understand what is needed to be done. What is good, google search “how to install percona xtrabdb cluster” points to Percona’s documentation, which describes how the process should look like. It still may take more or less time, depending on how familiar you are with the PXC and Galera in general. Worst case scenario you will not be aware of any additional required actions and you will connect to your PXC and start working with it, not realizing that, in fact, you have three nodes, each forming a cluster of its own.

Let’s assume we follow the recommendation from Percona and time just those steps to be executed. In short, we modified configuration files as per instructions on the Percona website, we also attempted to bootstrap the first node:

root@vagrant:~# /etc/init.d/mysql bootstrap-pxc
mysqld: [ERROR] Found option without preceding group in config file /etc/mysql/my.cnf at line 10!
mysqld: [ERROR] Fatal error in defaults handling. Program aborted!
mysqld: [ERROR] Found option without preceding group in config file /etc/mysql/my.cnf at line 10!
mysqld: [ERROR] Fatal error in defaults handling. Program aborted!
mysqld: [ERROR] Found option without preceding group in config file /etc/mysql/my.cnf at line 10!
mysqld: [ERROR] Fatal error in defaults handling. Program aborted!
mysqld: [ERROR] Found option without preceding group in config file /etc/mysql/my.cnf at line 10!
mysqld: [ERROR] Fatal error in defaults handling. Program aborted!
 * Bootstrapping Percona XtraDB Cluster database server mysqld                                                                                                                                                                                                                     ^C

This did not look correct. Unfortunately, instructions weren’t crystal clear. Again, if you don’t know what is going on, you will spend more time trying to understand what happened. Luckily, stackoverflow.com comes very helpful (although not the first response on the list that we got) and you should realise that you miss [mysqld] section header in your /etc/mysql/my.cnf file. Adding this on all nodes and repeating the bootstrap process solved the issue. In total we spent 3 minutes and 25 seconds (not including googling for the error as we noticed immediately what was the problem).

Configuring for SST, Bringing Other Nodes Into the Cluster - Starting From 8 Minutes to Infinity

The instructions on Percona web site are quite clear. Once you have one node up and running, just start remaining nodes and you will be fine. We tried that and we were unable to see more nodes joining the cluster. This is where it is virtually impossible to tell how long it will take to diagnose the issue. It took us 6-7 minutes but to be able to do it quickly you have to:

  1. Be familiar with how PXC configuration is structured:
    root@vagrant:~# tree  /etc/mysql/
    /etc/mysql/
    ├── conf.d
    │   ├── mysql.cnf
    │   └── mysqldump.cnf
    ├── my.cnf -> /etc/alternatives/my.cnf
    ├── my.cnf.fallback
    ├── my.cnf.old
    ├── percona-xtradb-cluster.cnf
    └── percona-xtradb-cluster.conf.d
        ├── client.cnf
        ├── mysqld.cnf
        ├── mysqld_safe.cnf
        └── wsrep.cnf
  2. Know how the !include and !includedir directives work in MySQL configuration files
  3. Know how MySQL handles the same variables included in multiple files
  4. Know what to look for and be aware of configurations that would result in node bootstrapping itself to form a cluster on its own

The problem was related to the fact that instructions did not mention any file except for /etc/mysql/my.cnf where, in fact, we should have been modifying /etc/mysql/percona-xtradb-cluster.conf.d/wsrep.cnf. That file contained empty variable:

wsrep_cluster_address=gcomm://

and such configuration forces node to bootstrap as it does not have information about other nodes to join to. We set that variable in /etc/mysql/my.cnf but later wsrep.cnf file was included, overwriting our setup.

This issue might be a serious blocker for people who are not really familiar with how MySQL and Galera works, resulting even in hours if not more of debugging.

Total Installation Time - 16 minutes (If You Are MySQL DBA Like I Am)

We managed to install Percona XtraDB Cluster in 16 minutes. You have to keep in mind a couple of things - we did not tune the configuration. This is something which will require more time and knowledge. PXC node comes with some simple configuration, related mostly to binary logging and Galera writeset replication. There is no InnoDB tuning. If you are not familiar with MySQL internals, this is hours if not days of reading and familiarizing yourself with internal mechanisms. Another important thing is that this is a process you would have to re-apply for every cluster you deploy. Finally, we managed to identify the issue and solve it very fast due to our experience with Percona XtraDB Cluster and MySQL in general. Casual user will most likely spend significantly more time trying to understand what is going on and why.

Ansible Playbook

Now, on to automation with Ansible. Let’s try to find and use an ansible playbook, which we could reuse for all further deployments. Let’s see how long will it take to do that.

Configuring SSH Connectivity - 1 minute

Ansible requires SSH connectivity across all the nodes to connect and configure them. We generated a SSH key and manually distributed it across the nodes.

Finding Ansible Playbook - 2 minutes 15 seconds

The main issue here is that there are so many playbooks available out there that it is impossible to decide what’s best. As such, we decided to go with top 3 Google results and try to pick one. We decided on https://github.com/cdelgehier/ansible-role-XtraDB-Cluster as it seems to be more configurable than the remaining ones.

Cloning Repository and Installing Ansible - 30 seconds

This is quick, all we needed was to

apt install ansible git
git clone https://github.com/cdelgehier/ansible-role-XtraDB-Cluster.git

Preparing Inventory File - 1 minute 10 seconds

This step was also very simple, we created an inventory file using example from documentation. We just substituted IP addresses of the nodes to what we have configured in our environment.

Preparing a Playbook - 1 minute 45 seconds

We decided to use the most extensive example from the documentation, which includes also a bit of the configuration tuning. We prepared a correct structure for the Ansible (there was no such information in the documentation):

/root/pxcansible/
├── inventory
├── pxcplay.yml
└── roles
    └── ansible-role-XtraDB-Cluster

Then we ran it but immediately we got an error:

root@vagrant:~/pxcansible# ansible-playbook pxcplay.yml
 [WARNING]: provided hosts list is empty, only localhost is available

ERROR! no action detected in task

The error appears to have been in '/root/pxcansible/roles/ansible-role-XtraDB-Cluster/tasks/main.yml': line 28, column 3, but may
be elsewhere in the file depending on the exact syntax problem.

The offending line appears to be:


- name: "Include {{ ansible_distribution }} tasks"
  ^ here
We could be wrong, but this one looks like it might be an issue with
missing quotes.  Always quote template expression brackets when they
start a value. For instance:

    with_items:
      - {{ foo }}

Should be written as:

    with_items:
      - "{{ foo }}"

This took 1 minute and 45 seconds.

Fixing the Playbook Syntax Issue - 3 minutes 25 seconds

The error was misleading but the general rule of thumb is to try more recent Ansible version, which we did. We googled and found good instructions on Ansible website. Next attempt to run the playbook also failed:

TASK [ansible-role-XtraDB-Cluster : Delete anonymous connections] *****************************************************************************************************************************************************************************************************************
fatal: [node2]: FAILED! => {"changed": false, "msg": "The PyMySQL (Python 2.7 and Python 3.X) or MySQL-python (Python 2.X) module is required."}
fatal: [node3]: FAILED! => {"changed": false, "msg": "The PyMySQL (Python 2.7 and Python 3.X) or MySQL-python (Python 2.X) module is required."}
fatal: [node1]: FAILED! => {"changed": false, "msg": "The PyMySQL (Python 2.7 and Python 3.X) or MySQL-python (Python 2.X) module is required."}

Setting up new Ansible version and running the playbook up to this error took 3 minutes and 25 seconds.

Fixing the Missing Python Module - 3 minutes 20 seconds

Apparently, the role we used did not take care of its prerequisites and a Python module was missing for connecting to and securing the Galera cluster. We first tried to install MySQL-python via pip but it became apparent that it will take more time as it required mysql_config:

root@vagrant:~# pip install MySQL-python
Collecting MySQL-python
  Downloading https://files.pythonhosted.org/packages/a5/e9/51b544da85a36a68debe7a7091f068d802fc515a3a202652828c73453cad/MySQL-python-1.2.5.zip (108kB)
    100% |████████████████████████████████| 112kB 278kB/s
    Complete output from command python setup.py egg_info:
    sh: 1: mysql_config: not found
    Traceback (most recent call last):
      File "<string>", line 1, in <module>
      File "/tmp/pip-build-zzwUtq/MySQL-python/setup.py", line 17, in <module>
        metadata, options = get_config()
      File "/tmp/pip-build-zzwUtq/MySQL-python/setup_posix.py", line 43, in get_config
        libs = mysql_config("libs_r")
      File "/tmp/pip-build-zzwUtq/MySQL-python/setup_posix.py", line 25, in mysql_config
        raise EnvironmentError("%s not found" % (mysql_config.path,))
    EnvironmentError: mysql_config not found

    ----------------------------------------
Command "python setup.py egg_info" failed with error code 1 in /tmp/pip-build-zzwUtq/MySQL-python/

That is provided by MySQL development libraries so we would have to install them manually, which was pretty much pointless. We decided to go with PyMySQL, which did not require other packages to install. This brought us to another issue:

TASK [ansible-role-XtraDB-Cluster : Delete anonymous connections] *****************************************************************************************************************************************************************************************************************
fatal: [node3]: FAILED! => {"changed": false, "msg": "unable to connect to database, check login_user and login_password are correct or /root/.my.cnf has the credentials. Exception message: (1698, u\"Access denied for user 'root'@'localhost'\")"}
fatal: [node2]: FAILED! => {"changed": false, "msg": "unable to connect to database, check login_user and login_password are correct or /root/.my.cnf has the credentials. Exception message: (1698, u\"Access denied for user 'root'@'localhost'\")"}
fatal: [node1]: FAILED! => {"changed": false, "msg": "unable to connect to database, check login_user and login_password are correct or /root/.my.cnf has the credentials. Exception message: (1698, u\"Access denied for user 'root'@'localhost'\")"}
    to retry, use: --limit @/root/pxcansible/pxcplay.retry

Up to this point we spent 3 minutes and 20 seconds.

Fixing “Access Denied” Error - 18 minutes 55 seconds

As per error, we did ensure that MySQL config is prepared correctly and that it included correct user and password to connect to the database. This, unfortunately, did not work as expected. We did investigate further and found that the role did not create root user properly, even though it marked the step as completed. We did a short investigation but decided to make the manual fix instead of trying to debug the playbook, which would take way more time than the steps which we did. We just created manually users root@127.0.0.1 and root@localhost with correct passwords. This allowed us to pass this step and onto another error:

TASK [ansible-role-XtraDB-Cluster : Start the master node] ************************************************************************************************************************************************************************************************************************
skipping: [node1]
skipping: [node2]
skipping: [node3]

TASK [ansible-role-XtraDB-Cluster : Create SST user] ******************************************************************************************************************************************************************************************************************************
skipping: [node1]
skipping: [node2]
skipping: [node3]

TASK [ansible-role-XtraDB-Cluster : Start the slave nodes] ************************************************************************************************************************************************************************************************************************
fatal: [node3]: FAILED! => {"changed": false, "msg": "Unable to start service mysql: Job for mysql.service failed because the control process exited with error code. See \"systemctl status mysql.service\" and \"journalctl -xe\" for details.\n"}
fatal: [node2]: FAILED! => {"changed": false, "msg": "Unable to start service mysql: Job for mysql.service failed because the control process exited with error code. See \"systemctl status mysql.service\" and \"journalctl -xe\" for details.\n"}
fatal: [node1]: FAILED! => {"changed": false, "msg": "Unable to start service mysql: Job for mysql.service failed because the control process exited with error code. See \"systemctl status mysql.service\" and \"journalctl -xe\" for details.\n"}
    to retry, use: --limit @/root/pxcansible/pxcplay.retry

For this section we spent 18 minutes and 55 seconds.

Fixing “Start the Slave Nodes” Issue (part 1) - 7 minutes 40 seconds

We tried a couple of things to solve this problem. We tried to specify node using its name, we tried to switch group names, nothing solved the issue. We decided to clean up the environment using the script provided in the documentation and start from scratch. It did not clean it but just made things even worse. After 7 minutes and 40 seconds we decided to wipe out the virtual machines, recreate the environment and start from scratch hoping that when we add the Python dependencies, this will solve our issue.

Fixing “Start the Slave Nodes” Issue (part 2) - 13 minutes 15 seconds

Unfortunately, setting up Python prerequisites did not help at all. We decided to finish the process manually, bootstrapping the first node and then configuring SST user and starting remaining slaves. This completed the “automated” setup and it took us 13 minutes and 15 seconds to debug and then finally accept that it will not work like the playbook designer expected.

Further Debugging - 10 minutes 45 seconds

We did not stop there and decided that we’ll try one more thing. Instead of relying on Ansible variables we just put the IP of one of the nodes as the master node. This solved that part of the problem and we ended up with:

TASK [ansible-role-XtraDB-Cluster : Create SST user] ******************************************************************************************************************************************************************************************************************************
skipping: [node2]
skipping: [node3]
fatal: [node1]: FAILED! => {"changed": false, "msg": "unable to connect to database, check login_user and login_password are correct or /root/.my.cnf has the credentials. Exception message: (1045, u\"Access denied for user 'root'@'::1' (using password: YES)\")"}

This was the end of our attempts - we tried to add this user but it did not work correctly through the ansible playbook while we could use IPv6 localhost address to connect to when using MySQL client.

Total Installation Time - Unknown (Automated Installation Failed)

In total we spent 64 minutes and we still haven’t managed to get things going automatically. The remaining problems are root password creation which doesn’t seem to work and then getting the Galera Cluster started (SST user issue). It is hard to tell how long will it take to debug it further. It is sure possible - it is just hard to quantify because it really depends on the experience with Ansible and MySQL. It is definitely not something anyone can just download, configure and run. Well, maybe another playbook would have worked differently? It is possible, but it may as well result in different issues. Ok, so there is a learning curve to climb and debugging to make but then, when you are all set, you will just run a script. Well, that’s sort of true. As long as changes introduced by the maintainer won’t break something you depend on or new Ansible version will break the playbook or the maintainer will just forget about the project and stop developing it (for the role that we used there’s quite useful pull request waiting already for almost a year, which might be able to solve the Python dependency issue - it has not been merged). Unless you accept that you will have to maintain this code, you cannot really rely on it being 100% accurate and working in your environment, especially given that the original developer has no incentives in keeping the code up to date. Also, what about other versions? You cannot use this particular playbook to install PXC 5.6 or any MariaDB version. Sure, there are other playbooks you can find. Will they work better or maybe you’ll spend another bunch of hours trying to make them to work?

ClusterControl
Single Console for Your Entire Database Infrastructure
Find out what else is new in ClusterControl

ClusterControl

Finally, let’s take a look at how ClusterControl can be used to deploy Percona XtraDB Cluster.

Configuring SSH Connectivity - 1 minute

ClusterControl requires SSH connectivity across all the nodes to connect and configure them. We generated a SSH key and manually distributed it across the nodes.

Setting Up ClusterControl - 3 minutes 15 seconds

Quick search “ClusterControl install” pointed us to relevant ClusterControl documentation page. We were looking for a “simpler way to install ClusterControl” therefore we followed the link and found following instructions.

Downloading the script and running it took 3 minutes and 15 seconds, we had to take some actions while installation proceeded so it is not unattended installation.

Logging Into UI and Deployment Start - 1 minute 10 seconds

We pointed our browser to the IP of ClusterControl node.

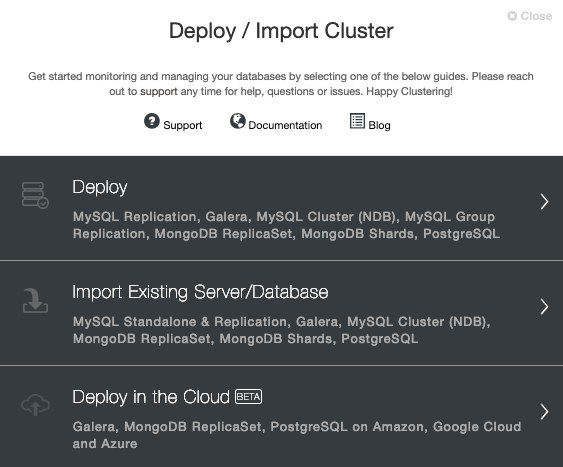
We passed the required contact information and we were presented with the Welcome screen:

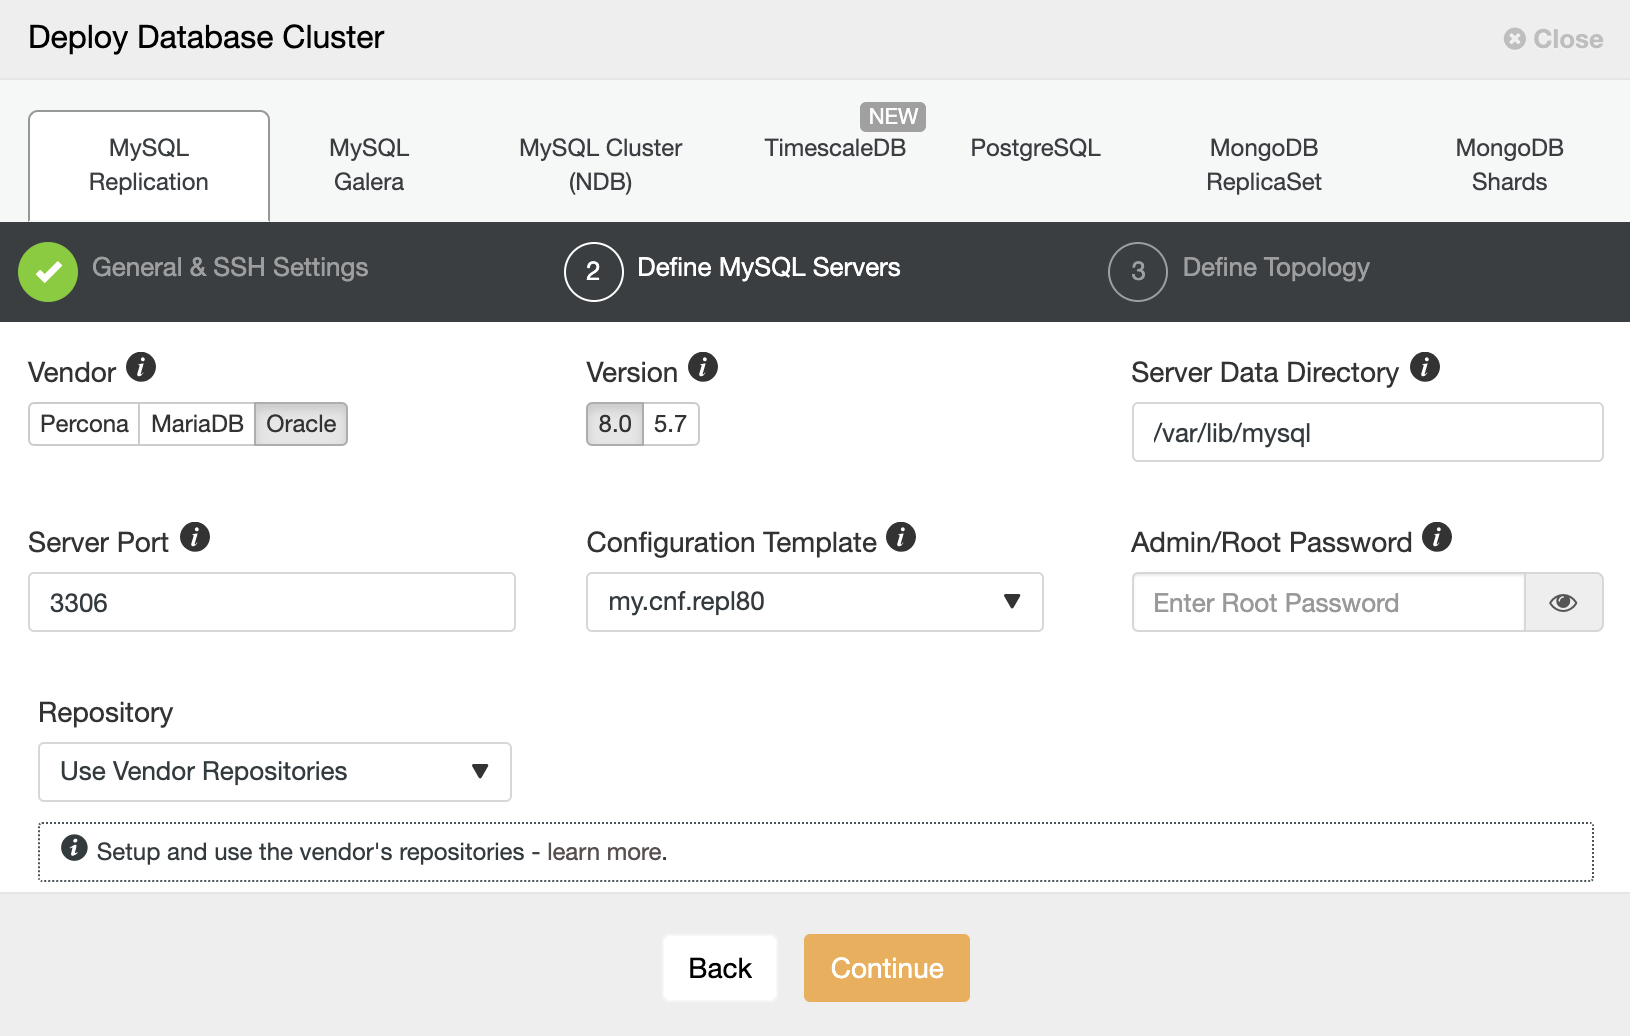
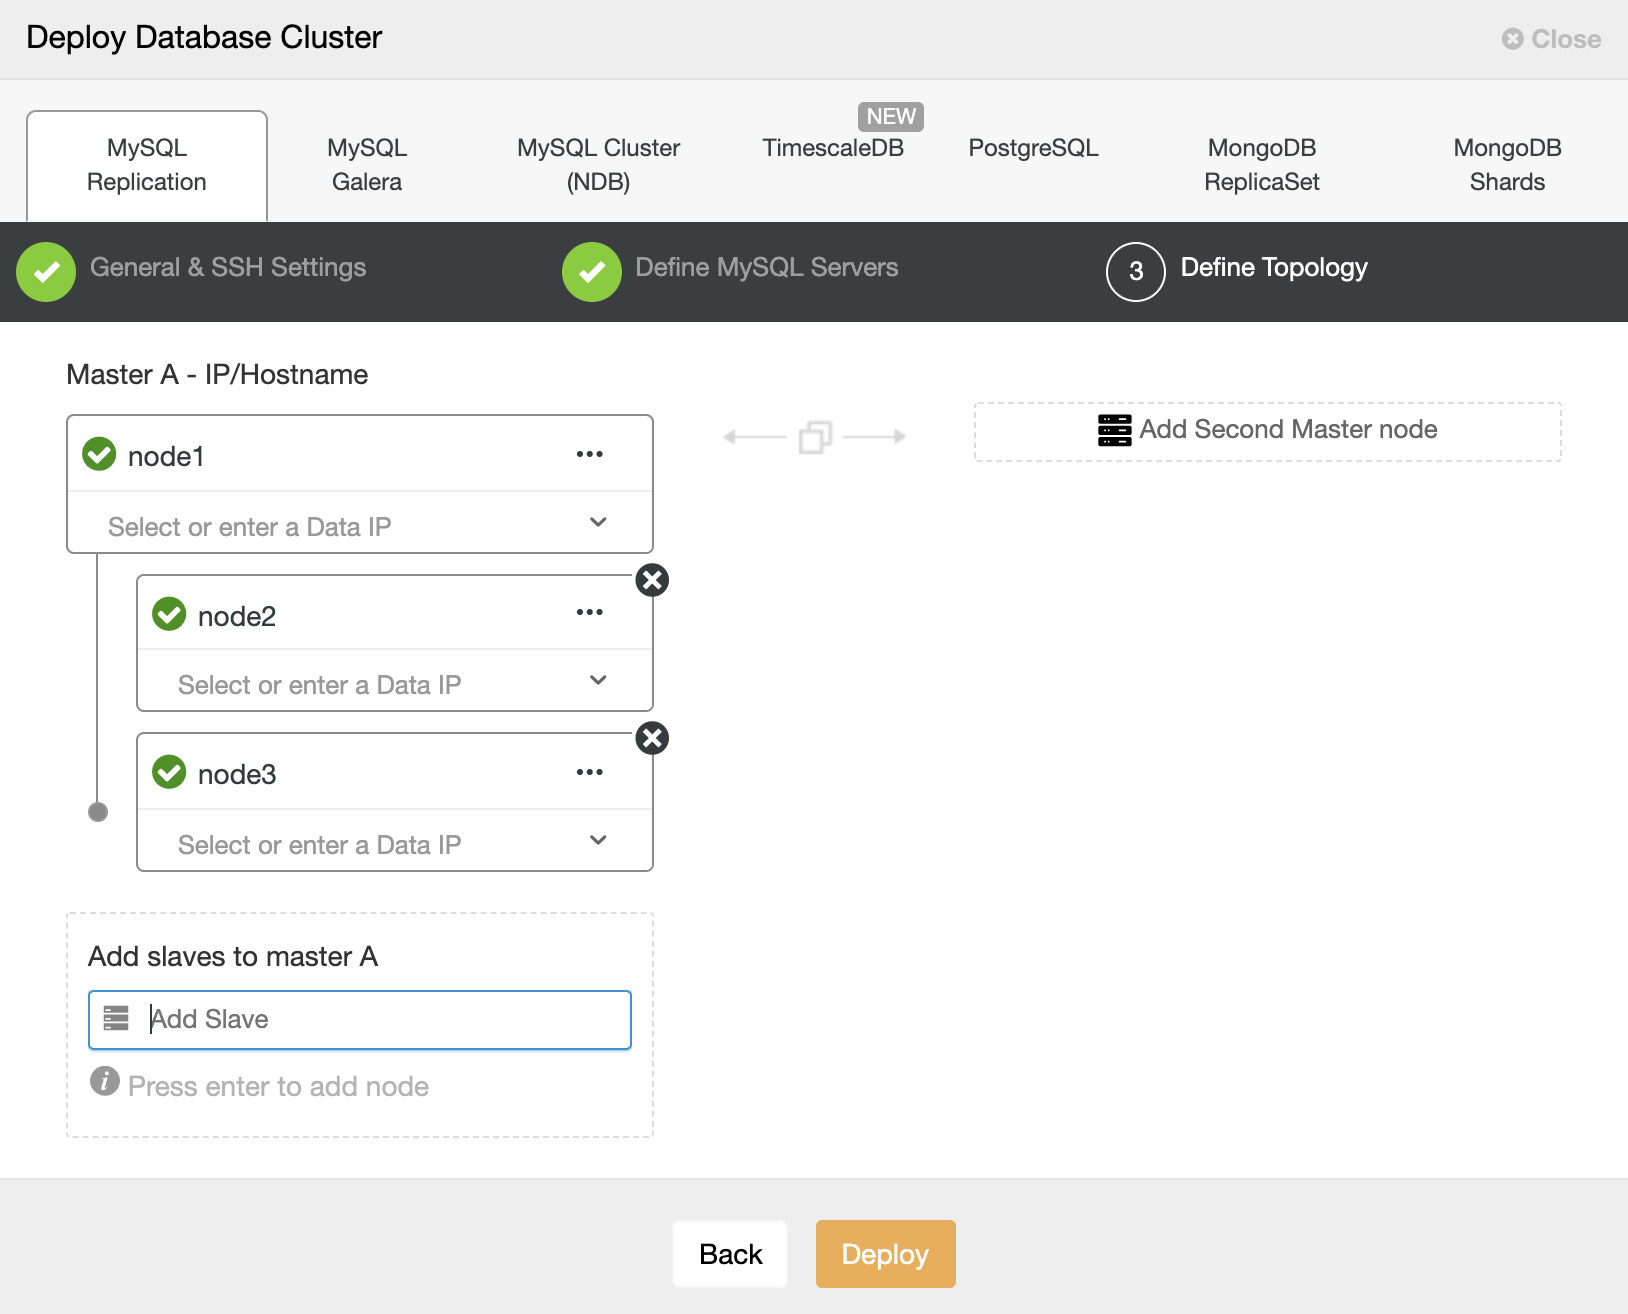
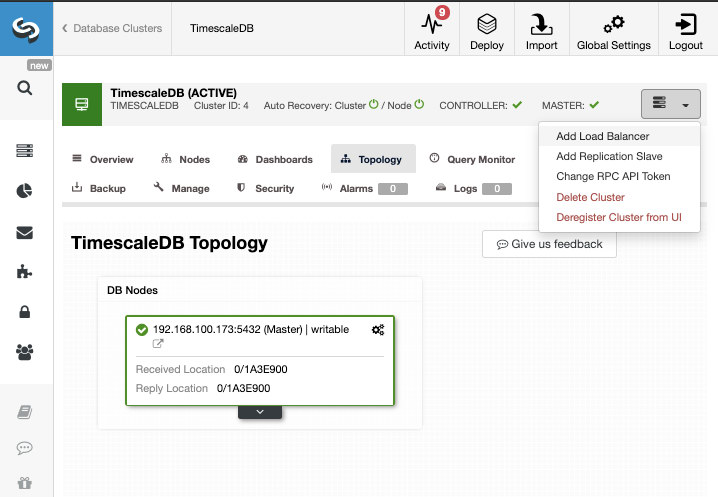
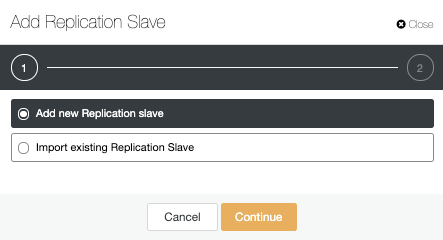
Next step - we picked the deployment option.

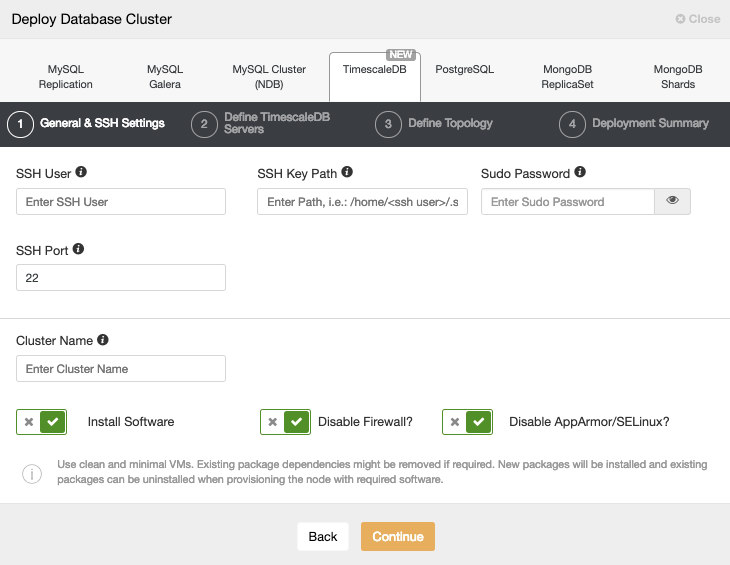
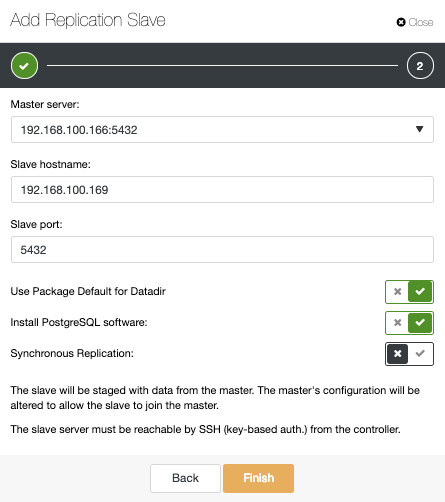
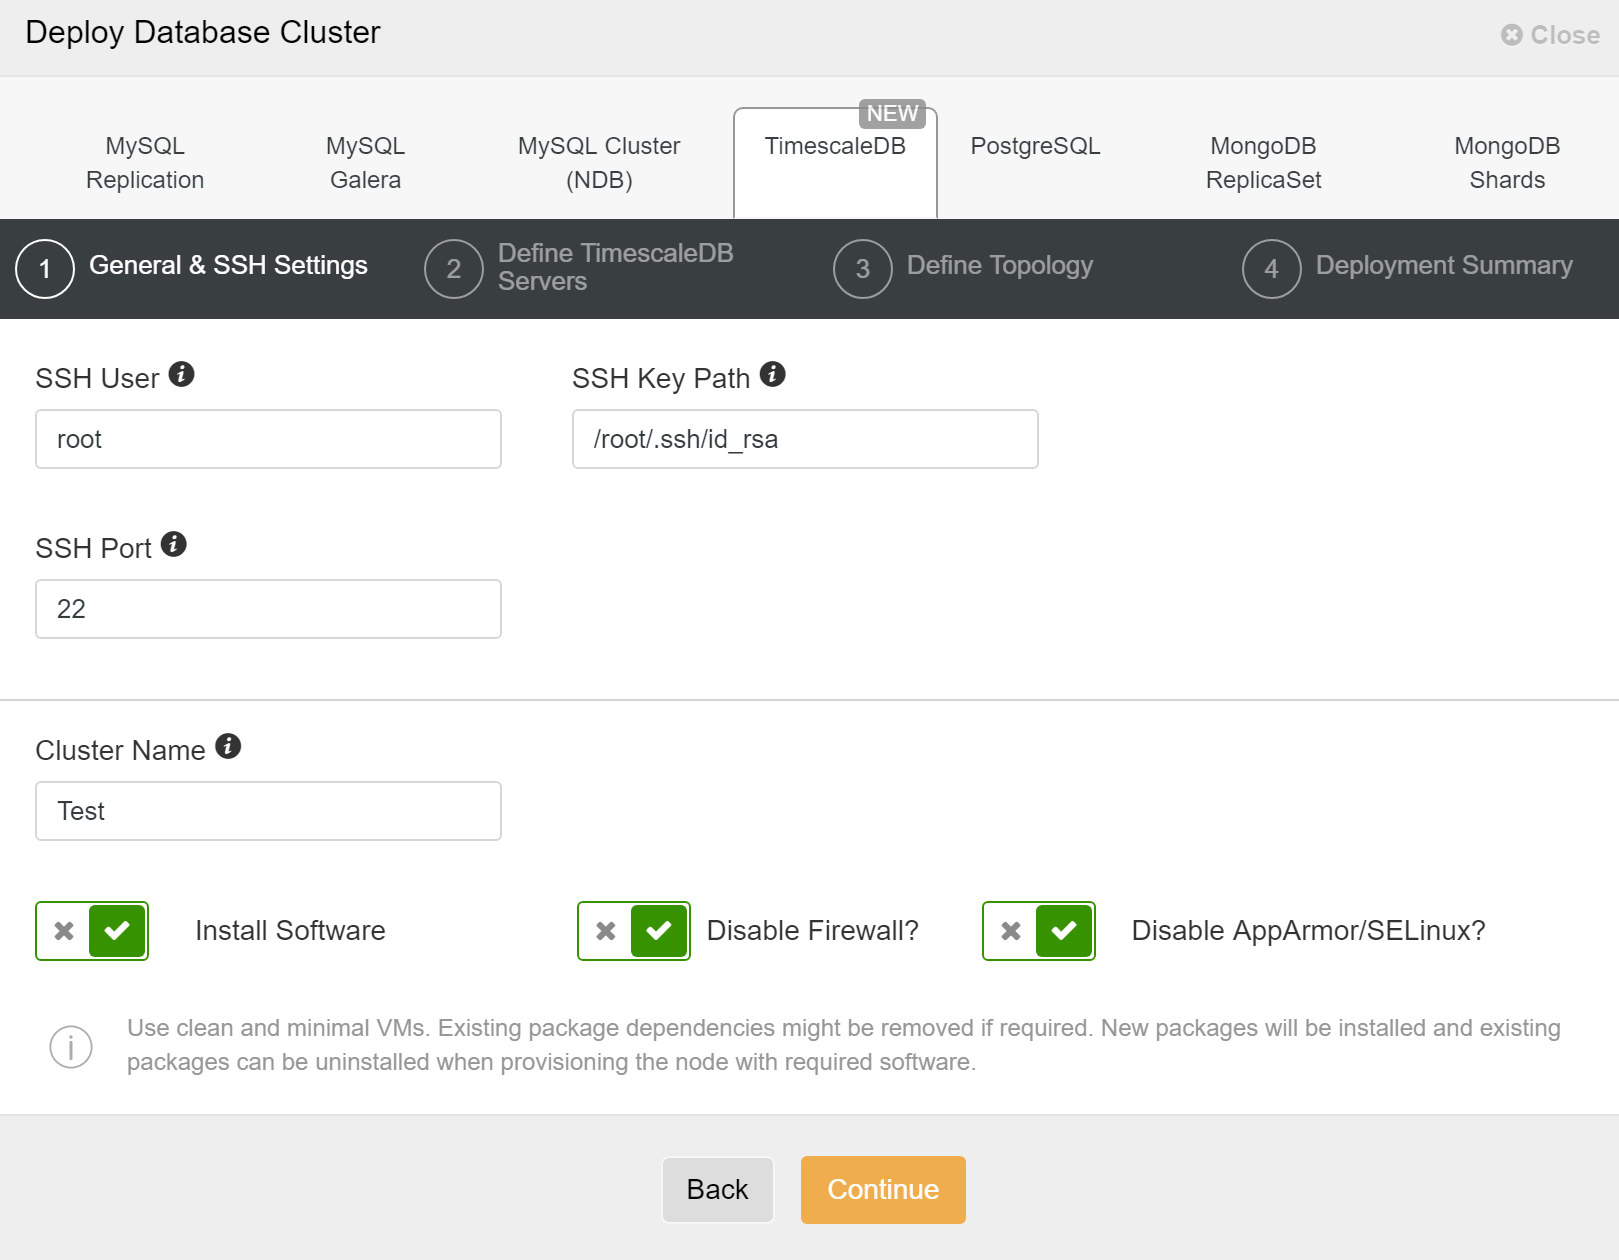
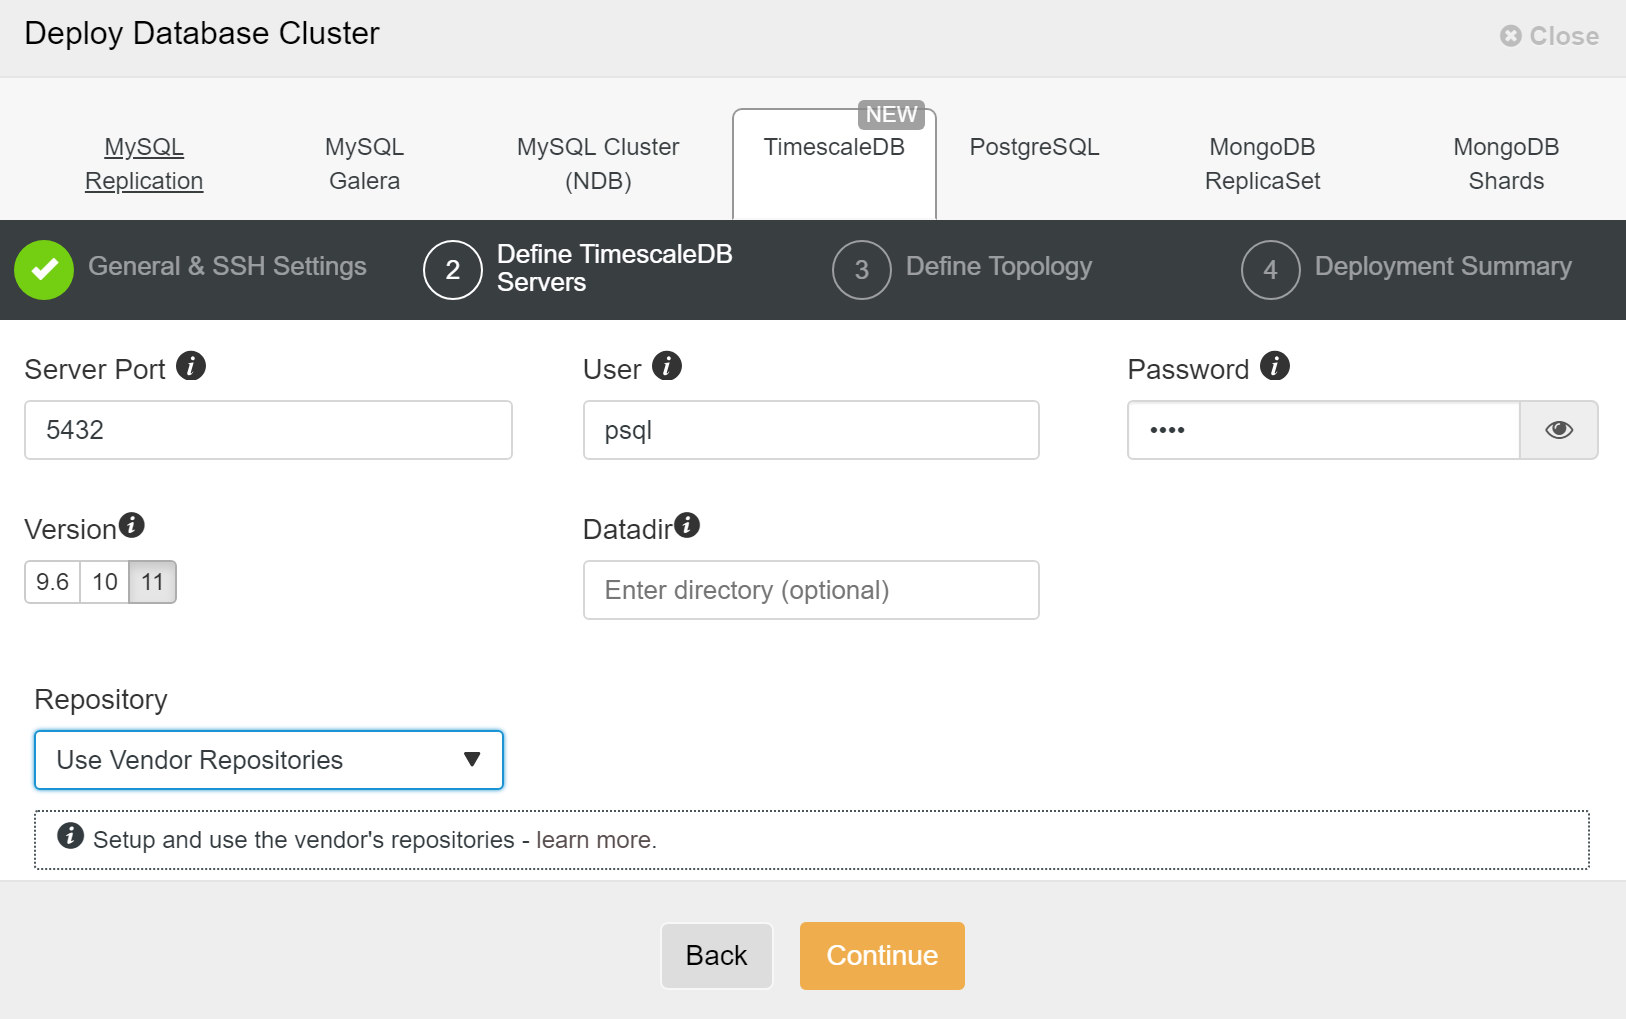
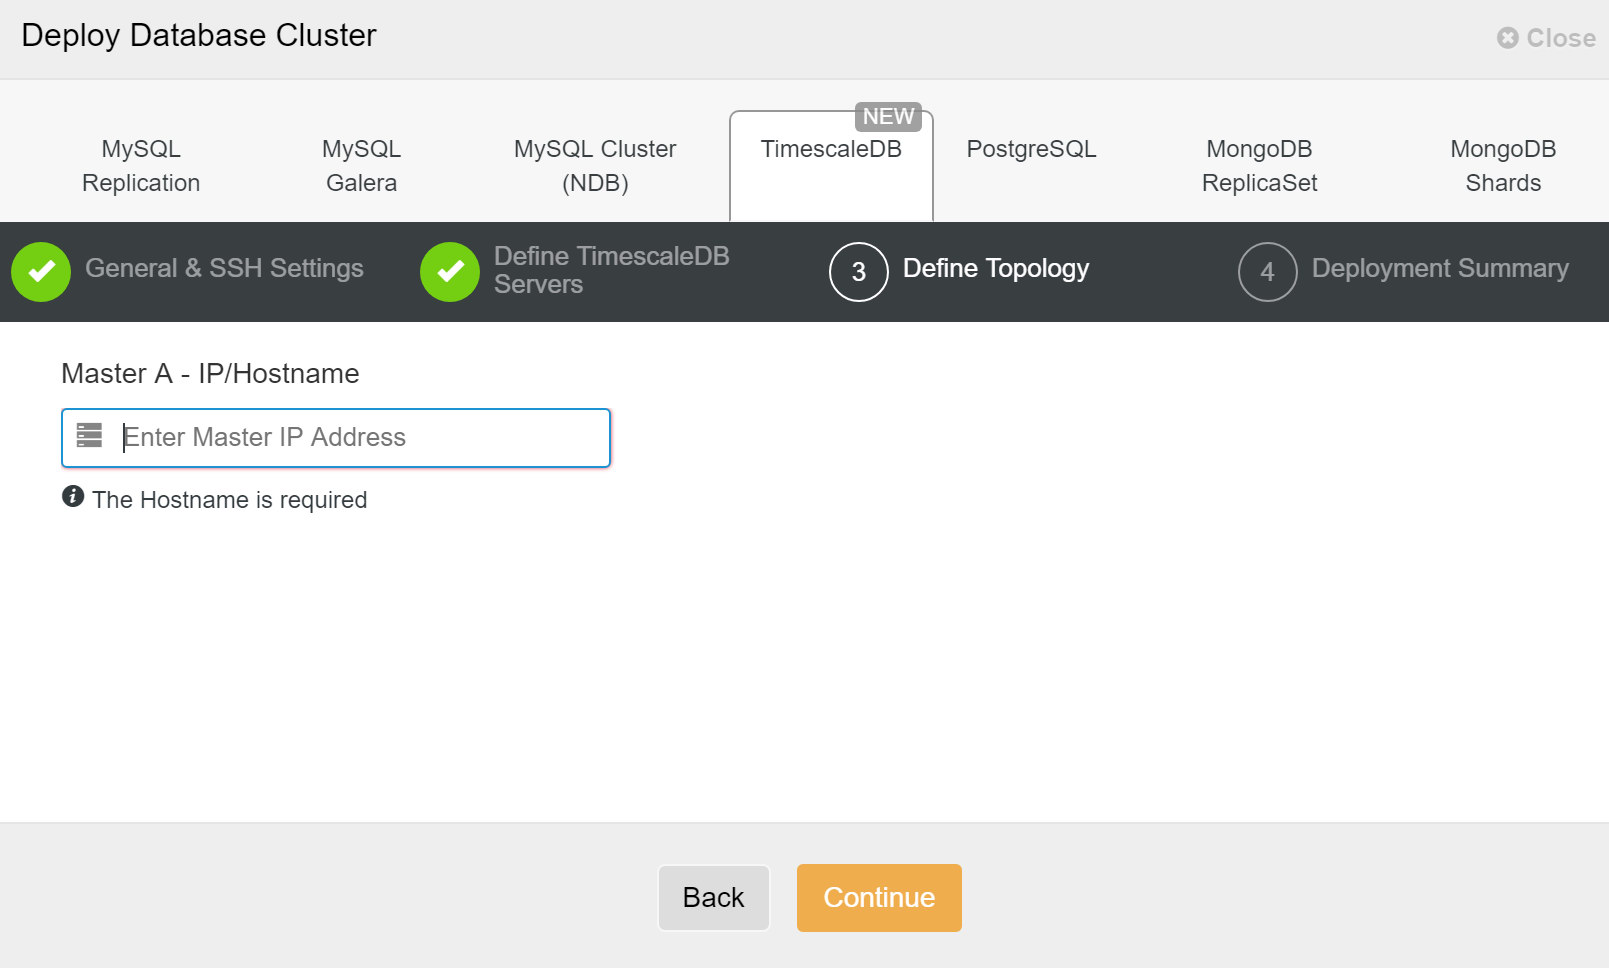
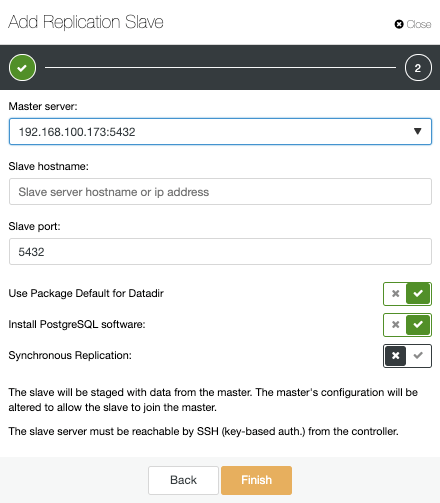
We had to pass SSH connectivity details.

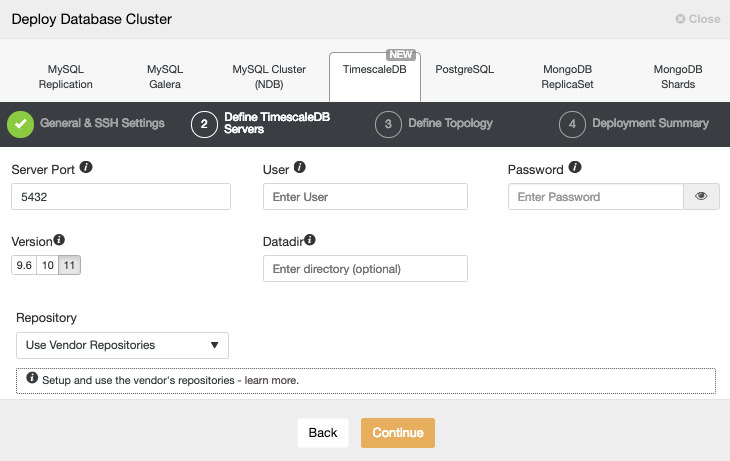
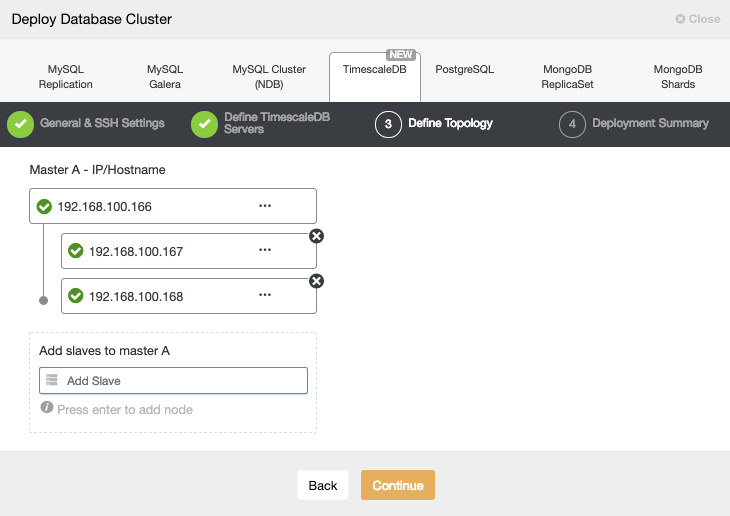
We also decided on the vendor, version, password and hosts to use. This whole process took 1 minute and 10 seconds.

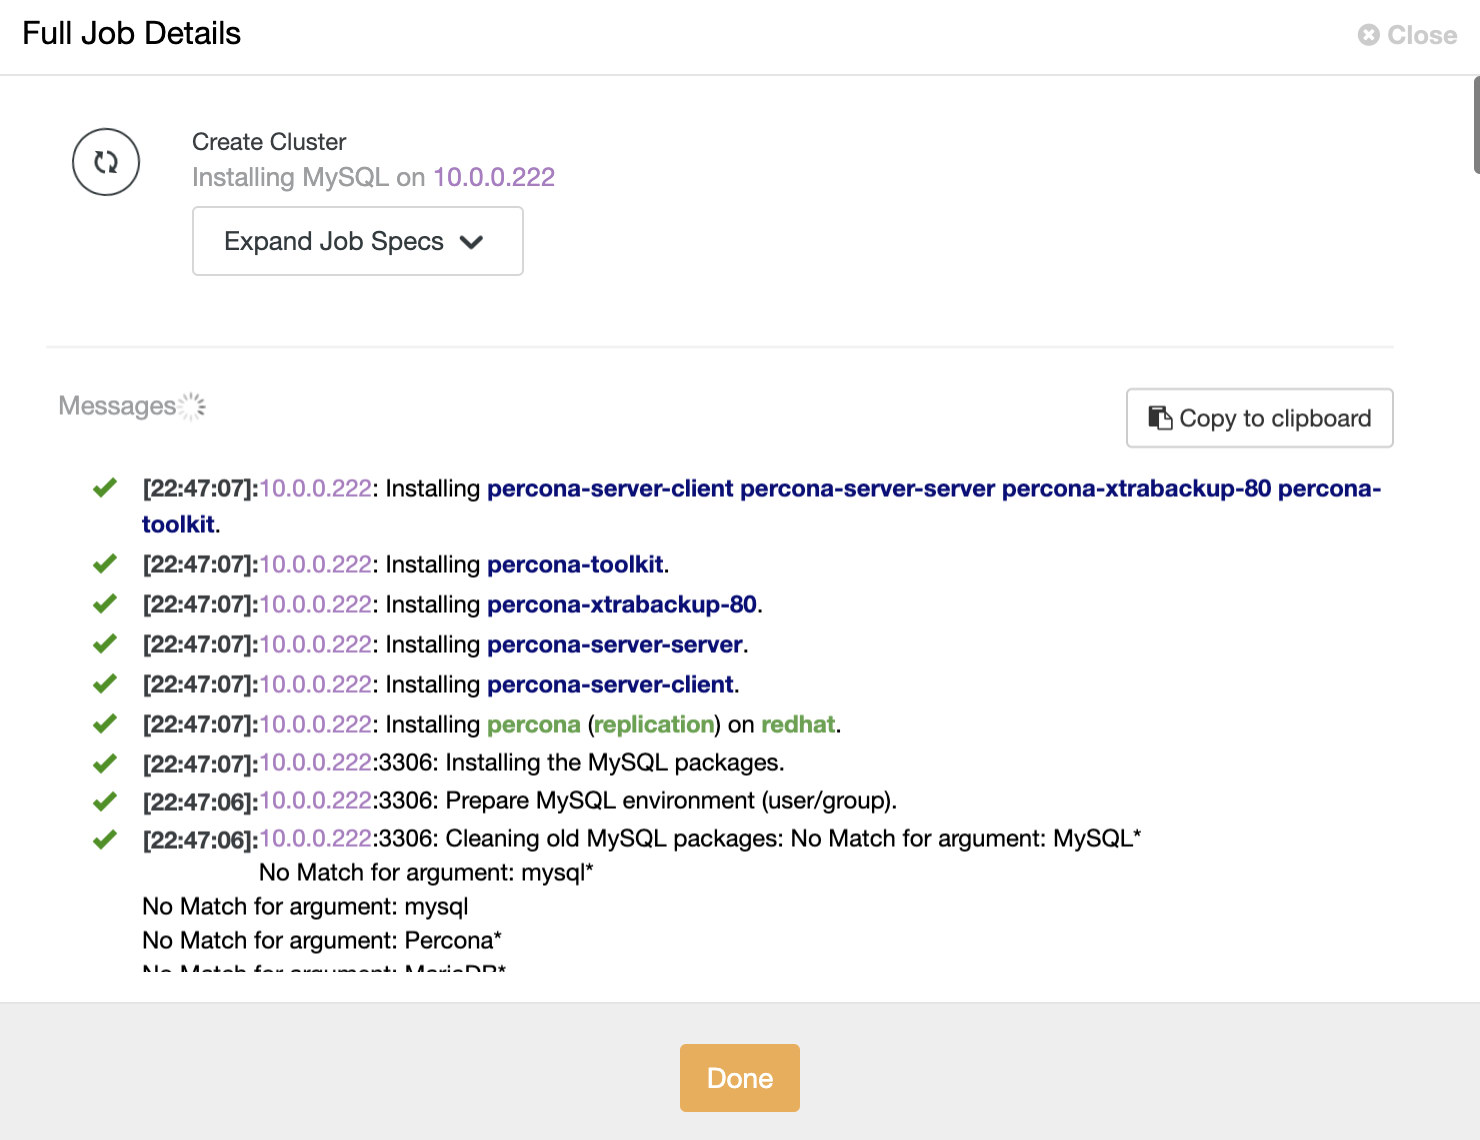
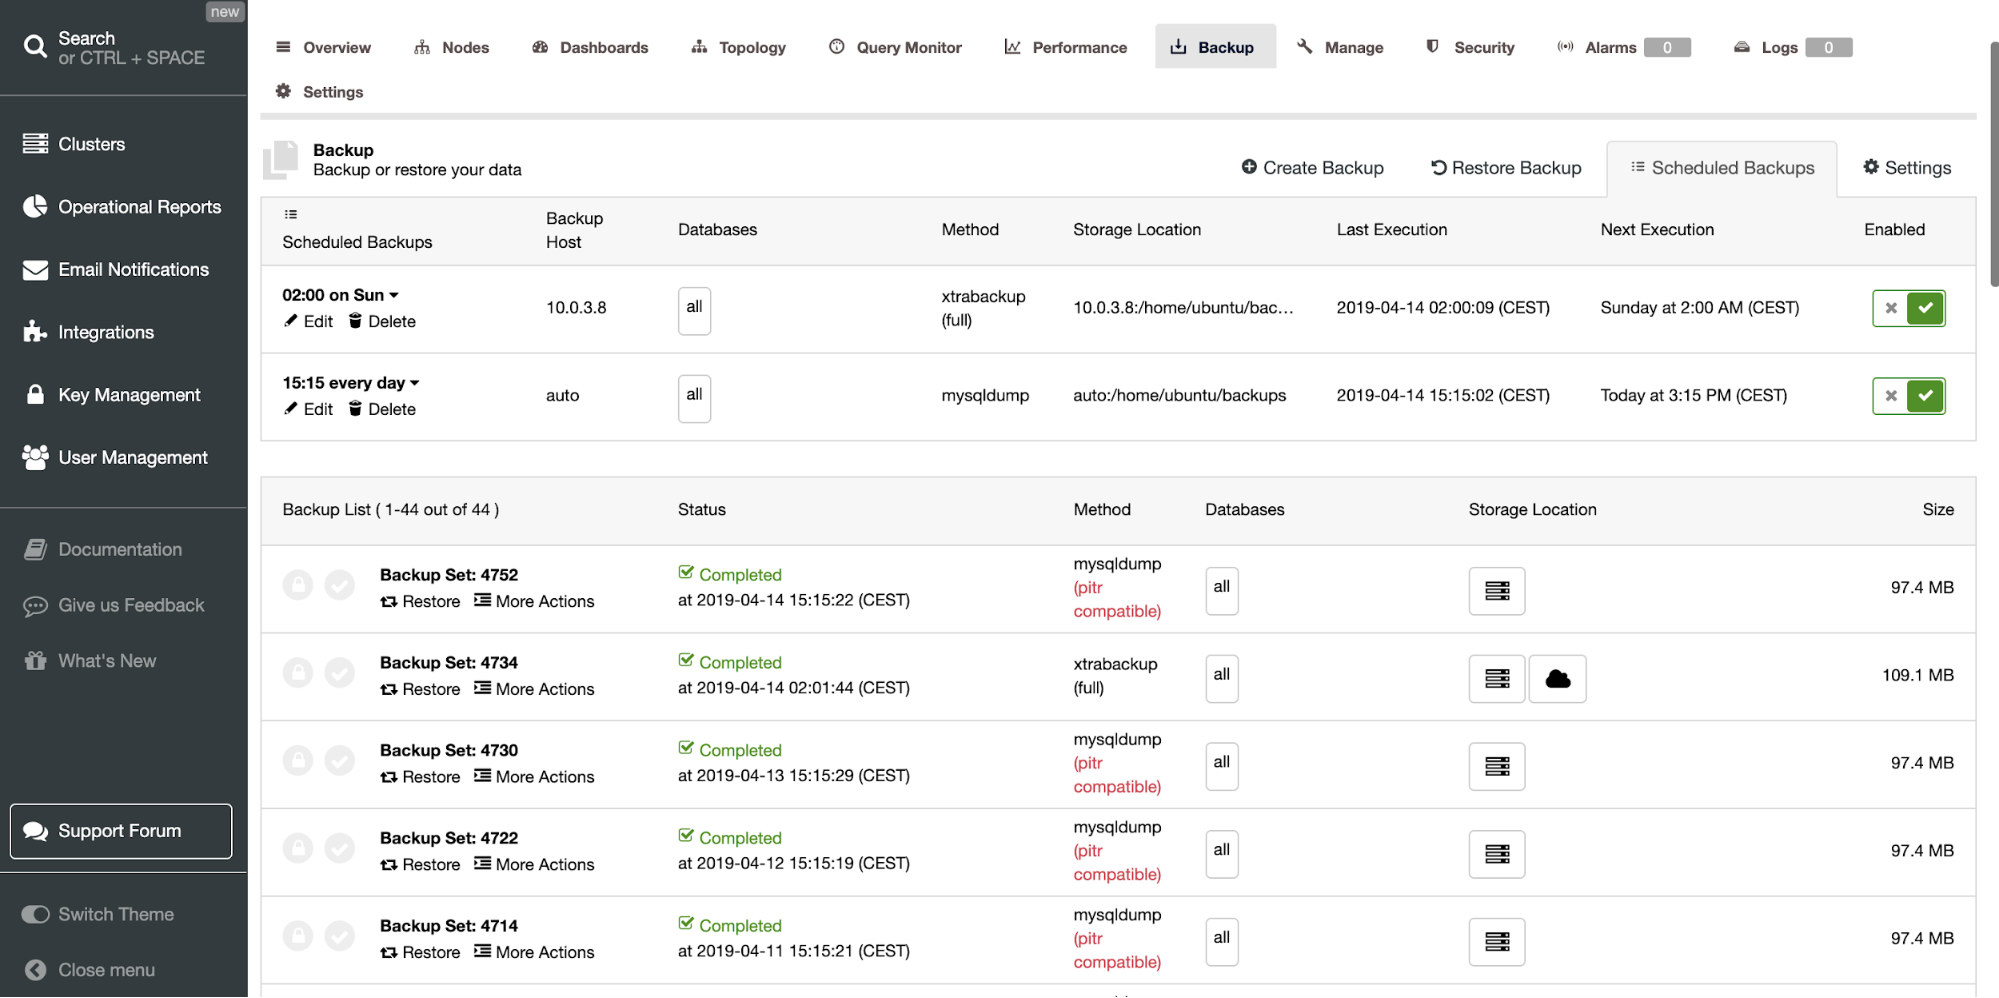
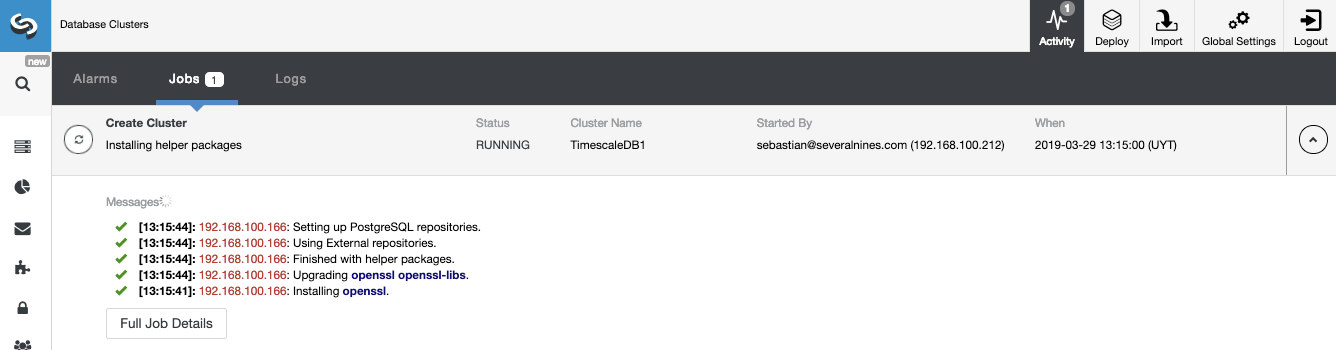
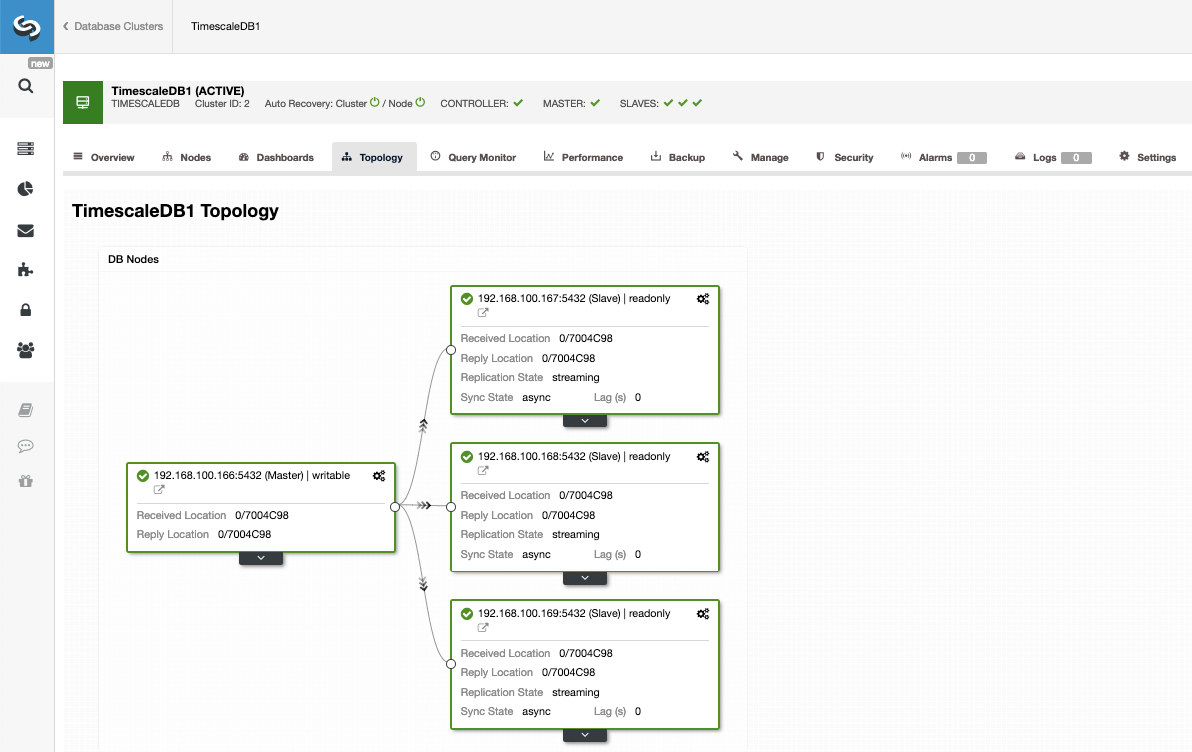
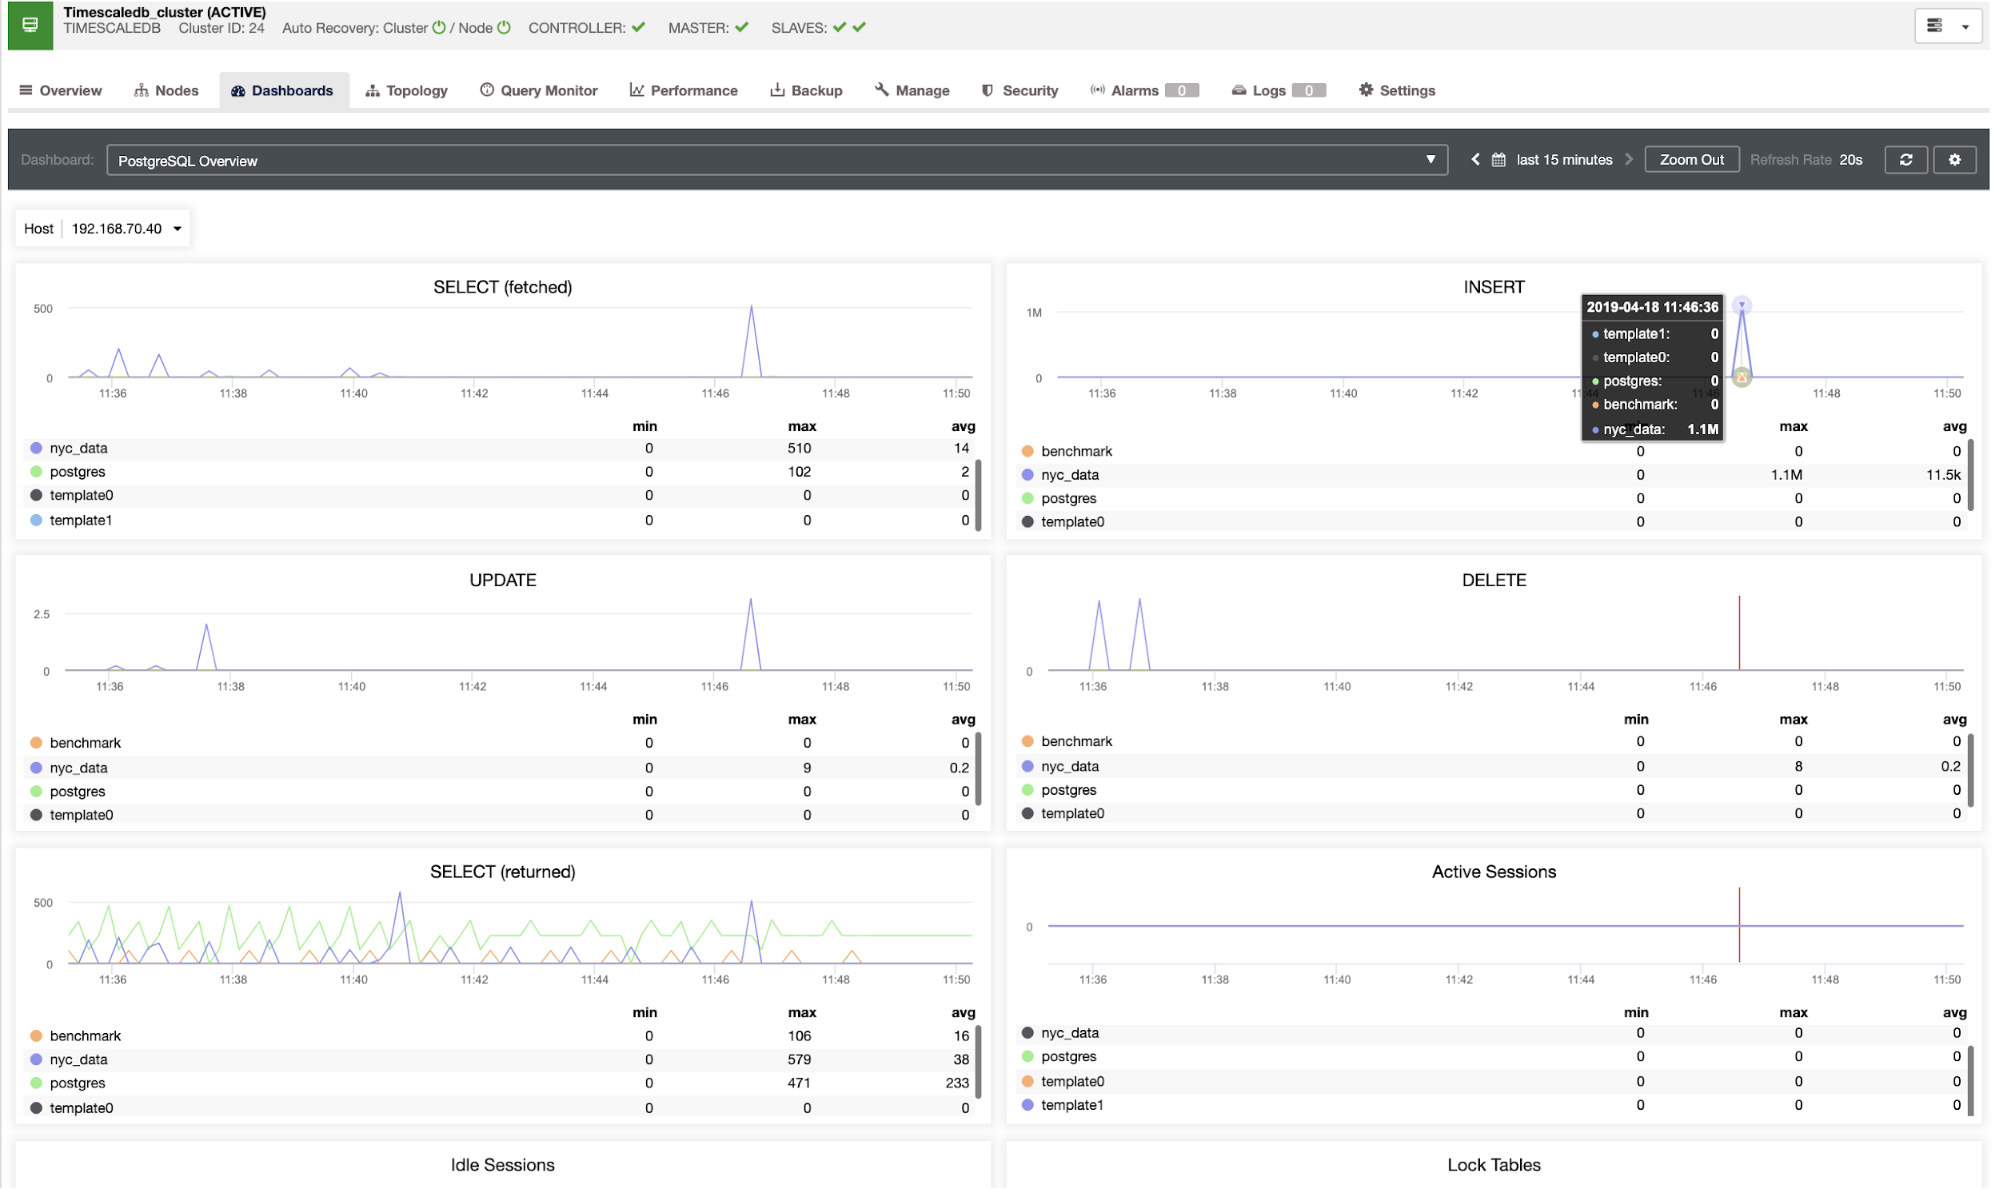
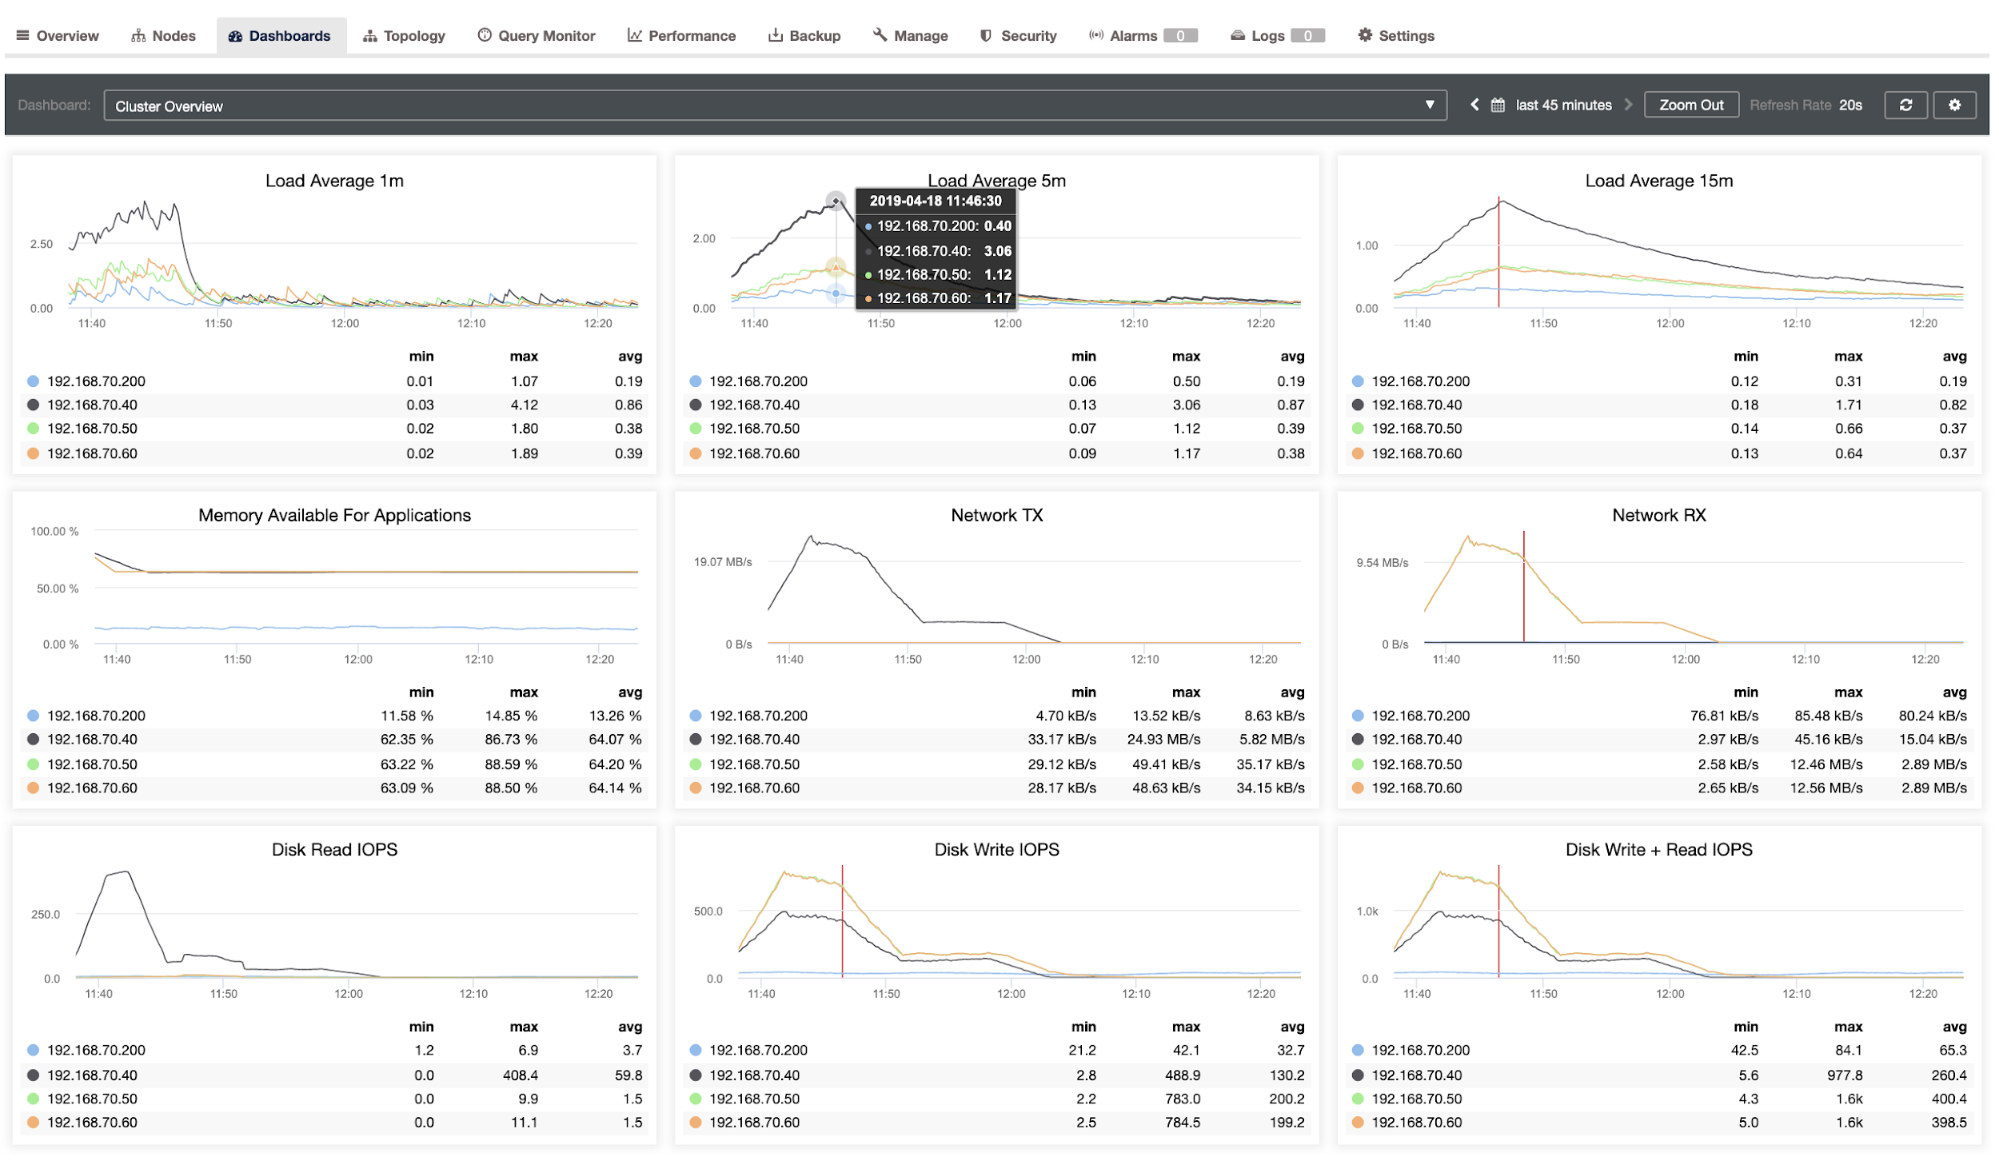
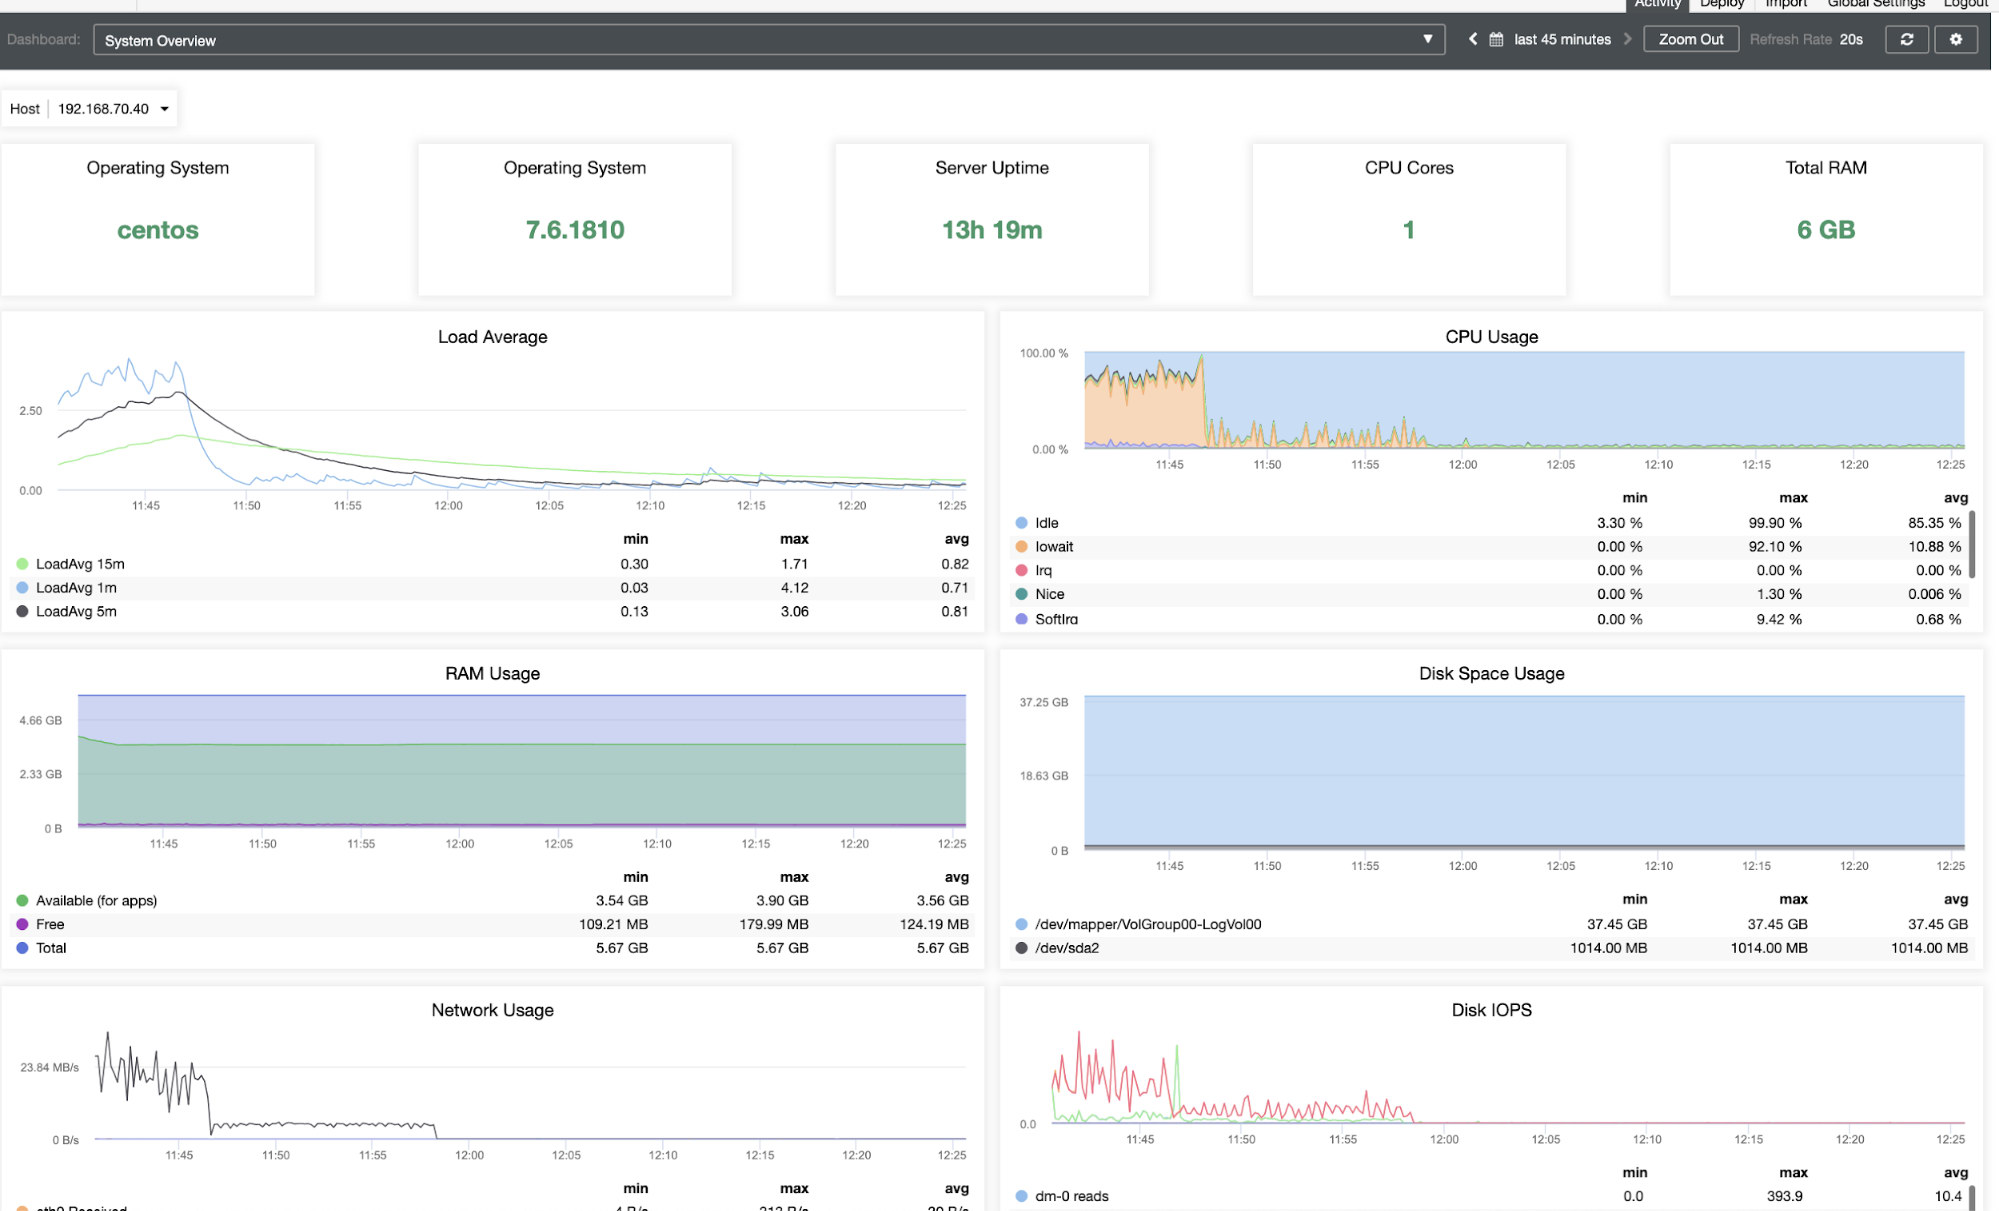
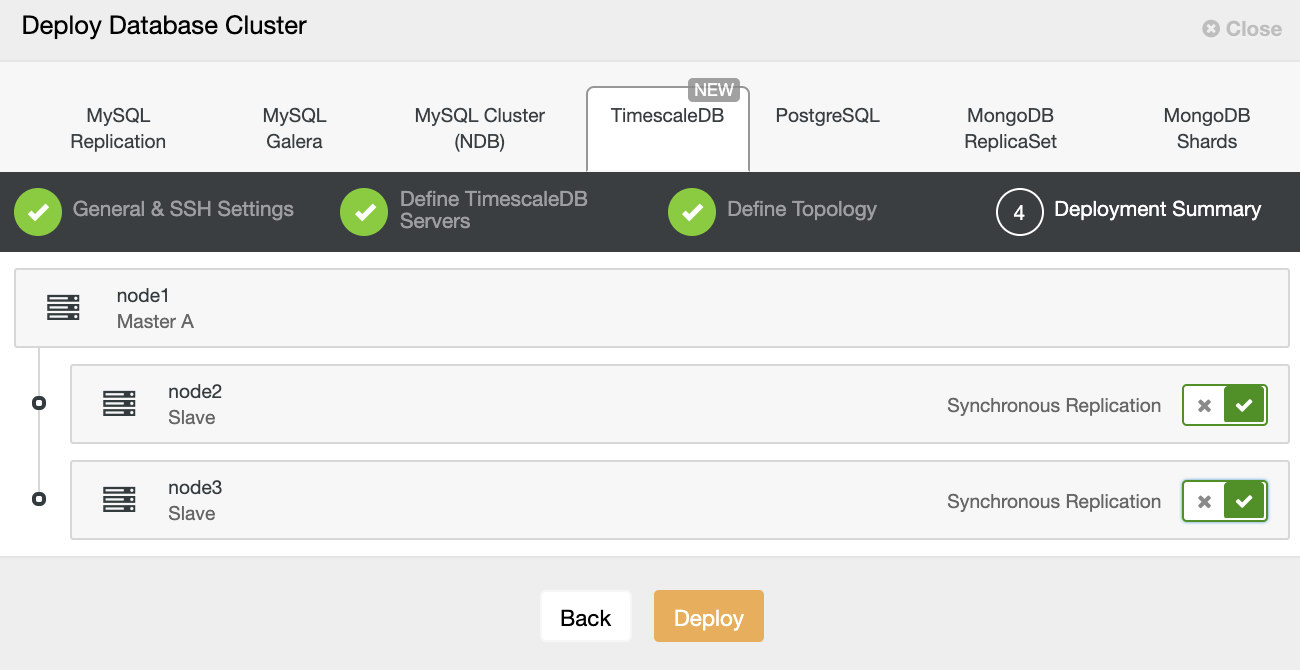
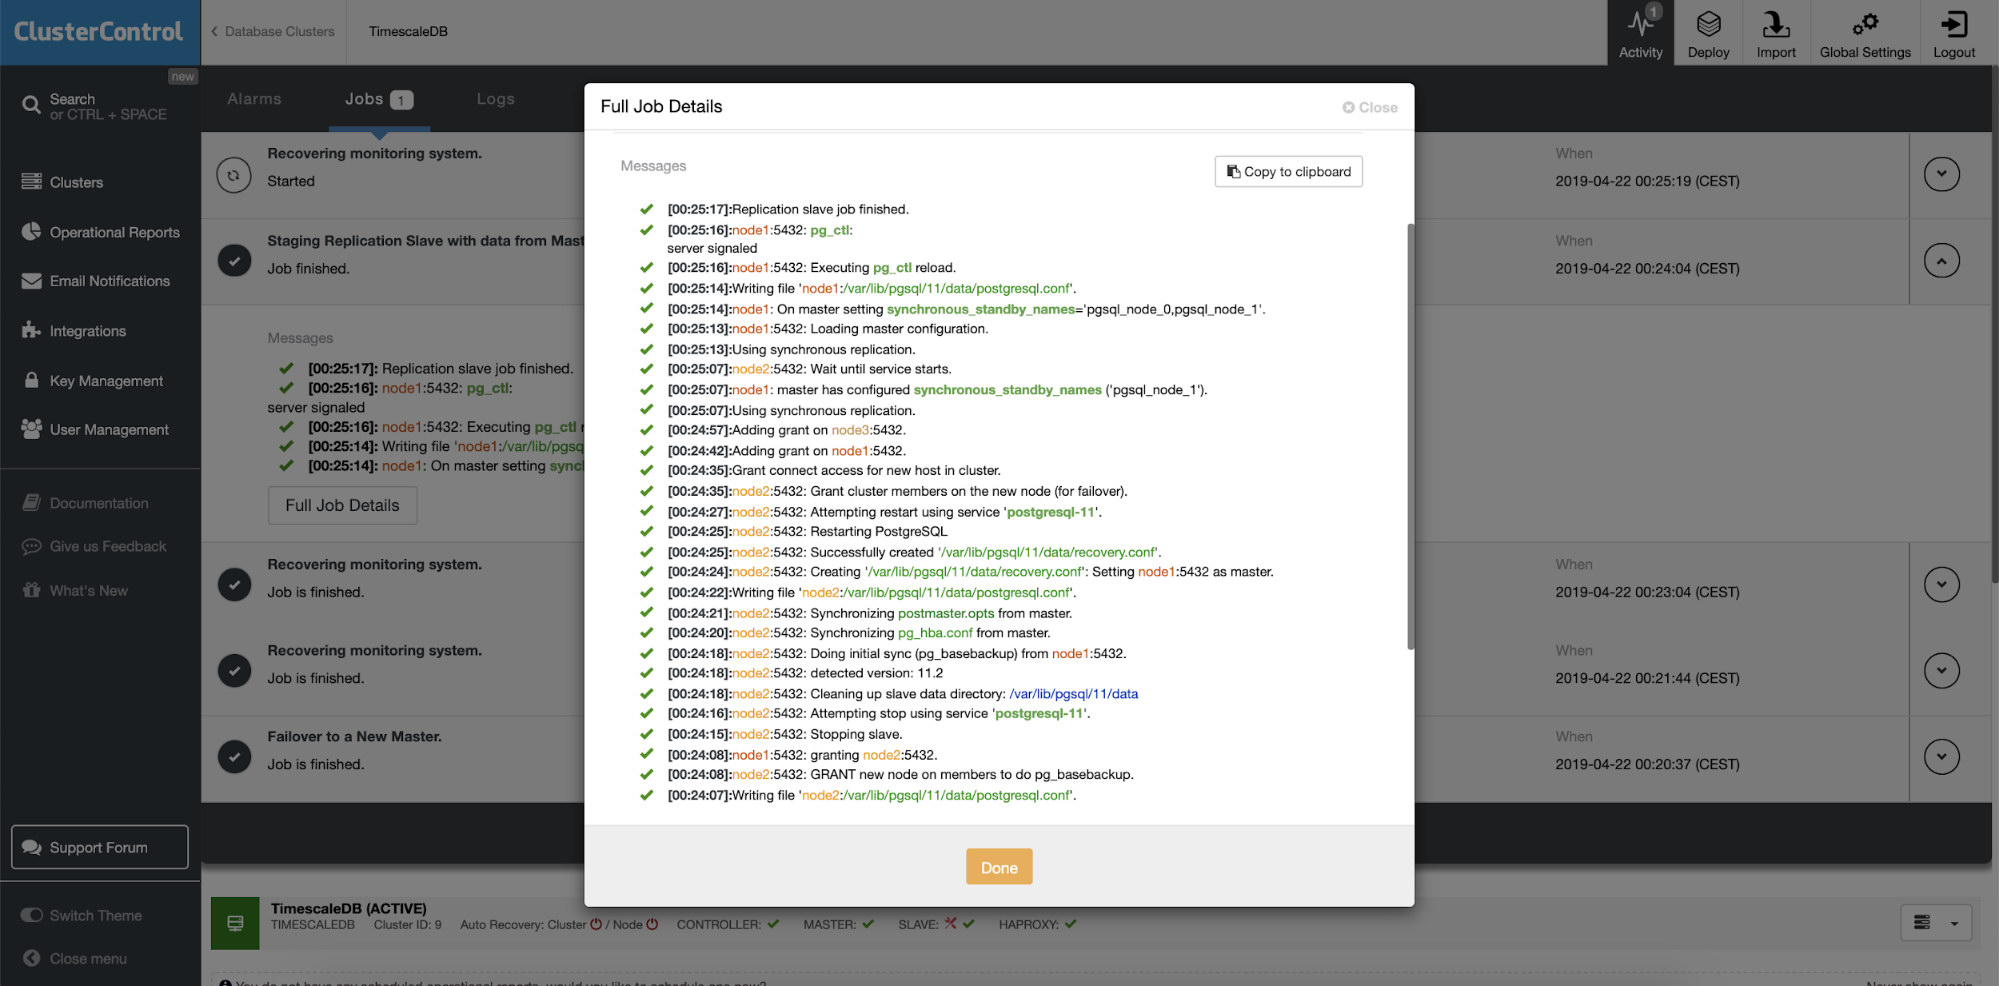
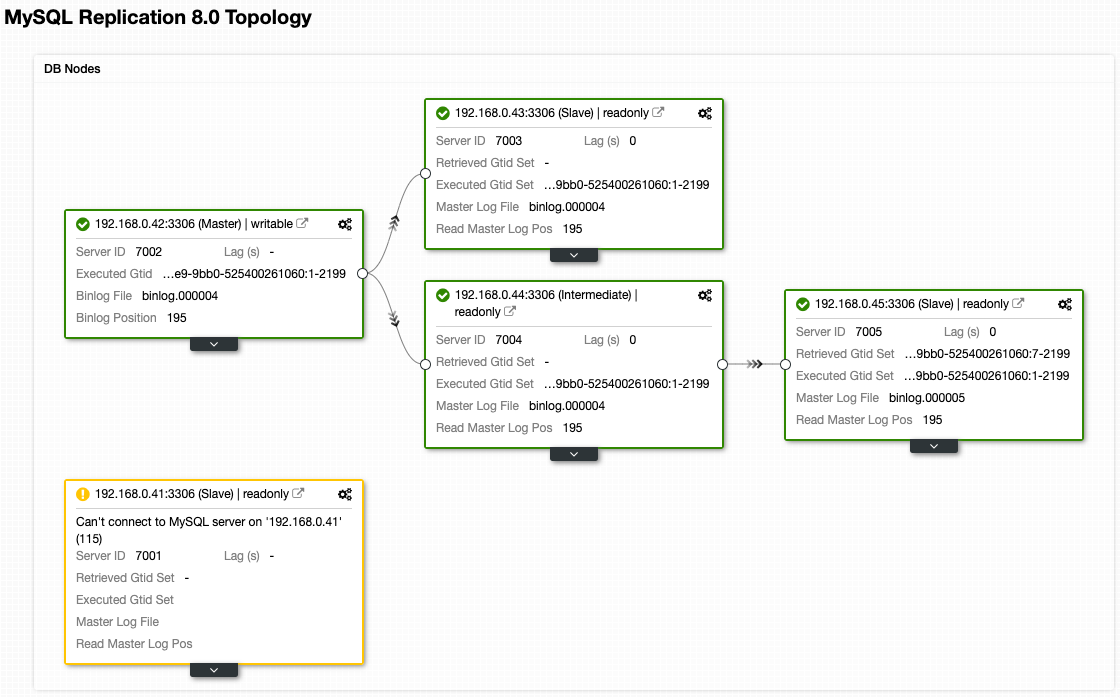
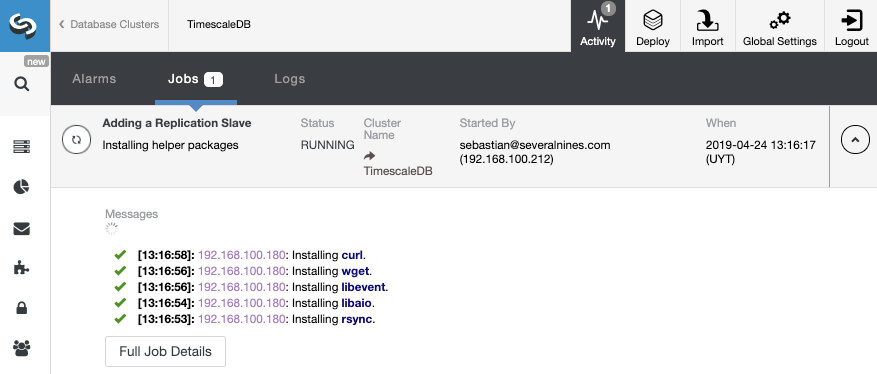
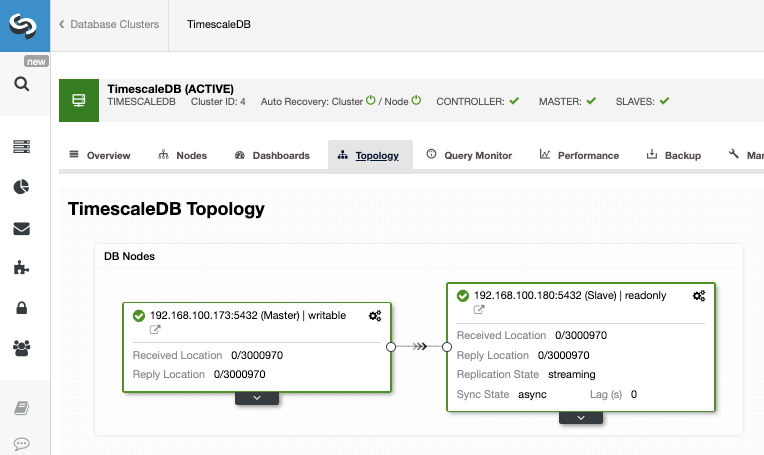
Percona XtraDB Cluster Deployment - 12 minutes 5 seconds

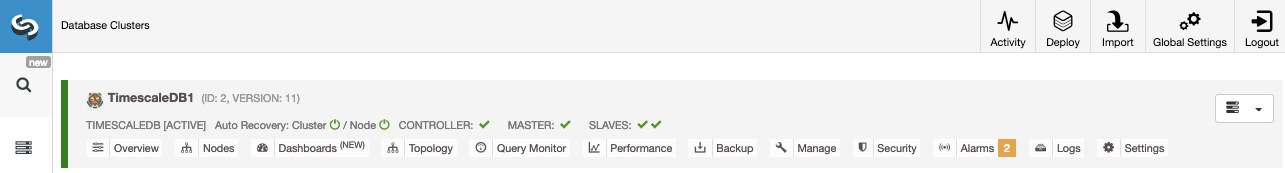
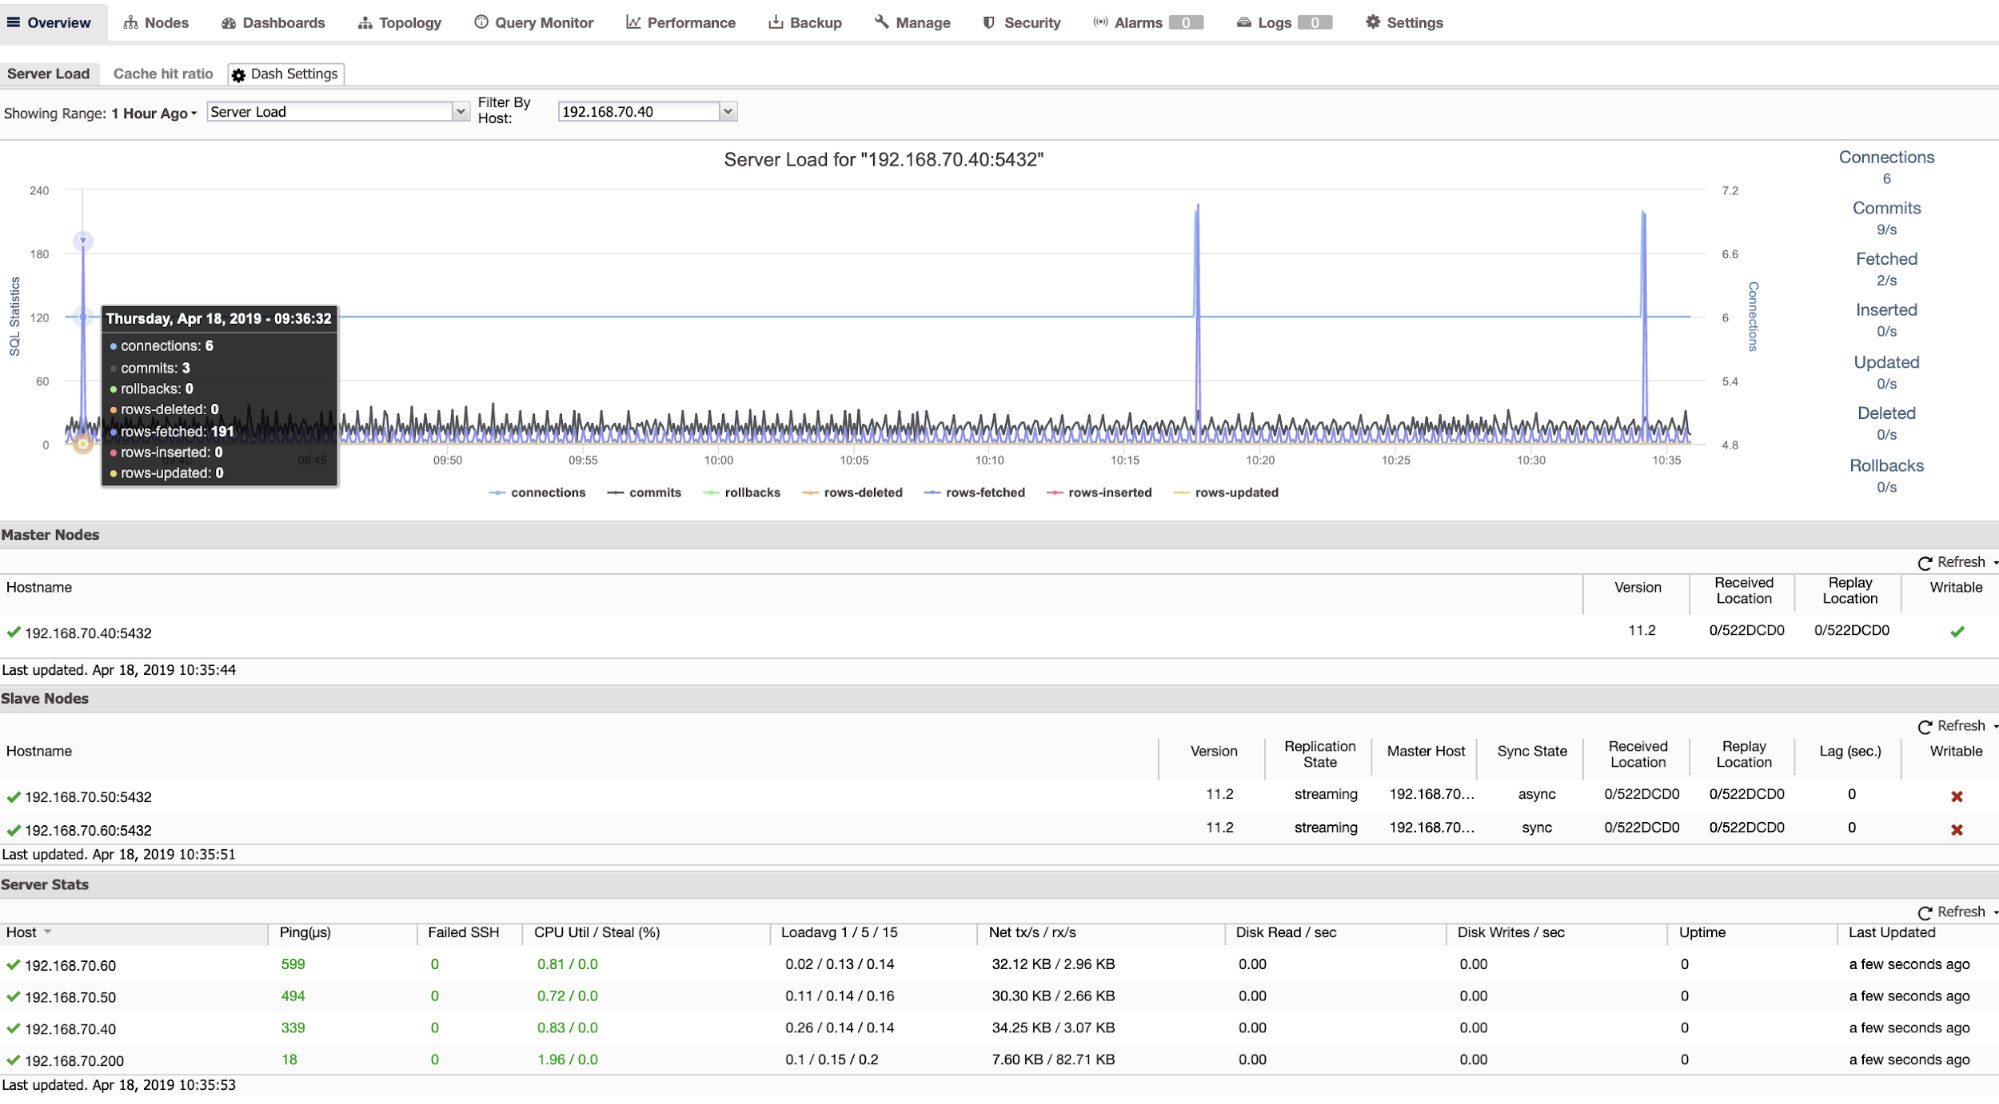
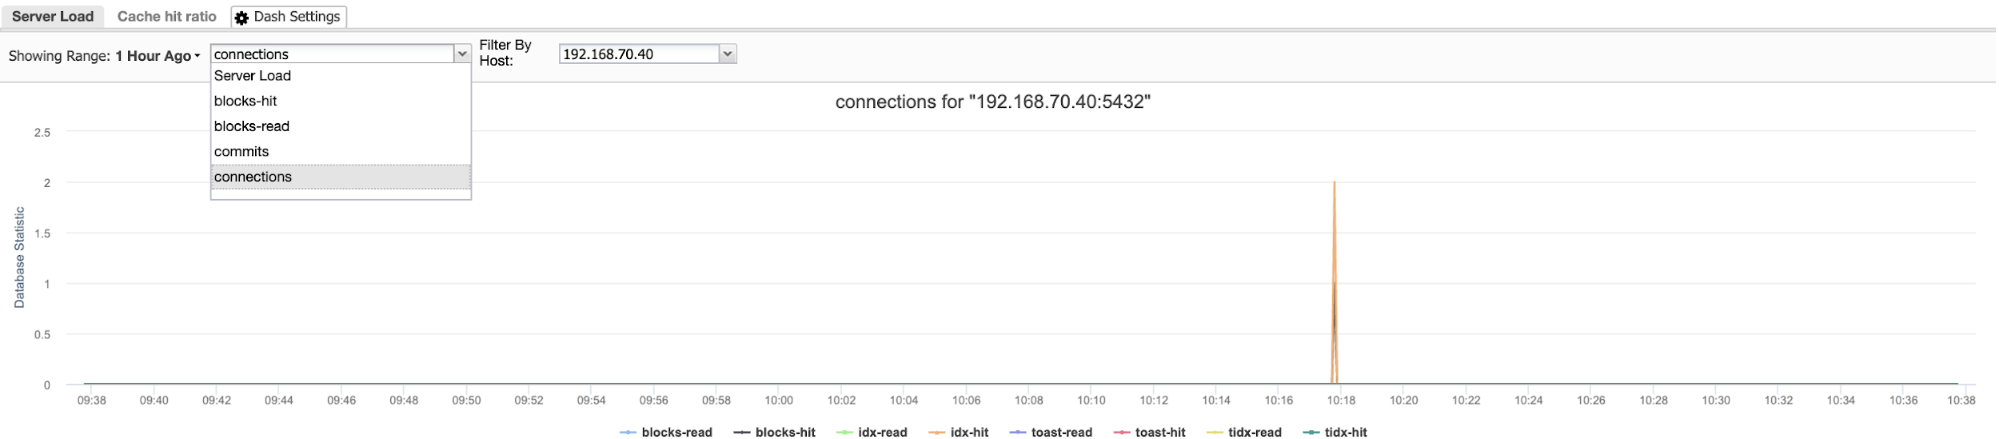
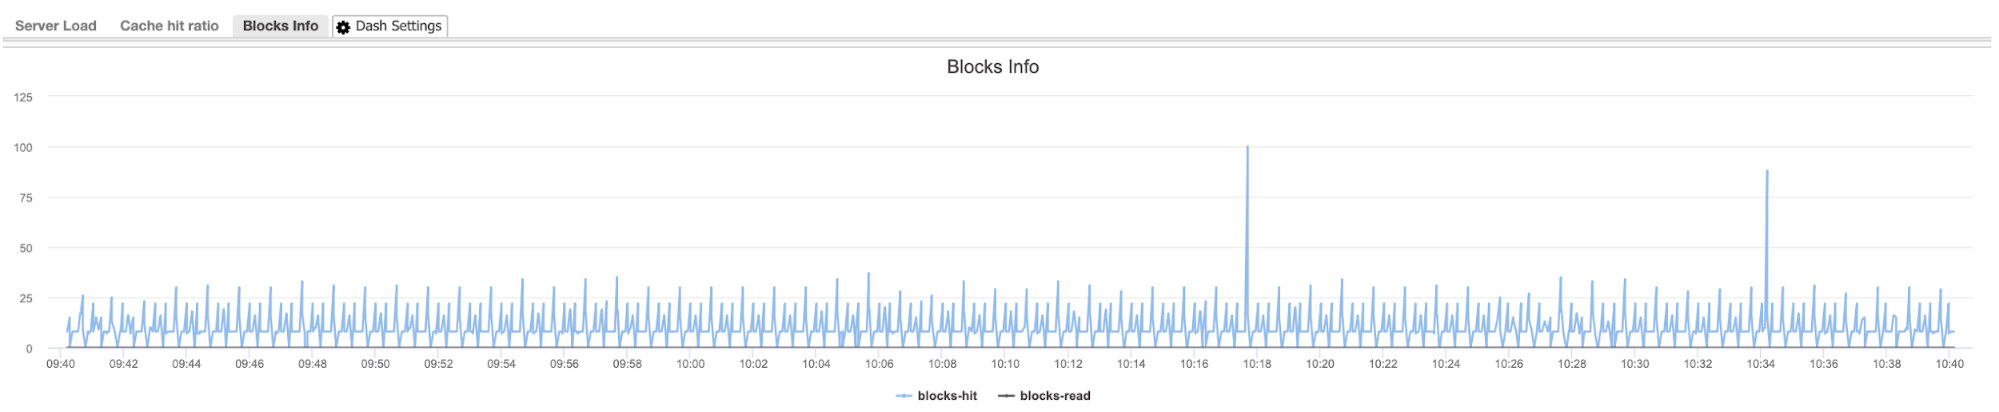
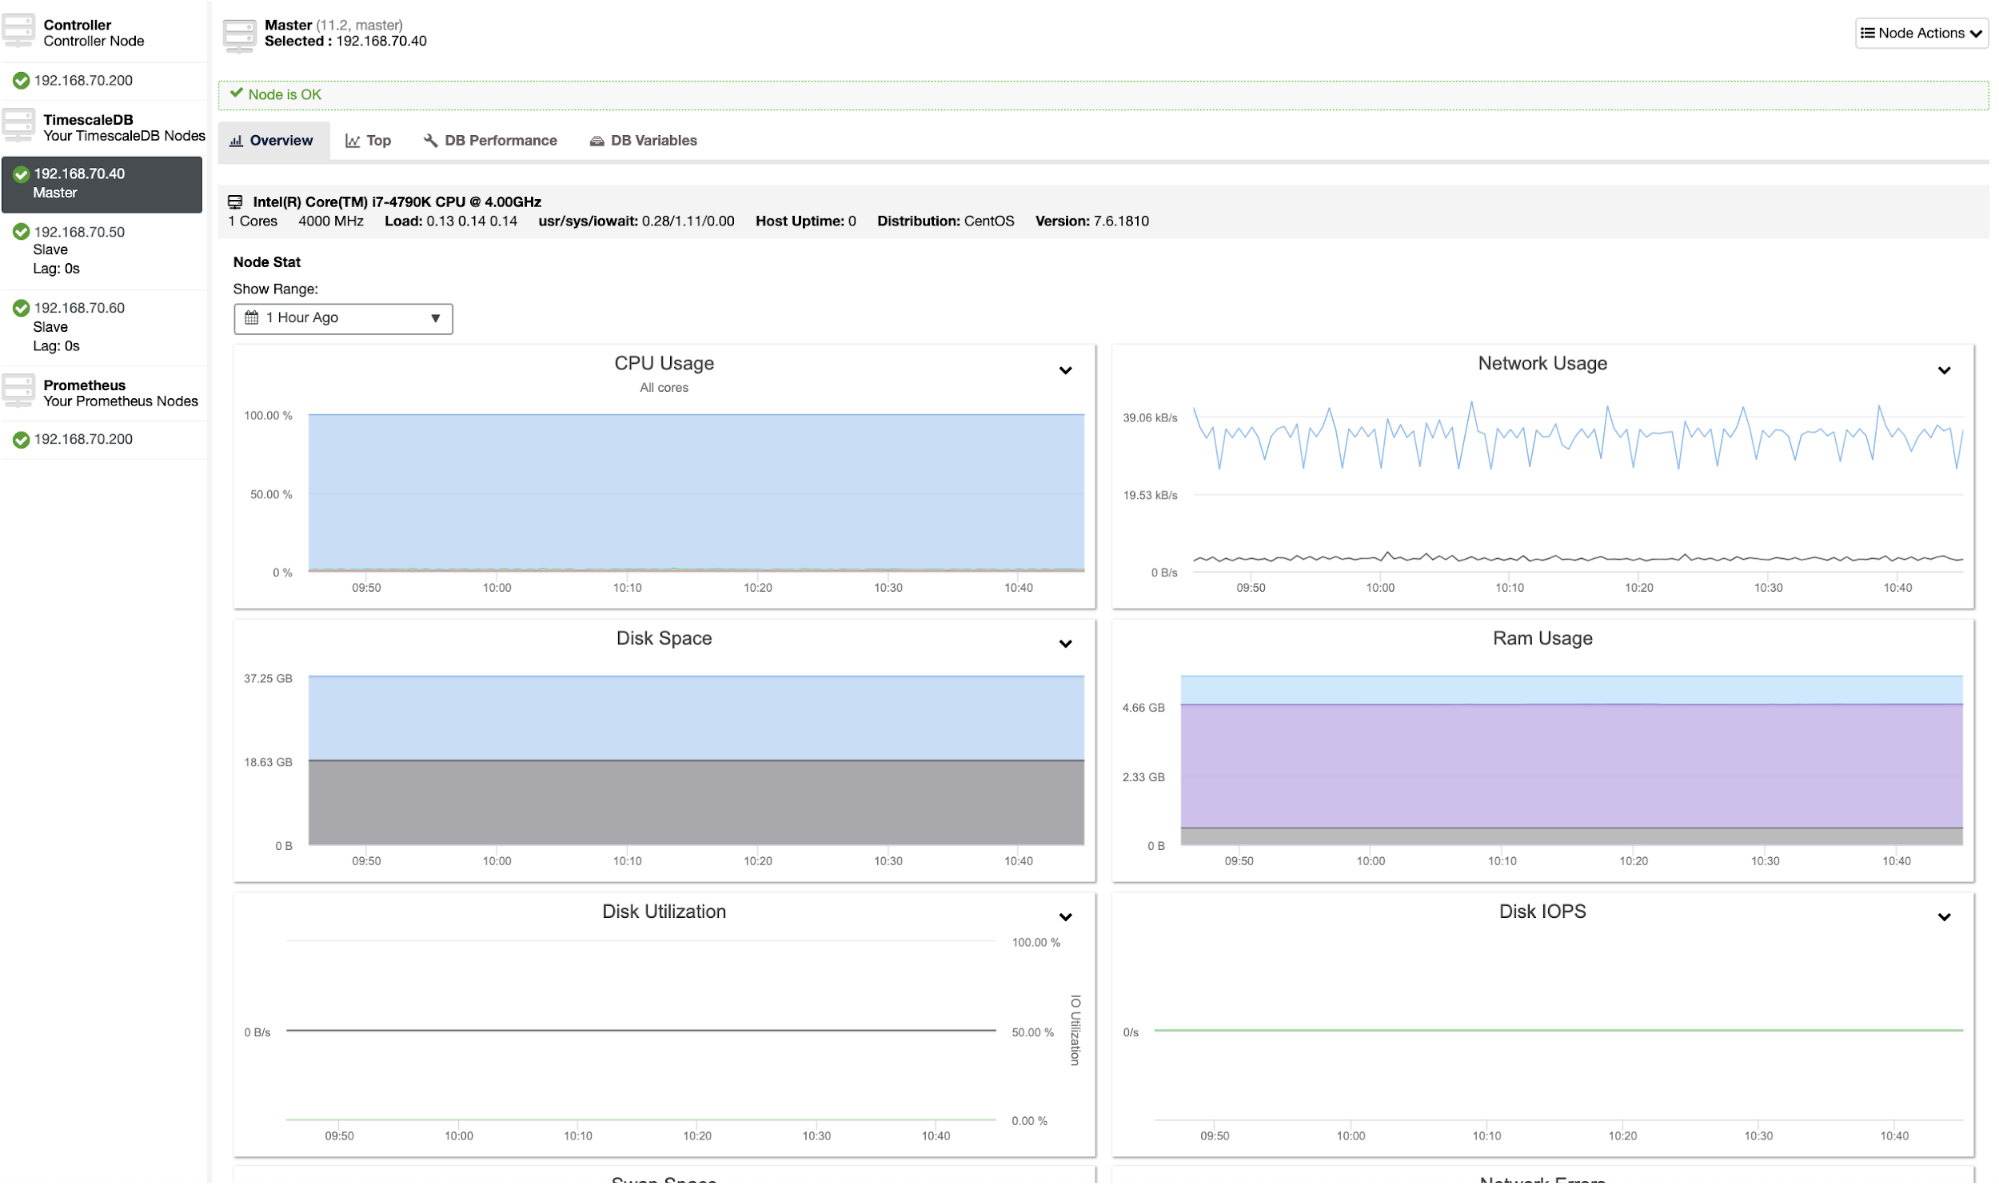
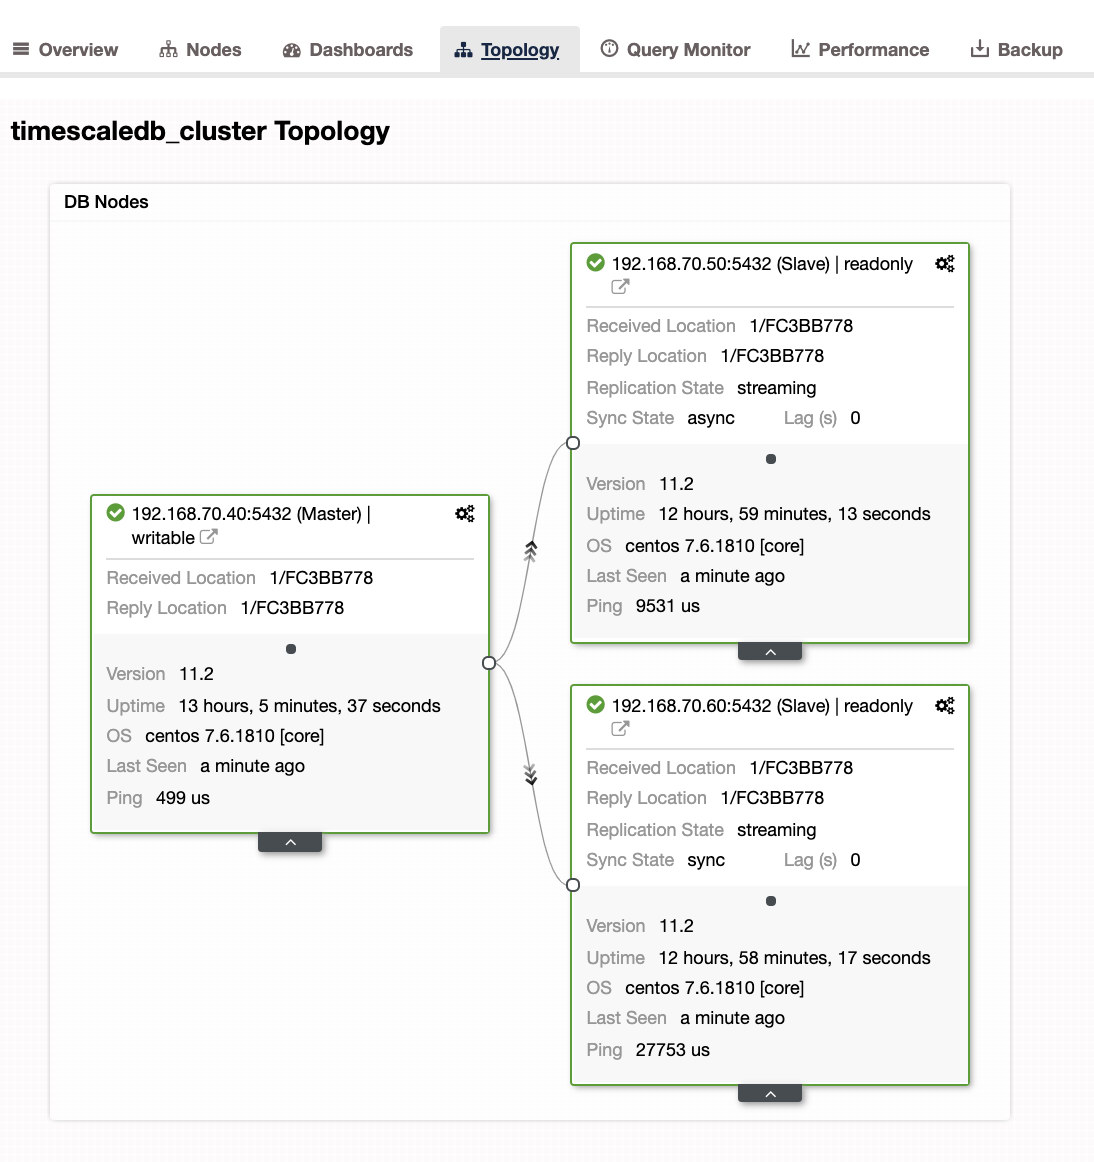
The only thing left was to wait for ClusterControl to finish the deployment. After 12 minutes and 5 seconds the cluster was ready:

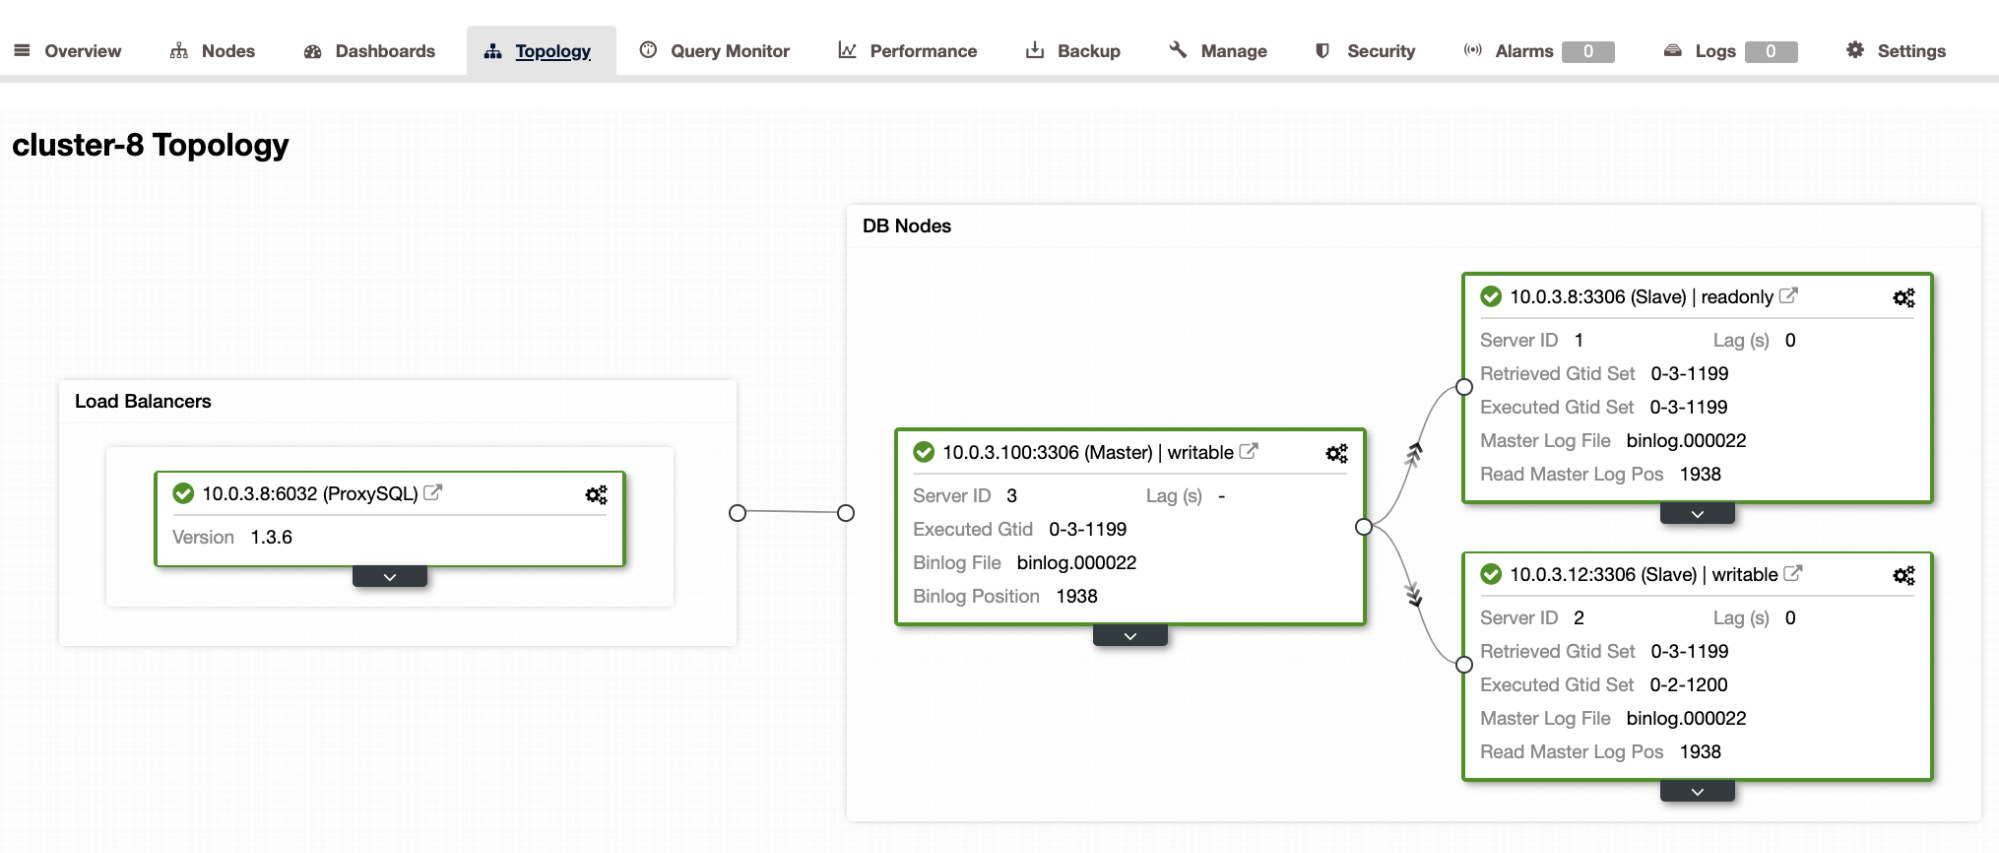
Total Installation Time - 17 minutes 30 seconds

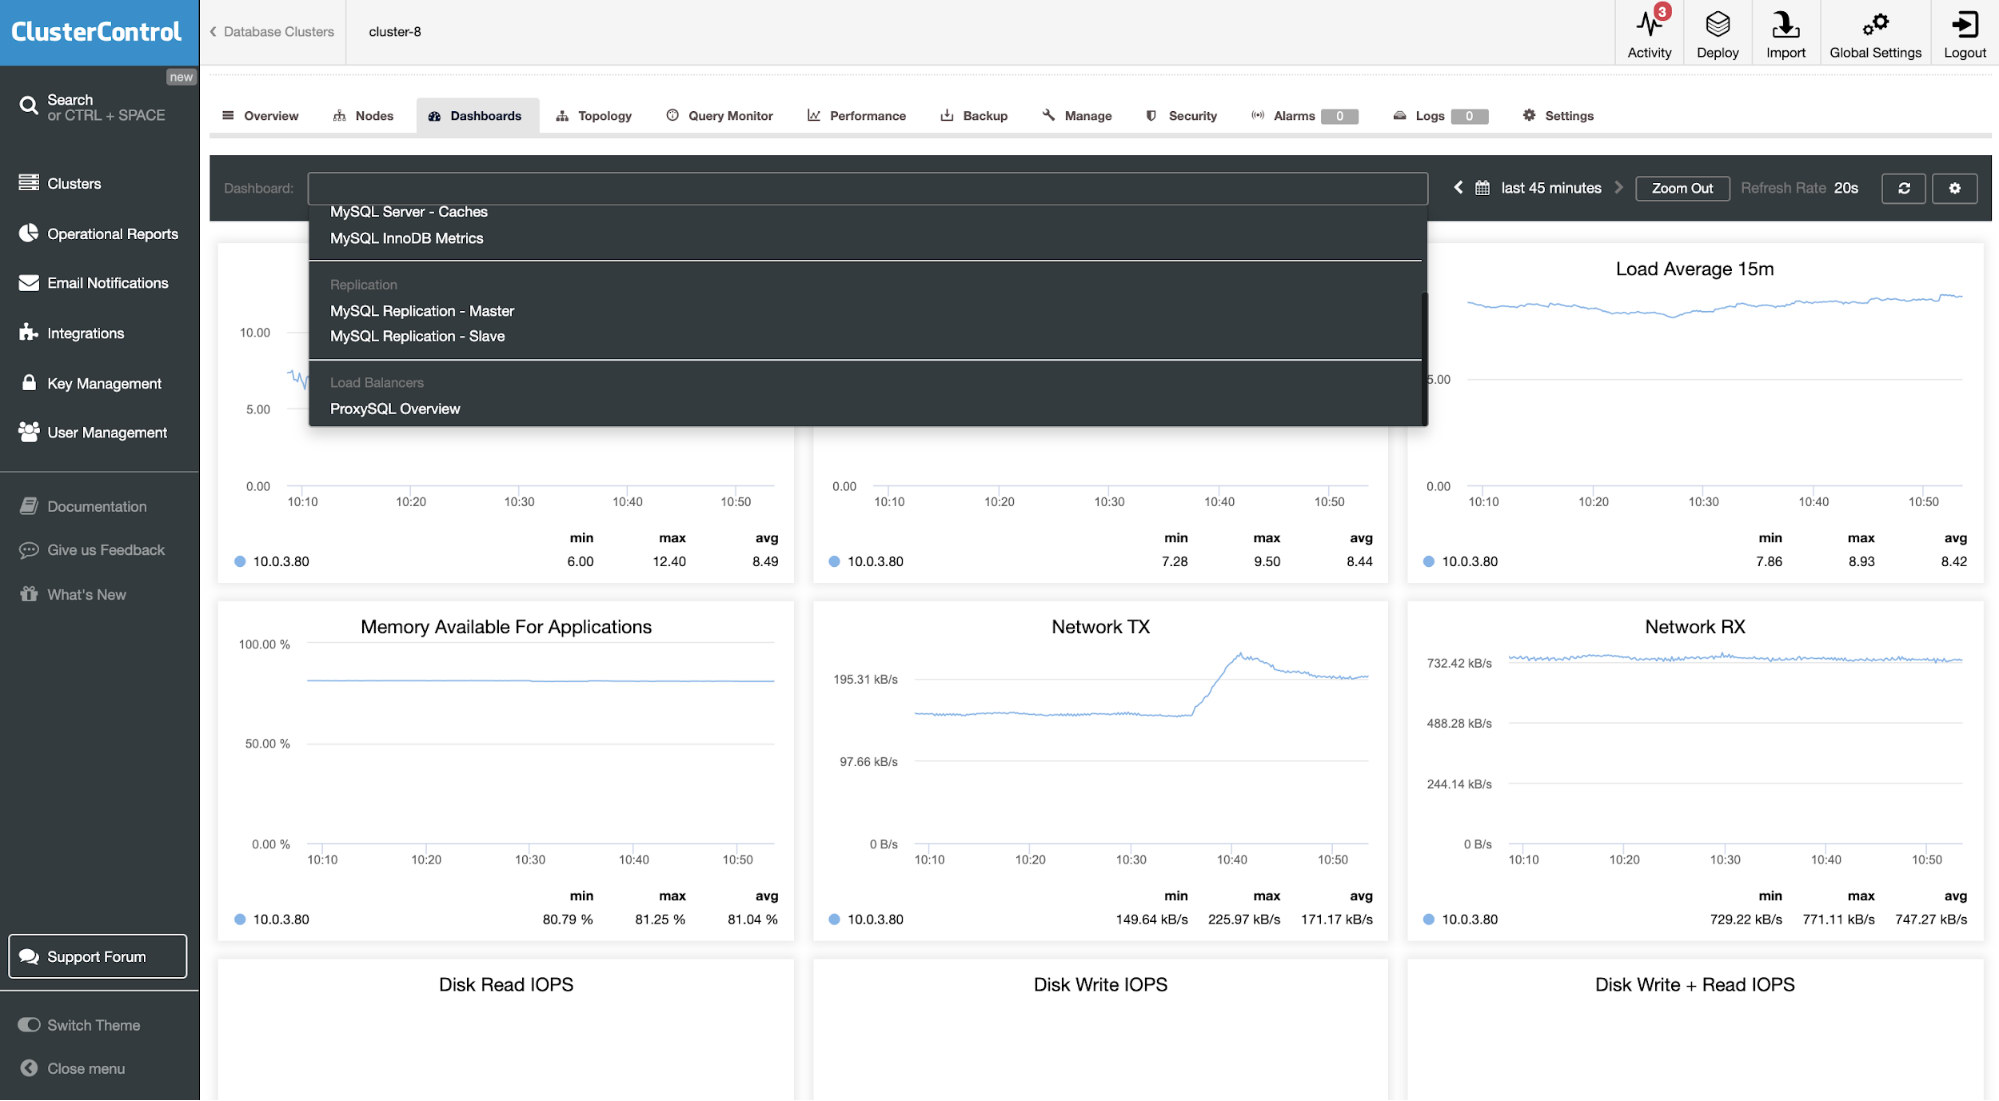
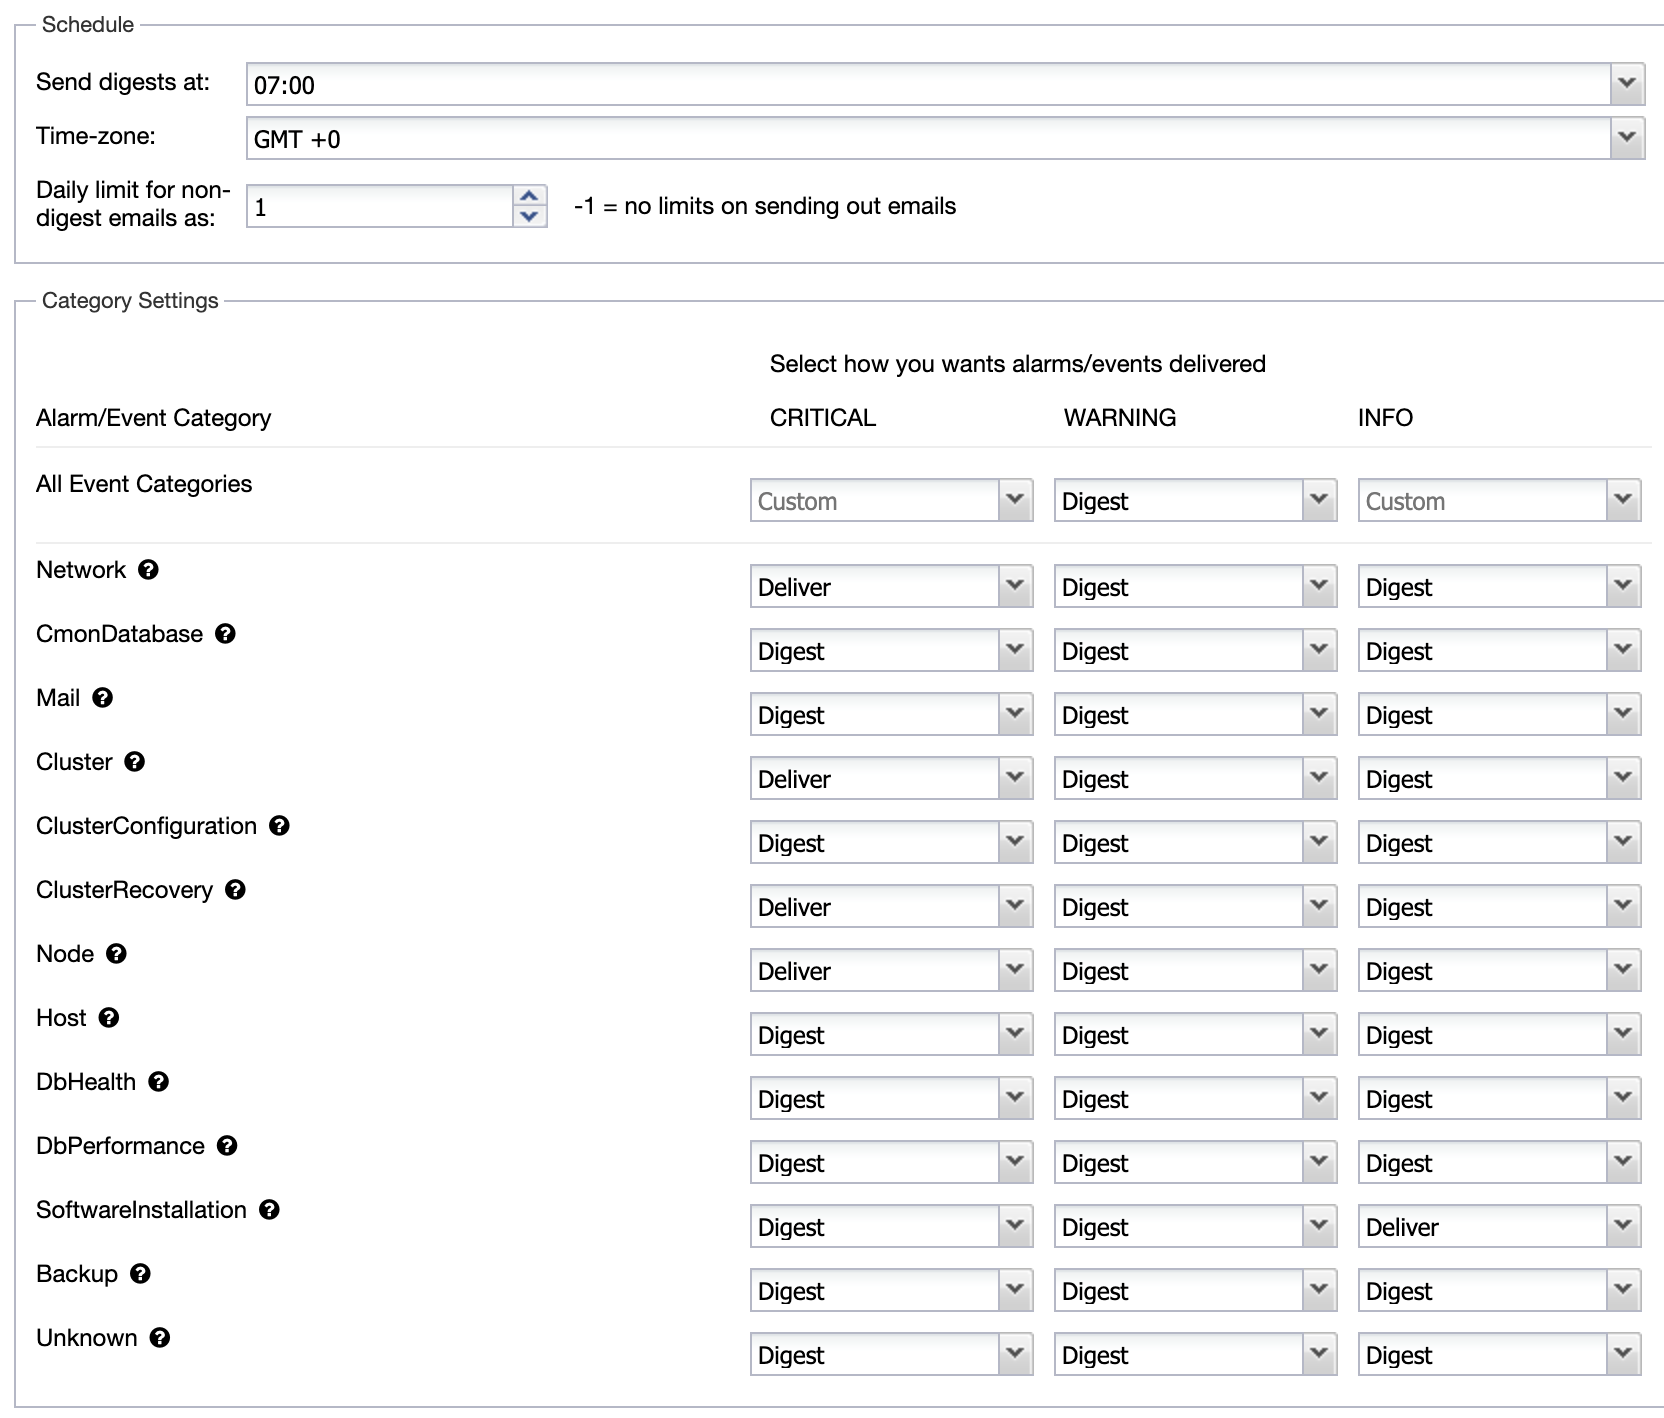
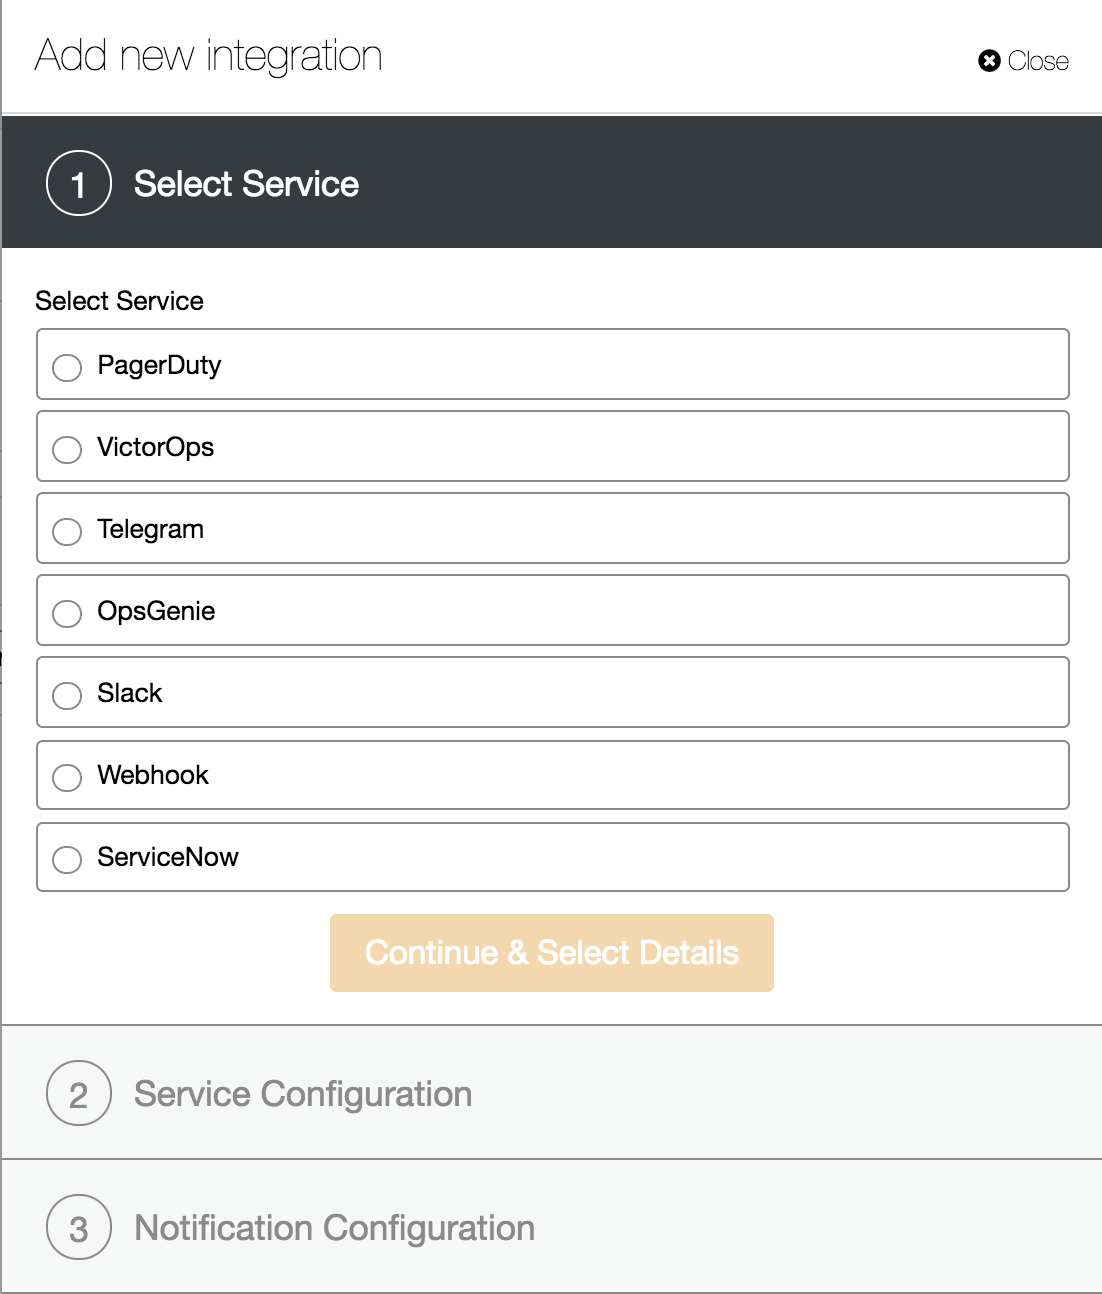
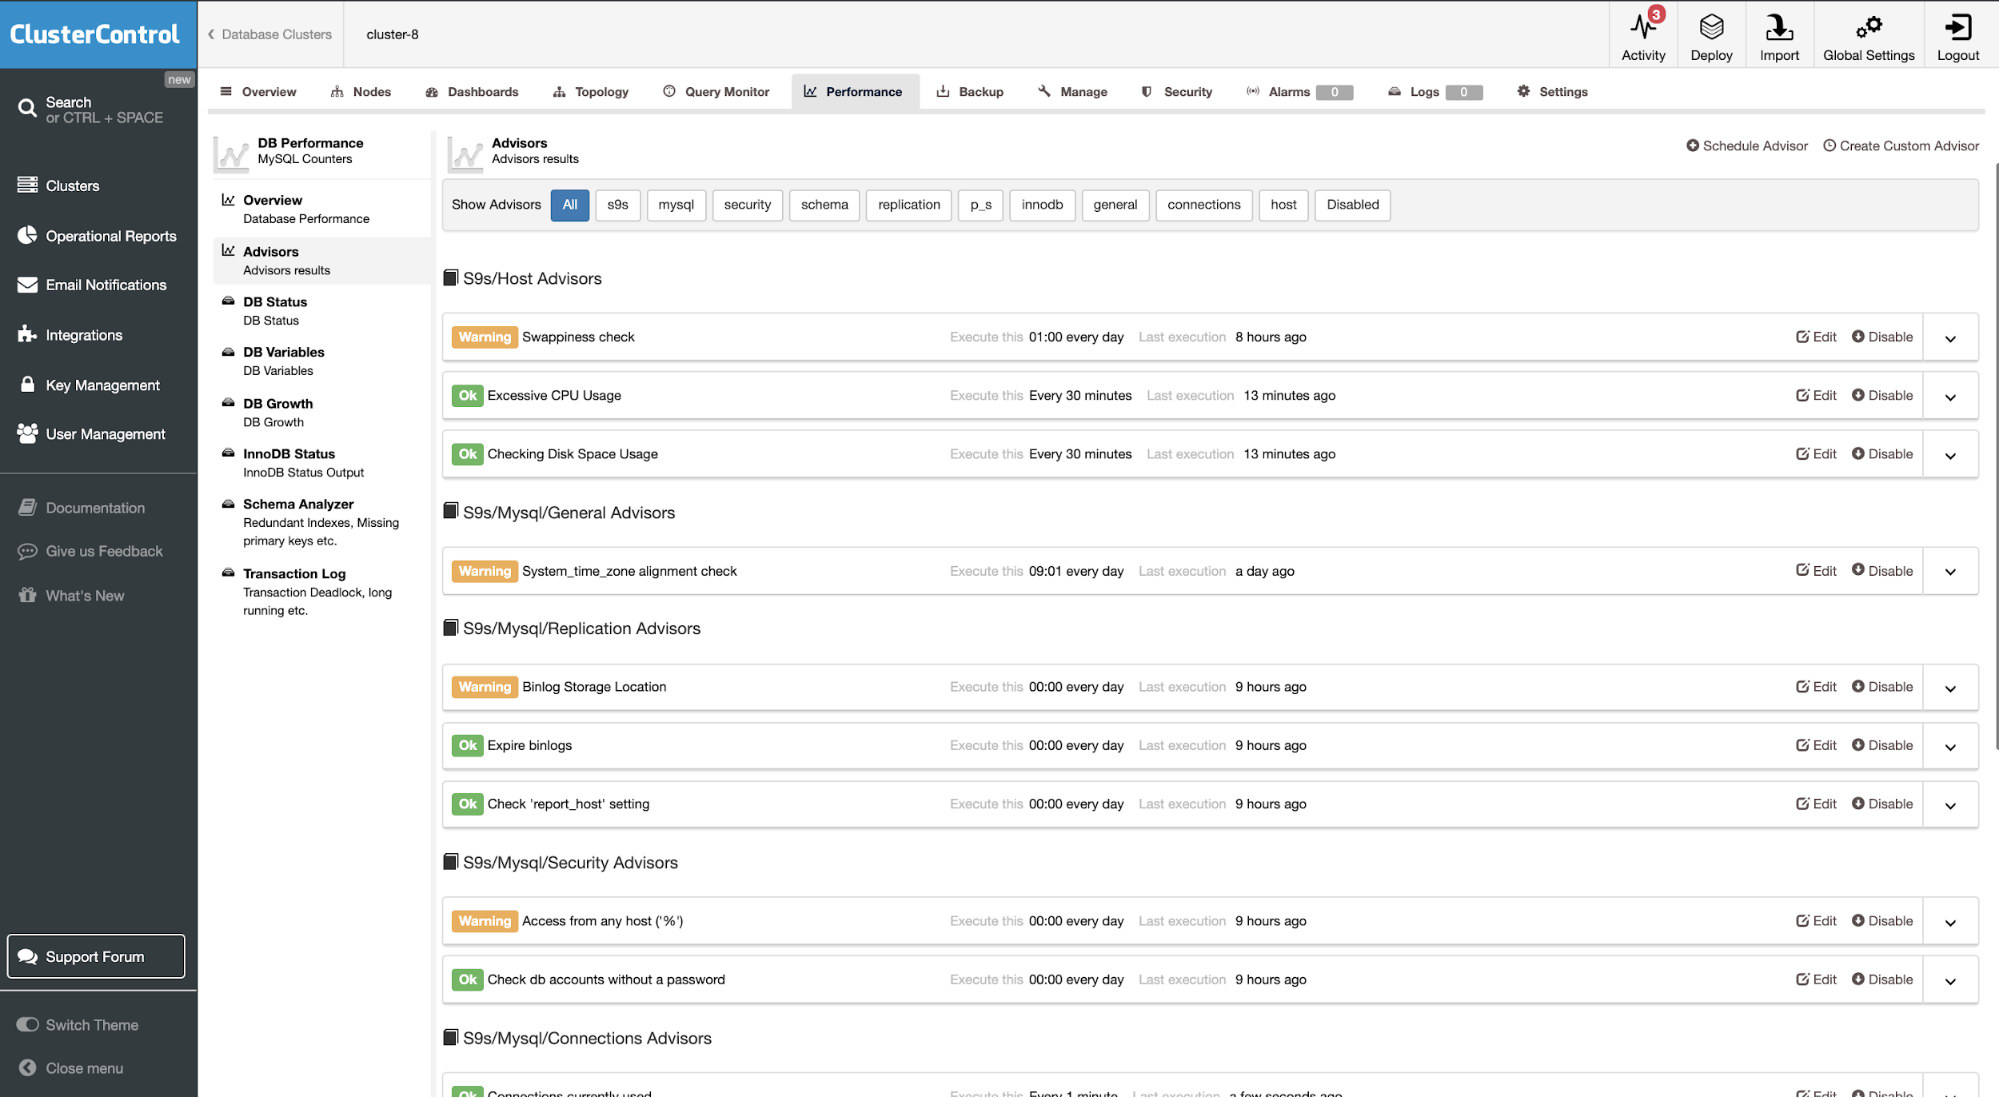
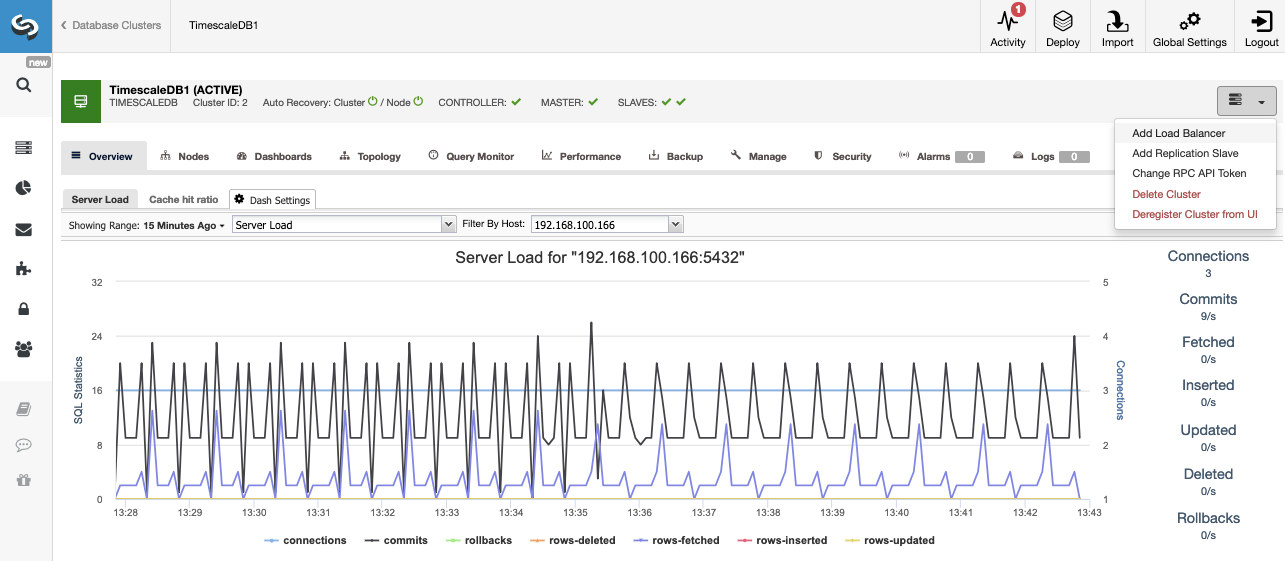
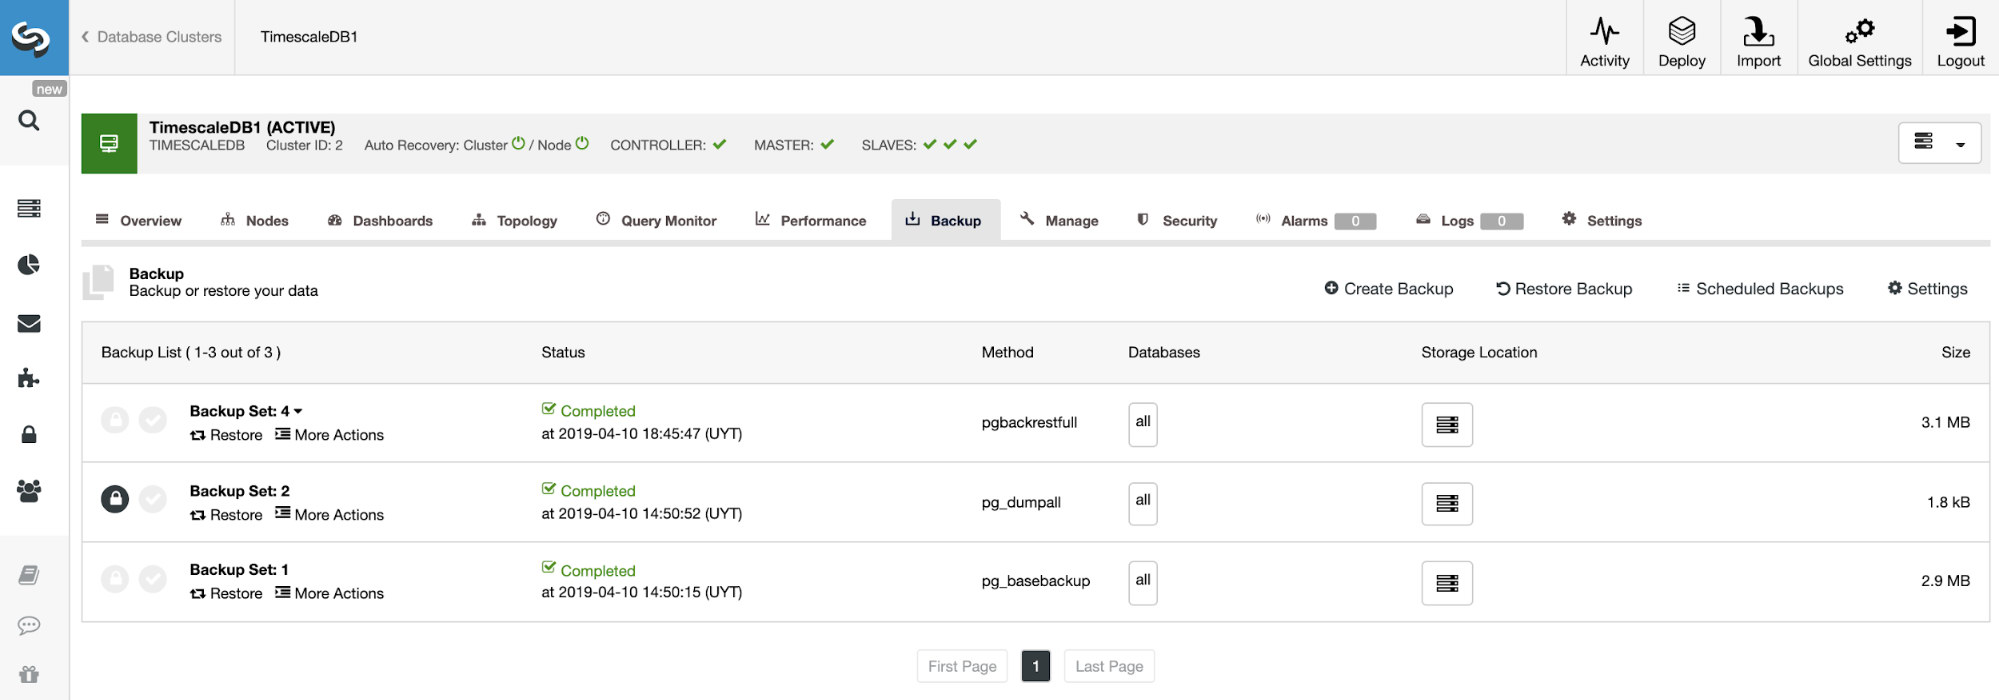
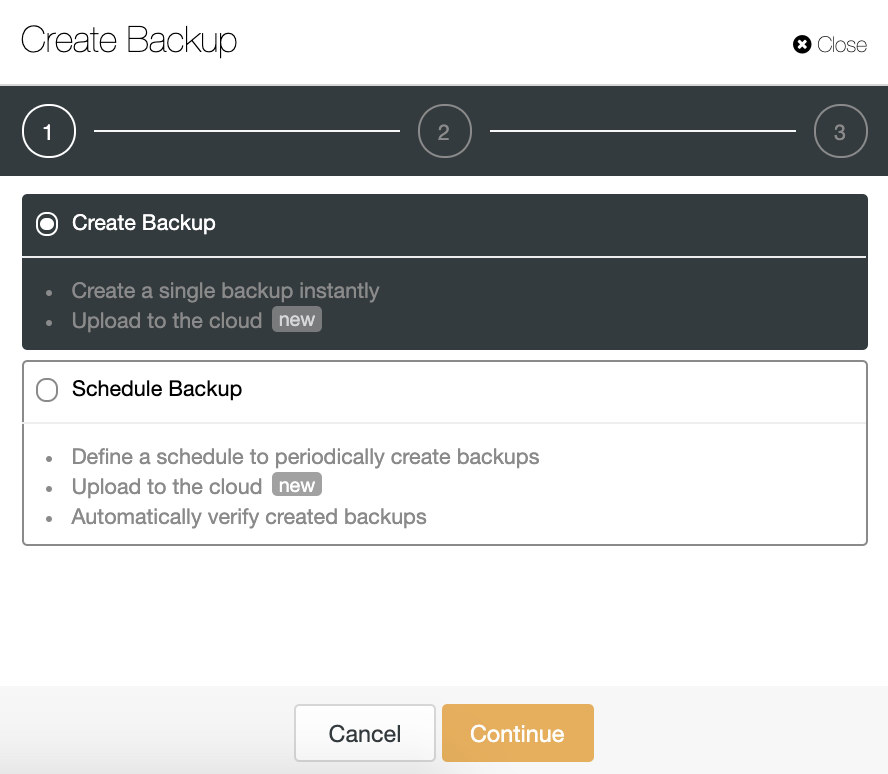
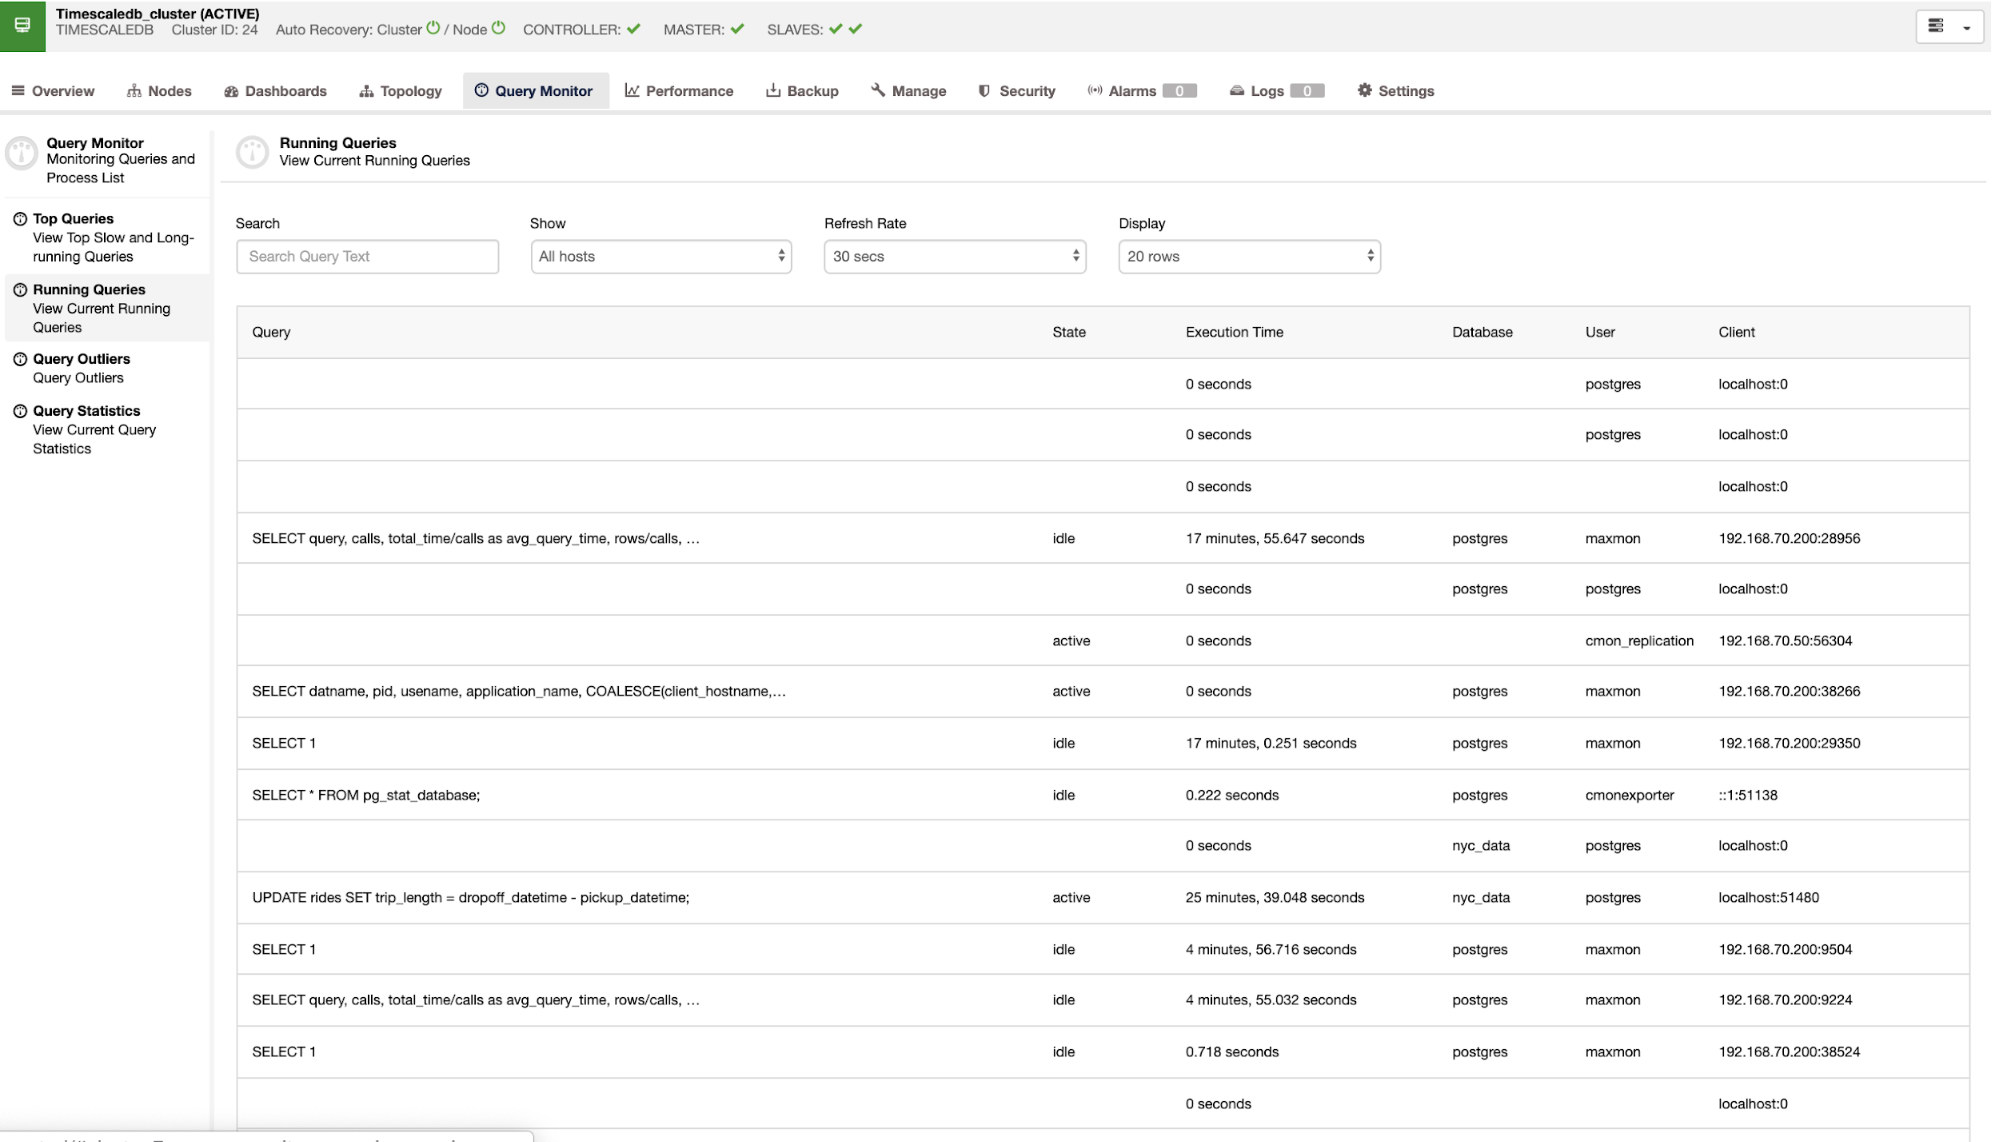
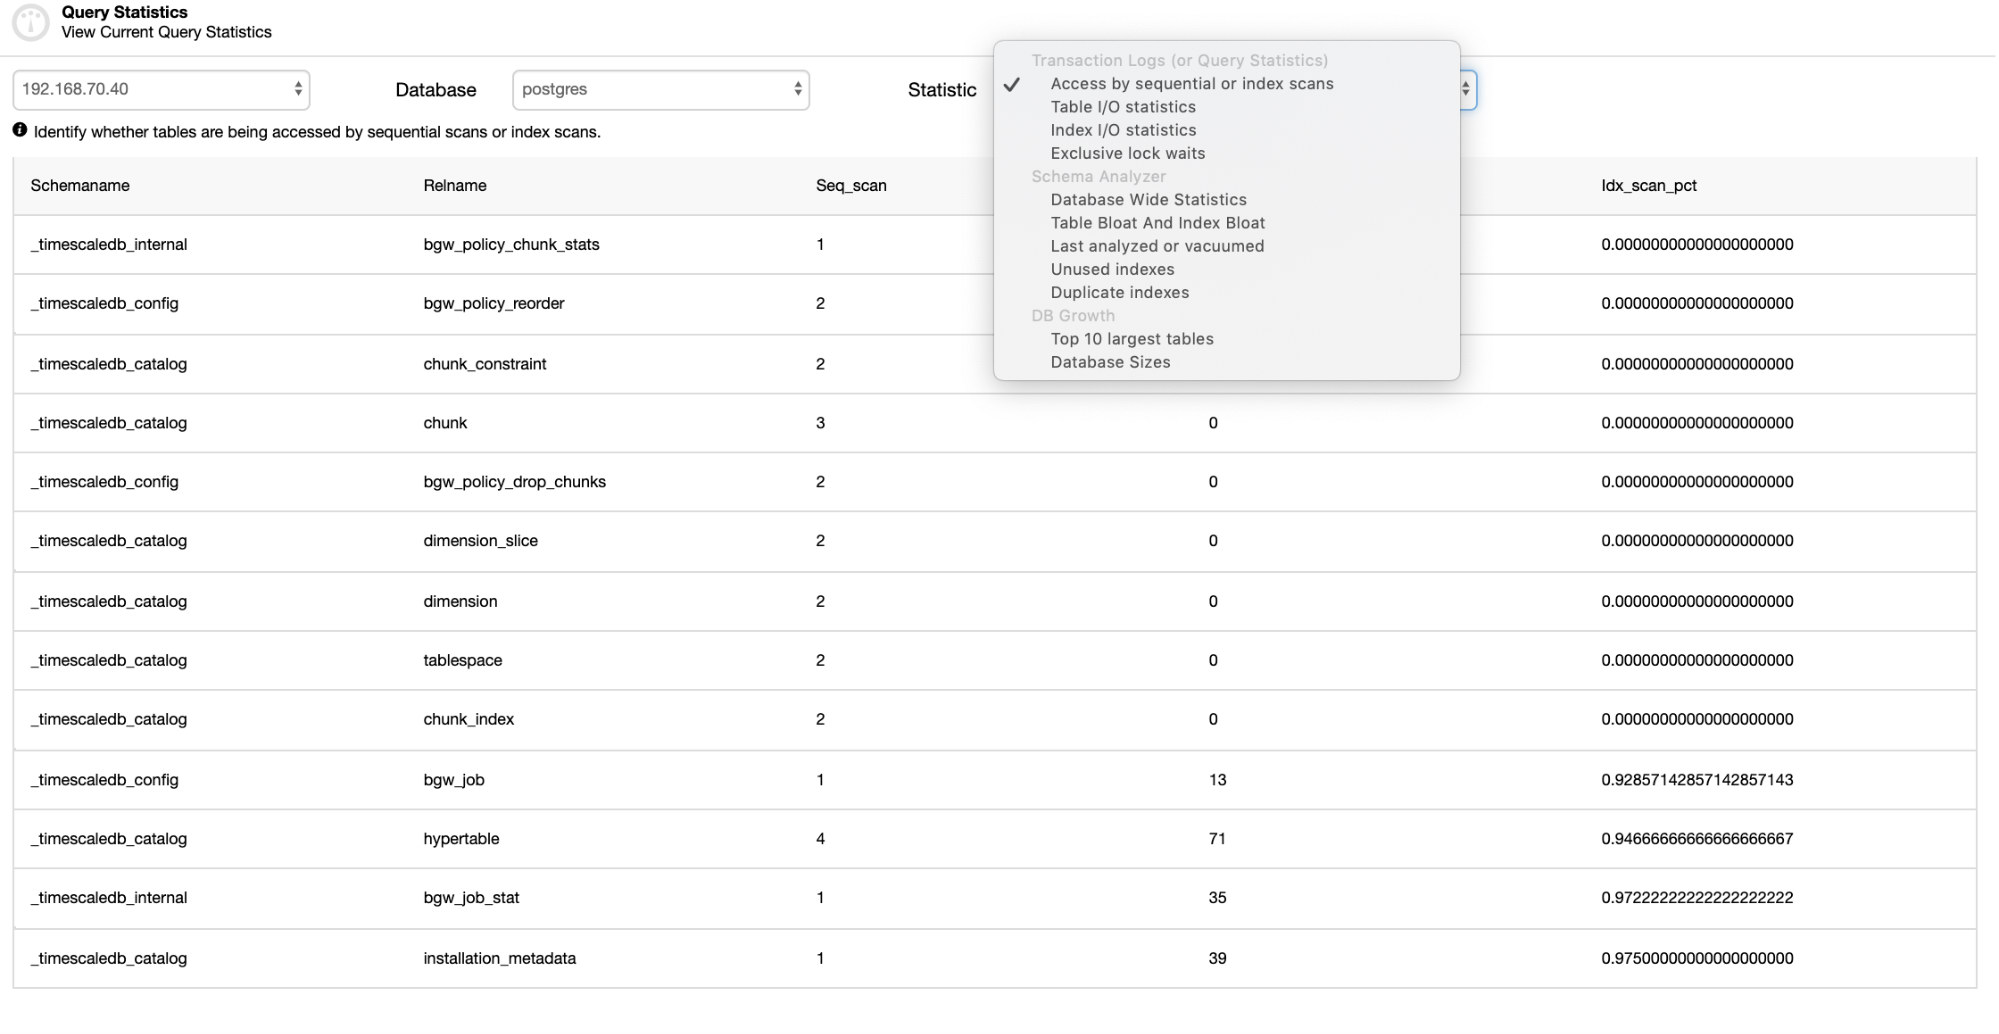
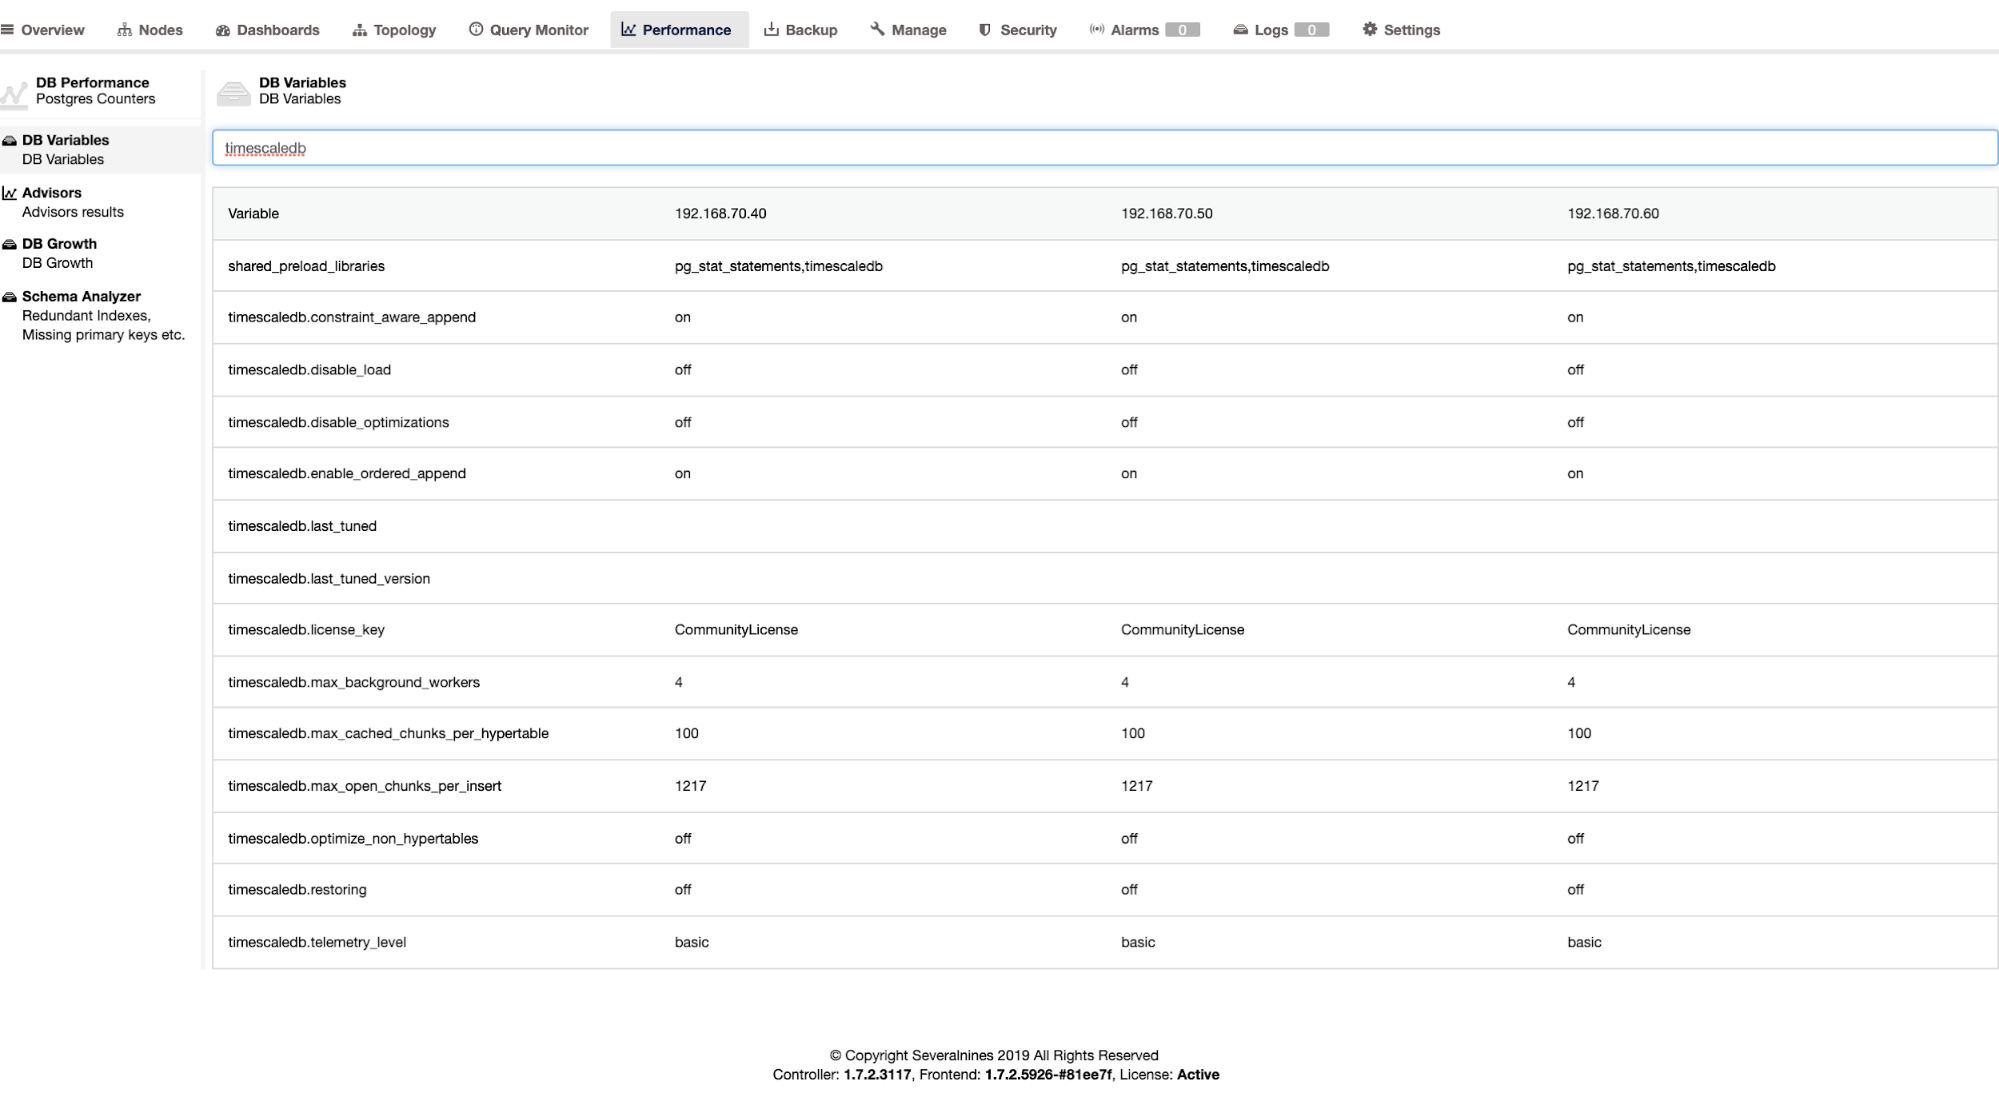
We managed to deploy ClusterControl and then PXC cluster using ClusterControl in 17 minutes and 30 seconds. The PXC deployment itself took 12 minutes and 5 seconds. At the end we have a working cluster, deployed according to the best practices. ClusterControl also ensures that the configuration of the cluster makes sense. In short, even if you don't really know anything about MySQL or Galera Cluster, you can have a production-ready cluster deployed in a couple of minutes. ClusterControl is not just a deployment tool, it is also management platform - makes things even easier for people not experienced with MySQL and Galera to identify performance problems (through advisors) and do management actions (scaling the cluster up and down, running backups, creating asynchronous slaves to Galera). What is important, ClusterControl will always be maintained and can be used to deploy all MySQL flavors (and not only MySQL/MariaDB, it also supports TimeScaleDB, PostgreSQL and MongoDB). It also worked out of the box, something which cannot be said about other methods we tested.

If you would like to experience the same, you can download ClusterControl for free. Let us know how you liked it.


An Overview of Streaming Replication for TimescaleDB

$
0
0

Nowadays, replication is a given in a high availability and fault tolerant environment for pretty much any database technology that you’re using. It is a topic that we have seen over and over again, but that never gets old.

If you’re using TimescaleDB, the most common type of replication is streaming replication, but how does it work?

In this blog, we are going to review some concepts related to replication and we’ll focus on streaming replication for TimescaleDB, which is a functionality inherited from the underlying PostgreSQL engine. Then, we’ll see how ClusterControl can help us to configure it.

So, streaming replication is based on shipping the WAL records and having them applied to the standby server. So, first, let’s see what WAL is.

WAL

Write Ahead Log (WAL) is a standard method for ensuring data integrity, it is automatically enabled by default.

The WALs are the REDO logs in TimescaleDB. But, what are the REDO logs?

REDO logs contain all changes that were made in the database and they are used by replication, recovery, online backup and point in time recovery (PITR). Any changes that have not been applied to the data pages can be redone from the REDO logs.

Using WAL results in a significantly reduced number of disk writes, because only the log file needs to be flushed to disk to guarantee that a transaction is committed, rather than every data file changed by the transaction.

A WAL record will specify, bit by bit, the changes made to the data. Each WAL record will be appended into a WAL file. The insert position is a Log Sequence Number (LSN) that is a byte offset into the logs, increasing with each new record.

The WALs are stored in the pg_wal directory, under the data directory. These files have a default size of 16MB (the size can be changed by altering the --with-wal-segsize configure option when building the server). They have a unique incremental name, in the following format: "00000001 00000000 00000000".

The number of WAL files contained in pg_wal will depend on the value assigned to the min_wal_size and max_wal_size parameters in the postgresql.conf configuration file.

One parameter that we need to setup when configuring all our TimescaleDB installations is the wal_level. It determines how much information is written to the WAL. The default value is minimal, which writes only the information needed to recover from a crash or immediate shutdown. Archive adds logging required for WAL archiving; hot_standby further adds information required to run read-only queries on a standby server; and, finally logical adds information necessary to support logical decoding. This parameter requires a restart, so, it can be hard to change on running production databases if we have forgotten that.

Streaming Replication

Streaming replication is based on the log shipping method. The WAL records are directly moved from one database server into another to be applied. We can say that it is a continuous PITR.

This transfer is performed in two different ways, by transferring WAL records one file (WAL segment) at a time (file-based log shipping) and by transferring WAL records (a WAL file is composed of WAL records) on the fly (record based log shipping), between a master server and one or several slave servers, without waiting for the WAL file to be filled.

In practice, a process called WAL receiver, running on the slave server, will connect to the master server using a TCP/IP connection. In the master server, another process exists, named WAL sender, and is in charge of sending the WAL registries to the slave server as they happen.

Streaming replication can be represented as following:

By looking at the above diagram we can think, what happens when the communication between the WAL sender and the WAL receiver fails?

When configuring streaming replication, we have the option to enable WAL archiving.

This step is actually not mandatory, but is extremely important for robust replication setup, as it is necessary to avoid the main server to recycle old WAL files that have not yet being applied to the slave. If this occurs we will need to recreate the replica from scratch.

When configuring replication with continuous archiving, we are starting from a backup and, to reach the on sync state with the master, we need to apply all the changes hosted in the WAL that happened after the backup. During this process, the standby will first restore all the WAL available in the archive location (done by calling restore_command). The restore_command will fail when we reach the last archived WAL record, so after that, the standby is going to look on the pg_wal directory to see if the change exists there (this is actually made to avoid data loss when the master servers crashes and some changes that have already been moved into the replica and applied there have not yet been archived).

If that fails, and the requested record does not exist there, then it will start communicating with the master through streaming replication.

Whenever streaming replication fails, it will go back to step 1 and restore the records from archive again. This loop of retrieving from the archive, pg_wal, and via streaming replication goes on until the server is stopped or failover is triggered by a trigger file.

This will be a diagram of such configuration:

Streaming replication is asynchronous by default, so at some given moment we can have some transactions that can be committed in the master and not yet replicated into the standby server. This implies some potential data loss.

However, this delay between the commit and impact of the changes in the replica is supposed to be really small (some milliseconds), assuming of course that the replica server is powerful enough to keep up with the load.

For the cases when even the risk of a small data loss is not tolerable, we can use the synchronous replication feature.

In synchronous replication, each commit of a write transaction will wait until confirmation is received that the commit has been written to the write-ahead log on disk of both the primary and standby server.

This method minimizes the possibility of data loss, as for that to happen we will need for both the master and the standby to fail at the same time.

The obvious downside of this configuration is that the response time for each write transaction increases, as we need to wait until all parties have responded. So the time for a commit is, at minimum, the round trip between the master and the replica. Read-only transactions will not be affected by that.

To setup synchronous replication we need for each of the standby servers to specify an application_name in the primary_conninfo of the recovery.conf file: primary_conninfo = '...aplication_name=slaveX' .

We also need to specify the list of the standby servers that are going to take part in the synchronous replication: synchronous_standby_name = 'slaveX,slaveY'.

We can setup one or several synchronous servers, and this parameter also specifies which method (FIRST and ANY) to choose synchronous standbys from the listed ones.

To deploy TimescaleDB with streaming replication setups (synchronous or asynchronous), we can use ClusterControl, as we can see here.

After we have configured our replication, and it is up and running, we will need to have some additional features for monitoring and backup management. ClusterControl allows us to monitor and manage backups/retention of our TimescaleDB cluster from the same place without any external tool.

ClusterControl
Single Console for Your Entire Database Infrastructure
Find out what else is new in ClusterControl

How to Configure Streaming Replication on TimescaleDB

Setting up streaming replication is a task that requires some steps to be followed thoroughly. If you want to configure it manually, you can follow our blog about this topic.

However, you can deploy or import your current TimescaleDB on ClusterControl, and then, you can configure streaming replication with a few clicks. Let’s see how can we do it.

For this task, we’ll assume you have your TimescaleDB cluster managed by ClusterControl. Go to ClusterControl -> Select Cluster -> Cluster Actions -> Add Replication Slave.

We can create a new replication slave (standby) or we can import an existing one. In this case, we’ll create a new one.

Now, we must select the Master node, add the IP Address or hostname for the new standby server, and the database port. We can also specify if we want ClusterControl to install the software and if we want to configure synchronous or asynchronous streaming replication.

That’s all. We only need to wait until ClusterControl finishes the job. We can monitor the status from the Activity section.

After the job has finished, we should have the streaming replication configured and we can check the new topology in the ClusterControl Topology View section.

By using ClusterControl, you can also perform several management tasks on your TimescaleDB like backup, monitor and alert, automatic failover, add nodes, add load balancers, and even more.

Failover

As we could see, TimescaleDB uses a stream of write-ahead log (WAL) records to keep the standby databases synchronized. If the main server fails, the standby contains almost all of the data of the main server and can be quickly made the new master database server. This can be synchronous or asynchronous and can only be done for the entire database server.

To effectively ensure high availability, it is not enough to have a master-standby architecture. We also need to enable some automatic form of failover, so if something fails we can have the smallest possible delay in resuming normal functionality.

TimescaleDB does not include an automatic failover mechanism to identify failures on the master database and notify the slave to take ownership, so that will require a little bit of work on the DBA’s side. You will also have only one server working, so re-creation of the master-standby architecture needs to be done, so we get back to the same normal situation that we had before the issue.

ClusterControl includes an automatic failover feature for TimescaleDB to improve mean time to repair (MTTR) in your high availability environment. In case of failure, ClusterControl will promote the most advanced slave to master, and it’ll reconfigure the remaining slave(s) to connect to the new master. HAProxy can also be automatically deployed in order to offer a single database endpoint to applications, so they are not impacted by a change of the master server.

Limitations

We have some well-known limitations when using Streaming Replication:

  • We cannot replicate into a different version or architecture
  • We cannot change anything on the standby server
  • We do not have much granularity on what we can replicate

So, to overcome these limitations, we have the logical replication feature. To know more about this replication type, you can check the following blog.

Conclusion

A master-standby topology has many different usages like analytics, backup, high availability, failover. In any case, it’s necessary to understand how the streaming replication works on TimescaleDB. It’s also useful to have a system to manage all the cluster and to give you the possibility to create this topology in an easy way. In this blog, we saw how to achieve it by using ClusterControl, and we reviewed some basic concepts about streaming replication.

Benchmarking MongoDB - Driving NoSQL Performance

$
0
0

Database systems are crucial components in the cycle of any successful running application. Every organization involving them therefore has the mandate to ensure smooth performance of these DBMs through consistent monitoring and handling minor setbacks before they escalate into enormous complications that may result in an application downtime or slow performance.

You may ask how can you tell if the database is really going to have an issue while it is working normally? Well, that is what we are going to discuss in this article and we term it as benchmarking. Benchmarking is basically running some set of queries with some test data along with some resource provision to determine whether these parameters meet the expected performance level.

MongoDB does not have a standard benchmarking methodology thereby we need to resolve in testing queries on own hardware. As much as you may also get impressive figures from the benchmark process, you need to be cautious as this may be a different case when running your database with real queries.

The idea behind benchmarking is to get a general idea on how different configuration options affect performance, how you can tweak some of these configurations to get maximum performance and estimate the cost of improving this implementation. Besides, applications grow with time in terms of users and probably the amount of data that is to be served hence need to do some capacity planning before this time. After realizing a rising trend of data, you need to do some benchmarking on how you will meet the requirements of this vast growing data.

Considerations in Benchmarking MongoDB

  1. Select workloads that are a typical representation of today’ modern applications. Modern applications are becoming more complex every day and this is transmitted down to the data structures. This is to say, data presentation has also changed with time for example storing simple fields to objects and arrays. It is not quite easy to work with this data with default or rather sub-standard database configurations as it may escalate to issues like poor latency and poor throughput operations involving the complex data. When running a benchmark you should therefore use data which is a clear presentation of your application.
  2. Double check on writes. Always ensure that all data writes were done in a manner that allowed no data loss. This is to improve on data integrity by ensuring the data is consistent and is most applicable especially in the production environment.
  3. Employ data volumes that are a representation of “big data” datasets which will certainly exceed the RAM capacity for an individual node. When the test workload is large, it will help you predict future expectations of your database performance hence start some capacity planning early enough.

Methodology

Our benchmark test will involve some big location data which can be downloaded from here and we will be using Robo3t software to manipulate our data and collect the information we need. The file has got more than 500 documents which are quite enough for our test. We are using MongoDB version 4.0 on an Ubuntu Linux 12.04 Intel Xeon-SandyBridge E3-1270-Quadcore 3.4GHz dedicated server with 32GB RAM, Western Digital WD Caviar RE4 1TB spinning disk and Smart XceedIOPS 256GB SSD. We inserted the first 500 documents.

We ran the insert commands below

db.getCollection('location').insertMany([<document1, <document2>…<document500>],{w:0})
db.getCollection('location').insertMany([<document1, <document2>…<document500>],{w:1})

Write Concern

Write concern describes acknowledgment level requested from MongoDB for write operations in this case to a standalone MongoDB. For a high throughput operation, if this value is set to low then the write calls will be so fast thus reduce the latency of the request. On the other hand, if the value is set high, then the write calls are slow and consequently increase on the query latency. A simple explanation for this is that when the value is low then you are not concerned about the possibility of losing some writes in an event of mongod crash, network error or anonymous system failure. A limitation in this case will be, you won’t be sure if these writes were successful. On the other hand, if the write concern is high, there is an error handling prompt and thus the writes will be acknowledged. An acknowledgment is simply a receipt that the server accepted the write to process.

When the write concern is set high
When the write concern is set low

In our test, the write concern set to low resulted in the query being executed in min of 0.013ms and max of 0.017ms. In this case, the basic acknowledgment of write is disabled but one can still get information regarding socket exceptions and any network error that may have been triggered.

When the write concern is set high, it almost takes double the time to return with the execution time being 0.027ms min and 0.031ms max. The acknowledgment in this case is guaranteed but not 100% it has reached disk journal. In this case, chances of a write loss are thus 50% due to the 100ms window where the journal might not be flushed to disk.

Journaling

This is a technique of ensuring no data loss by providing durability in an event of failure. This is achieved through a write-ahead logging to on-disk journal files. It is most efficient when the write concern is set high.

For a spinning disk, the execution time with journaling enabled is a bit high, for instance in our test it was about 0.251ms for the same operation above.

The execution time for an SSD however is a bit lower for the same command. In our test, it was about 0.207ms but depending on the nature of data sometimes this could be 3 times faster than a spinning disk.

When journaling is enabled, it confirms that writes have been made to the journal and hence ensuring data durability. Consequently, the write operation will survive a mongod shutdown and ensures that the write operation is durable.

For a high throughput operation, you can half query times by setting w=0. Otherwise, if you need to be sure that data has been recorded or rather will be in case of a back-to-life after failure, then you need to set the w=1.

Severalnines
 
Become a MongoDB DBA - Bringing MongoDB to Production
Learn about what you need to know to deploy, monitor, manage and scale MongoDB

Replication

Acknowledgment of a write concern can be enabled for more than one node that is the primary and some secondary within a replica set. This will be characterized by what integer is valued to the write parameter. For example, if w = 3, Mongod must ensure that the query receives an acknowledgment from the main node and 2 slaves. If you try to set a value greater than one and the node is not yet replicated, it will throw an error that the host must be replicated.

Replication comes with a latency setback such that the execution time will be increased. For the simple query above if w=3, then average execution time increases to 270ms. A driving factor for this is the range in response time between nodes affected by network latency, communication overhead between the 3 nodes and congestion. Besides, all three nodes wait for each other to finish before returning the result. In a production deployment, you will therefore not need to involve so many nodes if you want to improve on performance. MongoDB is responsible for selecting which nodes are to be acknowledged unless there is a specification in the configuration file using tags.

Spinning Disk vs Solid State Disk

As mentioned above, SSD disk is quite fast than spinning disk depending on the data involved. Sometimes it could be 3 times faster hence worthy paying for if need be. However, it will be more expensive to use an SSD especially when dealing with vast data. MongoDB has got merit that it supports storing databases in directories which can be mounted hence a chance to use an SSD. Employing an SSD and enabling journaling is a great optimization.

Conclusion

The experiment was certain that write concern disabled results in reduced execution time of a query at the expense of data loss chances. On the other hand, when the write concern is enabled, the execution time is almost 2 times when it is disabled but there is an assurability that data won’t be lost. Besides, we are able to justify that SSD is faster than a Spinning disk. However, to ensure data durability in an event of a system failure, it is advisable to enable the write concern. When enabling the write concern for a replica set, don’t set the number too large such that it may result in some degraded performance from the application end.

How to Use pgBackRest to Backup PostgreSQL and TimescaleDB

$
0
0

Your data is probably the most valuable assets in the company, so you should have a Disaster Recovery Plan (DRP) to prevent data loss in the event of an accident or hardware failure. A backup is the simplest form of DR. It might not always be enough to guarantee an acceptable Recovery Point Objective (RPO) but is a good first approach. Also, you should define a Recovery Time Objective (RTO) according to your company requirements. There are many ways to reach the RTO value, it depends on the company goals.

In this blog, we’ll see how to use pgBackRest for backing up PostgreSQL and TimescaleDB and how to use one of the most important features of this backup tool, the combination of Full, Incremental and Differential backups, to minimize downtime.

What is pgBackRest?

There are different types of backups for databases:

  • Logical: The backup is stored in a human-readable format like SQL.
  • Physical: The backup contains binary data.
  • Full/Incremental/Differential: The definition of these three types of backups is implicit in the name. The full backup is a full copy of all your data. Incremental backup only backs up the data that has changed since the previous backup and the differential backup only contains the data that has changed since the last full backup executed. The incremental and differential backups were introduced as a way to decrease the amount of time and disk space usage that it takes to perform a full backup.

pgBackRest is an open source backup tool that creates physical backups with some improvements compared to the classic pg_basebackup tool. We can use pgBackRest to perform an initial database copy for Streaming Replication by using an existing backup, or we can use the delta option to rebuild an old standby server.

Some of the most important pgBackRest features are:

  • Parallel Backup & Restore
  • Local or Remote Operation
  • Full, Incremental and Differential Backups
  • Backup Rotation and Archive Expiration
  • Backup Integrity check
  • Backup Resume
  • Delta Restore
  • Encryption

Now, let’s see how we can use pgBackRest to backup our PostgreSQL and TimescaleDB databases.

How to Use pgBackRest

For this test, we’ll use CentOS 7 as OS and PostgreSQL 11 as the database server. We’ll assume you have the database installed, if not you can follow these links to deploy both PostgreSQL or TimescaleDB in an easy way by using ClusterControl.

First, we need to install the pgbackrest package.

$ yum install pgbackrest

pgBackRest can be used from the command line, or from a configuration file located by default in /etc/pgbackrest.conf on CentOS7. This file contains the following lines:

[global]
repo1-path=/var/lib/pgbackrest
#[main]
#pg1-path=/var/lib/pgsql/10/data

You can check this link to see which parameter we can add in this configuration file.

We’ll add the following lines:

[testing]
pg1-path=/var/lib/pgsql/11/data

Make sure that you have the following configuration added in the postgresql.conf file (these changes require a service restart).

archive_mode = on
archive_command = 'pgbackrest --stanza=testing archive-push %p'
max_wal_senders = 3
wal_level = logical

Now, let’s take a basic backup. First, we need to create a “stanza”, that defines the backup configuration for a specific PostgreSQL or TimescaleDB database cluster. The stanza section must define the database cluster path and host/user if the database cluster is remote.

$ pgbackrest --stanza=testing --log-level-console=info stanza-create
2019-04-29 21:46:36.922 P00   INFO: stanza-create command begin 2.13: --log-level-console=info --pg1-path=/var/lib/pgsql/11/data --repo1-path=/var/lib/pgbackrest --stanza=testing
2019-04-29 21:46:37.475 P00   INFO: stanza-create command end: completed successfully (554ms)

And then, we can run the check command to validate the configuration.

$ pgbackrest --stanza=testing --log-level-console=info check
2019-04-29 21:51:09.893 P00   INFO: check command begin 2.13: --log-level-console=info --pg1-path=/var/lib/pgsql/11/data --repo1-path=/var/lib/pgbackrest --stanza=testing
2019-04-29 21:51:12.090 P00   INFO: WAL segment 000000010000000000000001 successfully stored in the archive at '/var/lib/pgbackrest/archive/testing/11-1/0000000100000000/000000010000000000000001-f29875cffe780f9e9d9debeb0b44d945a5165409.gz'
2019-04-29 21:51:12.090 P00   INFO: check command end: completed successfully (2197ms)

To take the backup, run the following command:

$ pgbackrest --stanza=testing --type=full --log-level-stderr=info backup
INFO: backup command begin 2.13: --log-level-stderr=info --pg1-path=/var/lib/pgsql/11/data --repo1-path=/var/lib/pgbackrest --stanza=testing --type=full
WARN: option repo1-retention-full is not set, the repository may run out of space
      HINT: to retain full backups indefinitely (without warning), set option 'repo1-retention-full' to the maximum.
INFO: execute non-exclusive pg_start_backup() with label "pgBackRest backup started at 2019-04-30 15:43:21": backup begins after the next regular checkpoint completes
INFO: backup start archive = 000000010000000000000006, lsn = 0/6000028
WARN: aborted backup 20190429-215508F of same type exists, will be cleaned to remove invalid files and resumed
INFO: backup file /var/lib/pgsql/11/data/base/16384/1255 (608KB, 1%) checksum e560330eb5300f7e2bcf8260f37f36660ce3a2c1
INFO: backup file /var/lib/pgsql/11/data/base/13878/1255 (608KB, 3%) checksum e560330eb5300f7e2bcf8260f37f36660ce3a2c1
INFO: backup file /var/lib/pgsql/11/data/base/13877/1255 (608KB, 5%) checksum e560330eb5300f7e2bcf8260f37f36660ce3a2c1
. . .
INFO: full backup size = 31.8MB
INFO: execute non-exclusive pg_stop_backup() and wait for all WAL segments to archive
INFO: backup stop archive = 000000010000000000000006, lsn = 0/6000130
INFO: new backup label = 20190429-215508F
INFO: backup command end: completed successfully (12810ms)
INFO: expire command begin
INFO: option 'repo1-retention-archive' is not set - archive logs will not be expired
INFO: expire command end: completed successfully (10ms)

Now, we have the backup finished with the “completed successfully” output, so, let’s go to restore it. We’ll stop the postgresql-11 service.

$ service postgresql-11 stop
Redirecting to /bin/systemctl stop postgresql-11.service

And leave the datadir empty.

$ rm -rf /var/lib/pgsql/11/data/*

Now, run the following command:

$ pgbackrest --stanza=testing --log-level-stderr=info restore
INFO: restore command begin 2.13: --log-level-stderr=info --pg1-path=/var/lib/pgsql/11/data --repo1-path=/var/lib/pgbackrest --stanza=testing
INFO: restore backup set 20190429-215508F
INFO: restore file /var/lib/pgsql/11/data/base/16384/1255 (608KB, 1%) checksum e560330eb5300f7e2bcf8260f37f36660ce3a2c1
INFO: restore file /var/lib/pgsql/11/data/base/13878/1255 (608KB, 3%) checksum e560330eb5300f7e2bcf8260f37f36660ce3a2c1
INFO: restore file /var/lib/pgsql/11/data/base/13877/1255 (608KB, 5%) checksum e560330eb5300f7e2bcf8260f37f36660ce3a2c1
. . .
INFO: write /var/lib/pgsql/11/data/recovery.conf
INFO: restore global/pg_control (performed last to ensure aborted restores cannot be started)
INFO: restore command end: completed successfully (10819ms)

Then, start the postgresql-11 service.

$ service postgresql-11 stop

And now we have our database up and running.

$ psql -U app_user world
world=> select * from city limit 5;
 id |      name      | countrycode |   district    | population
----+----------------+-------------+---------------+------------
  1 | Kabul          | AFG         | Kabol         |    1780000
  2 | Qandahar       | AFG         | Qandahar      |     237500
  3 | Herat          | AFG         | Herat         |     186800
  4 | Mazar-e-Sharif | AFG         | Balkh         |     127800
  5 | Amsterdam      | NLD         | Noord-Holland |     731200
(5 rows)

Now, let’s see how we can take a differential backup.

$ pgbackrest --stanza=testing --type=diff --log-level-stderr=info backup
INFO: backup command begin 2.13: --log-level-stderr=info --pg1-path=/var/lib/pgsql/11/data --repo1-path=/var/lib/pgbackrest --stanza=testing --type=diff
WARN: option repo1-retention-full is not set, the repository may run out of space
      HINT: to retain full backups indefinitely (without warning), set option 'repo1-retention-full' to the maximum.
INFO: last backup label = 20190429-215508F, version = 2.13
INFO: execute non-exclusive pg_start_backup() with label "pgBackRest backup started at 2019-04-30 21:22:58": backup begins after the next regular checkpoint completes
INFO: backup start archive = 00000002000000000000000B, lsn = 0/B000028
WARN: a timeline switch has occurred since the last backup, enabling delta checksum
INFO: backup file /var/lib/pgsql/11/data/base/16429/1255 (608KB, 1%) checksum e560330eb5300f7e2bcf8260f37f36660ce3a2c1
INFO: backup file /var/lib/pgsql/11/data/base/16429/2608 (448KB, 8%) checksum 53bd7995dc4d29226b1ad645995405e0a96a4a7b
. . .
INFO: diff backup size = 40.1MB
INFO: execute non-exclusive pg_stop_backup() and wait for all WAL segments to archive
INFO: backup stop archive = 00000002000000000000000B, lsn = 0/B000130
INFO: new backup label = 20190429-215508F_20190430-212258D
INFO: backup command end: completed successfully (23982ms)
INFO: expire command begin
INFO: option 'repo1-retention-archive' is not set - archive logs will not be expired
INFO: expire command end: completed successfully (14ms)

For more complex backups you can follow the pgBackRest user guide.

As we mentioned earlier, you can use the command line or the configuration files to manage your backups.

ClusterControl
Single Console for Your Entire Database Infrastructure
Find out what else is new in ClusterControl

How to Use pgBackRest in ClusterControl

Since 1.7.2 version, ClusterControl added support for pgBackRest for backing up PostgreSQL and TimescaleDB databases, so let’s see how we can use it from ClusterControl.

Creating a Backup

For this task, go to ClusterControl -> Select Cluster -> Backup -> Create Backup.

We can create a new backup or configure a scheduled one. For our example, we will create a single backup instantly.

We must choose one method, the server from which the backup will be taken, and where we want to store the backup. We can also upload our backup to the cloud (AWS, Google or Azure) by enabling the corresponding button.

In this case, we’ll choose the pgbackrestfull method to take an initial full backup. When selecting this option, we’ll see the following red note:

“During first attempt of making pgBackRest backup, ClusterControl will re-configure the node (deploys and configures pgBackRest) and after that the db node needs to be restarted first.”

So, please, take it into account for the first backup attempt.

Then we specify the use of compression and the compression level for our backup.

On the backup section, we can see the progress of the backup, and information like the method, size, location, and more.

The steps are the same to create a differential of incremental backup. We only need to choose the wanted method during the backup creation.

Restoring a Backup

Once the backup is finished, we can restore it by using ClusterControl. For this, in our backup section (ClusterControl -> Select Cluster -> Backup), we can select "Restore Backup", or directly "Restore" on the backup that we want to restore.

We have three options to restore the backup. We can restore the backup in an existing database node, restore and verify the backup on a standalone host or create a new cluster from the backup.

If we choose the Restore on Node option, we must specify the Master node, because it’s the only one writable in the cluster.

We can monitor the progress of our restore from the Activity section in our ClusterControl.

Automatic Backup Verification

A backup is not a backup if it's not restorable. Verifying backups is something that is usually neglected by many. Let’s see how ClusterControl can automate the verification of PostgreSQL and TimescaleDB backups and help avoid any surprises.

In ClusterControl, select your cluster and go to the "Backup" section, then, select “Create Backup”.

The automatic verify backup feature is available for the scheduled backups. So, let’s choose the “Schedule Backup” option.

When scheduling a backup, in addition to selecting the common options like method or storage, we also need to specify schedule/frequency.

In the next step, we can compress our backup and enable the “Verify Backup” feature.

To use this feature, we need a dedicated host (or VM) that is not part of the cluster.

ClusterControl will install the software and it’ll restore the backup in this host. After restoring, we can see the verification icon in the ClusterControl Backup section.

Recommendations

There are also some tips that we can take into account when creating our backups:

  • Store the backup on a remote location: We shouldn’t store the backup on the database server. In case of server failure, we could lose the database and the backup at the same time.
  • Keep a copy of the latest backup on the database server: This could be useful for faster recovery.
  • Use incremental/differential backups: To reduce the backup recovery time and disk space usage.
  • Backup the WALs: If we need to restore a database from the last backup, if you only restore it, you’ll lose the changes since the backup was taken until the restore time, but if we have the WALs we can apply the changes and we can use PITR.
  • Use both Logical and Physical backups: Both are necessary for different reasons, for example, if we want to restore only one database/table, we don’t need the physical backup, we only need the logical backup and it’ll be even faster that restoring the entire server.
  • Take backups from standby nodes (if it’s possible): To avoid extra load on the primary node, it’s a good practice to take the backup from the standby server.
  • Test your backups: The confirmation that the backup is done is not enough to ensure the backup is working. We should restore it on a standalone server and test it to avoid a surprise in case of failure.

Conclusion

As we could see, pgBackRest is a good option to improve our backup strategy. It helps you protect your data and it could be useful to reach the RTO by reducing the downtime in case of failure. Incremental backups can help reduce the amount of time and storage space used for the backup process. ClusterControl can help automate the backup process for your PostgreSQL and TimescaleDB databases and, in case of failure, restore it with a few clicks.

Introducing ClusterControl Spotlight Search

$
0
0

Included in the latest release, ClusterControl 1.7.2 introduces our new and exciting search functionality we’re calling “ClusterControl Spotlight.”

ClusterControl Spotlight allows you to...

  • Navigate the application faster
  • Execute any action from any page within the application
  • Discover faster new and existing features
  • Find what you are looking for faster than ever before

With ClusterControl Spotlight you will be able to speed up your daily workflow and navigate through the application; executing actions with only a few keys without leaving your keyboard.

How Does ClusterControl Spotlight Work?

ClusterControl Spotlight gives you the ability to search and quickly find your clusters and cluster actions, nodes and nodes actions and all other pages of the applications which don’t necessarily belong to a cluster.

ClusterControl Spotlight can be opened by clicking on the Search icon in the Main left navigation bar and (for your convenience) by using the shortcut - Control (or Ctrl) ⌃ + SPACE (on Mac) and CTRL + SPACE (on Windows and Linux).

Now let’s dig deeper into how Spotlight works...

Finding a Specific Node and Navigating to its Overview Page

First let’s open the ClusterControl Spotlight by clicking the shortcut mentioned above Control (or Ctrl) ⌃ + SPACE (on Mac). Right after you open “Spotlight” you will see all of your clusters listed.

Let’s select the first item in the list. You will see a list of all the nodes which are part of this cluster. At this stage you have 3 different options; select node from your cluster, execute cluster actions, or navigate to a cluster inner page. As we would like to go to the overview page of a specific node let’s select one of the nodes from that cluster.  You will then be presented with specific actions you can take with this node as well as the option to go to the overview page.

With this functionality you will be able to navigate to a specific page a lot faster than the traditional method of clicking on the menu items.

CluserControl Spotlight: Find specific node and navigate to his overview page

Executing Actions with Spotlight

In order to execute actions with Spotlight we again need to open it by clicking the Search icon on the left side menu or by shortcut combination mentioned above.

Spotlight shows contextual actions meaning if you select a cluster you will be able to see and select all the main cluster actions. (If you select a node then nodes actions will be presented.)

You could also just type the name of the action you are trying to perform and then Spotlight will list all the cluster or nodes where this action could be executed. Spotlight gives you the freedom to execute any actions from any place in ClusterControl.

ClusterControl Spotlight: Execute node actions
ClusterControl
Single Console for Your Entire Database Infrastructure
Find out what else is new in ClusterControl

Navigating to Any ClusterControl Page

Now that we have shown you how to quickly perform actions on your nodes and cluster, I would like to show you how you can go to any page, anywhere in the application. Let’s say we are in the “Backup” section of a Galera Cluster setup and we would like to go the “Schemas and Users” which lives in the “Manage” section of our Replication Cluster.

Simply open Spotlight and then select the Replication Cluster and type “Manage.” Select the manage section listed below and “voilà!” we are already there without having to move our fingers from the keyboard.

Conclusion

I would like to encourage you to try ClusterControl Spotlight as we believe with it you could execute your daily tasks much faster. The automation at the core of ClusterControl has always been there to save you time and money in your database management tasks and CC Spotlight adds an even greater way to perform more actions with speed and precision.

If you are a ClusterControl user, try it by clicking the search Icon in the left side menu or by shortcut combination - Control (or Ctrl) ⌃ + SPACE (on Mac) and CTRL + SPACE (on Windows and Linux). If you are not, what are you waiting for? Download a free trial today.

Let us know what you think of this new feature in the comments below.

What’s New in ProxySQL 2.0

$
0
0

ProxySQL is one of the best proxies out there for MySQL. It introduced a great deal of options for database administrators. It made possible to shape the database traffic by delaying, caching or rewriting queries on the fly. It can also be used to create an environment in which failovers will not affect applications and will be transparent to them. We already covered the most important ProxySQL features in previous blog posts:

We even have a tutorial covering ProxySQL showing how it can be used in MySQL and MariaDB setups.

Quite recently ProxySQL 2.0.3 has been released, being a patch release for the 2.0 series. Bugs are being fixed and the 2.0 line seems to start getting the traction it deserves. In this blog post we would like to discuss major changes introduced in ProxySQL 2.0.

Causal Reads Using GTID

Everyone who had to deal with replication lag and struggled with read-after-write scenarios that are affected by the replication lag will definitely be very happy with this feature. So far, in MySQL replication environments, the only way to ensure causal reads was to read from the master (and it doesn’t matter if you use asynchronous or semisynchronous replication). Another option was to go for Galera, which had an option for enforcing causal reads since, like, always (first it used to be wsrep-causal-reads and now it is wsrep-sync-wait). Quite recently (in 8.0.14) MySQL Group replication got similar feature. Regular replication, though, on its own, cannot deal with this issue. Luckily, ProxySQL is here and it brings us an option to define on per-query rule basis with what hostgroup reads which match that query rule should be consistent. The implementation comes with ProxySQL binlog reader and it can work with ROW binlog format for MySQL 5.7 and newer. Only Oracle MySQL is supported due to lack of required functionality in MariaDB. This feature and its technical details have been explained on ProxySQL official blog.

SSL for Frontend Connections

ProxySQL always had support for backend SSL connection but it lacked SSL encryption for the connections coming from clients. This was not that big of a deal given the recommended deployment pattern was to collocate ProxySQL on application nodes and use a secure Unix socket to connect from the app to the proxy. This is still a recommendation, especially if you use ProxySQL for caching queries (Unix sockets are faster than TCP connection, even local ones and with cache it’s good to avoid introducing unnecessary latency). What’s good is that with ProxySQL 2.0 there’s a choice now as it introduced SSL support for incoming connections. You can easily enable it by setting mysql-have_ssl to ‘true’. Enabling SSL does not come with unacceptable performance impact. Contrary, as per results from the official ProxySQL blog, the performance drop is very low.

ClusterControl
Single Console for Your Entire Database Infrastructure
Find out what else is new in ClusterControl

Native Support for Galera Cluster

Galera Cluster has been supported by ProxySQL almost since beginning but so far it was done through the external script that (typically) has been called from ProxySQL’s internal scheduler. It was up to the script to ensure that ProxySQL configuration was proper, the writer (or writers) has been correctly detected and configured in the writers hostgroup. The script was able to detect the different states Galera node may have (Primary, non-Primary, Synced, Donor/Desync, Joining, Joined) and mark the node accordingly as either available or not. The main issue is that the original script never was intended as anything other than the proof of concept written in Bash. Yet as it was distributed along with ProxySQL, it started to be improved, modified by external contributors. Others (like Percona) looked into creating their own scripts, bundled with their software. Some fixes have been introduced in the script from ProxySQL repository, some have been introduced into Percona version of the script. This led to confusion and even though all commonly used scripts handled 95% of the use cases, none of the popular ones really covered all the different situations and variables Galera cluster may end up using. Luckily, the ProxySQL 2.0 comes with native support for Galera Cluster. This makes ProxySQL support internally MySQL replication, MySQL Group Replication and now Galera Cluster. The way in how it’s done is very similar. We would like to cover the configuration of this feature as it might be not clear at the first glance.

As with MySQL replication and MySQL Group Replication, a table has been created in ProxySQL:

mysql> show create table mysql_galera_hostgroups\G
*************************** 1. row ***************************
       table: mysql_galera_hostgroups
Create Table: CREATE TABLE mysql_galera_hostgroups (
    writer_hostgroup INT CHECK (writer_hostgroup>=0) NOT NULL PRIMARY KEY,
    backup_writer_hostgroup INT CHECK (backup_writer_hostgroup>=0 AND backup_writer_hostgroup<>writer_hostgroup) NOT NULL,
    reader_hostgroup INT NOT NULL CHECK (reader_hostgroup<>writer_hostgroup AND backup_writer_hostgroup<>reader_hostgroup AND reader_hostgroup>0),
    offline_hostgroup INT NOT NULL CHECK (offline_hostgroup<>writer_hostgroup AND offline_hostgroup<>reader_hostgroup AND backup_writer_hostgroup<>offline_hostgroup AND offline_hostgroup>=0),
    active INT CHECK (active IN (0,1)) NOT NULL DEFAULT 1,
    max_writers INT NOT NULL CHECK (max_writers >= 0) DEFAULT 1,
    writer_is_also_reader INT CHECK (writer_is_also_reader IN (0,1,2)) NOT NULL DEFAULT 0,
    max_transactions_behind INT CHECK (max_transactions_behind>=0) NOT NULL DEFAULT 0,
    comment VARCHAR,
    UNIQUE (reader_hostgroup),
    UNIQUE (offline_hostgroup),
    UNIQUE (backup_writer_hostgroup))
1 row in set (0.00 sec)

There are numerous settings to configure and we will go over them one by one. First of all, there are four hostgroups:

  • Writer_hostgroup - it will contain all the writers (with read_only=0) up to the ‘max_writers’ setting. By default it is just only one writer
  • Backup_writer_hostgroup - it contains remaining writers (read_only=0) that are left after ‘max_writers’ has been added to writer_hostgroup
  • Reader_hostgroup - it contains readers (read_only=1), it may also contain backup writers, as per ‘writer_is_also_reader’ setting
  • Offline_hostgroup - it contains nodes which were deemed not usable (either offline or in a state which makes them impossible to handle traffic)

Then we have remaining settings:

  • Active - whether the entry in mysql_galera_hostgroups is active or not
  • Max_writers - how many nodes at most can be put in the writer_hostgroup
  • Writer_is_also_reader - if set to 0, writers (read_only=0) will not be put into reader_hostgroup. If set to 1, writers (read_only=0) will be put into reader_hostgroup. If set to 2, nodes from backup_writer_hostgroup will be put into reader_hostgroup. This one is a bit complex therefore we will present an example later in this blog post
  • Max_transactions_behind - based on wsrep_local_recv_queue, the max queue that’s acceptable. If queue on the node exceeds max_transactions_behind given node will be marked as SHUNNED and it will not be available for the traffic

The main surprise might be handling of the readers, which is different than how the script included in ProxySQL worked. First of all, what you have to keep in mind, is the fact, that ProxySQL uses read_only=1 to decide if node is a reader or not. This is common in replication setups, not that common in Galera. Therefore, most likely, you will want to use ‘writer_is_also_reader’ setting to configure how readers should be added to the reader_hostgroup. Let’s consider three Galera nodes, all of them have read_only=0. We also have max_writers=1 as we want to direct all the writes towards one node. We configured mysql_galera_hostgroups as follows:

SELECT * FROM mysql_galera_hostgroups\G
*************************** 1. row ***************************
       writer_hostgroup: 10
backup_writer_hostgroup: 30
       reader_hostgroup: 20
      offline_hostgroup: 40
                 active: 1
            max_writers: 1
  writer_is_also_reader: 0
max_transactions_behind: 0
                comment: NULL
1 row in set (0.00 sec)

Let’s go through all the options:

writer_is_also_reader=0

mysql> SELECT hostgroup_id, hostname FROM runtime_mysql_servers;
+--------------+------------+
| hostgroup_id | hostname   |
+--------------+------------+
| 10           | 10.0.0.103 |
| 30           | 10.0.0.101 |
| 30           | 10.0.0.102 |
+--------------+------------+
3 rows in set (0.00 sec)

This outcome is different than you would see in the scripts - there you would have remaining nodes marked as readers. Here, given that we don’t want writers to be readers and given that there is no node with read_only=1, no readers will be configured. One writer (as per max_writers), remaining nodes in backup_writer_hostgroup.

writer_is_also_reader=1

mysql> SELECT hostgroup_id, hostname FROM runtime_mysql_servers;
+--------------+------------+
| hostgroup_id | hostname   |
+--------------+------------+
| 10           | 10.0.0.103 |
| 20           | 10.0.0.101 |
| 20           | 10.0.0.102 |
| 20           | 10.0.0.103 |
| 30           | 10.0.0.101 |
| 30           | 10.0.0.102 |
+--------------+------------+
6 rows in set (0.00 sec)

Here we want our writers to act as readers therefore all of them (active and backup) will be put into the reader_hostgroup.

writer_is_also_reader=2

mysql> SELECT hostgroup_id, hostname FROM runtime_mysql_servers;
+--------------+------------+
| hostgroup_id | hostname   |
+--------------+------------+
| 10           | 10.0.0.103 |
| 20           | 10.0.0.101 |
| 20           | 10.0.0.102 |
| 30           | 10.0.0.101 |
| 30           | 10.0.0.102 |
+--------------+------------+
5 rows in set (0.00 sec)

This is a setting for those who do not want their active writer to handle reads. In this case only nodes from backup_writer_hostgroup will be used for reads. Please also keep in mind that number of readers will change if you will set max_writers to some other value. If we’d set it to 3, there would be no backup writers (all nodes would end up in the writer hostgroup) thus, again, there would be no nodes in the reader hostgroup.

Of course, you will want to configure query rules accordingly to the hostgroup configuration. We will not go through this process here, you can check how it can be done in ProxySQL blog. If you would like to test how it works in a Docker environment, we have a blog which covers how to run Galera cluster and ProxySQL 2.0 on Docker.

Other Changes

What we described above are the most notable improvements in ProxySQL 2.0. There are many others, as per the changelog. Worth mentioning are improvements around query cache (for example, addition of PROXYSQL FLUSH QUERY CACHE) and change that allows ProxySQL to rely on super_read_only to determine master and slaves in replication setup.

We hope this short overview of the changes in ProxySQL 2.0 will help you to determine which version of the ProxySQL you should use. Please keep in mind that 1.4 branch, even if it will not get any new features, it still is maintained.

Viewing all 1257 articles
Browse latest View live


<script src="https://jsc.adskeeper.com/r/s/rssing.com.1596347.js" async> </script>