Quantcast
Viewing all 1256 articles
Browse latest View live

How to Replicate PostgreSQL Data to Remote Sites

Image may be NSFW.
Clik here to view.

In a busy database environment with larger size databases, the need for real-time data replication is a common occurrence. Applications often need the production data to be replicated in real-time to remote sites for analytics and other critical business operations needs.

DBAs also need to ensure that the data is replicated continuously to the remote sites to meet various requirements. These requirements, though, may not always be to replicate the whole database; there can also be a need to replicate only a subset of the data (like a Table or set of Tables or data from multiple tables using an SQL for analytics, reporting etc.)

In this blog, we will focus on how to replicate tables to remote databases in real-time.

What is Table-Level Replication?

Table-level replication is the mechanism of replicating the data of a specific table or set of tables from one database (source) to another database (target) hosted remotely in a distributed environment. Table level replication ensures table data is distributed continuously and remains consistent across replicated (target) sites.

Why Use Table-Level Replication?

Table level replication is an essential need in larger, complex, highly distributed environments. In my experience, there was always a need to replicate a set of tables from a production database to a data warehousing for reporting purposes. The data has to be replicated continuously to ensure reports are getting the latest data. In critical environments, staleness of the data cannot be tolerated, so, the data changes happening on production must be replicated immediately to the target site. This can be a real challenge for DBA’s having to forecast various factors to ensure an efficient and smooth table replication.

Let us look at some requirements that table-level replication solves:

  • The reports can run on a database in an environment other than production, like data warehousing
  • A distributed database environment with distributed applications extracting data from multiple sites. In case of distributed web or mobile applications, the copy of the same data should be available at multiple locations to serve various application needs for which, table-level replication could be a good solution
  • Payroll applications needing the data from various databases located at different geographically distributed data-centers or cloud instances to be available at a centralized database

Various Factors Impacting Table-Level Replication - What to Look For

As we mentioned above, DBAs need to take into consideration a variety of real-time components and factors to design and implement an effective table-level replication system.

Table Structure

The type of data table is accommodating has a great impact on replication performance. If the table is accommodating a BYTEA column with larger size binary data, then, the replication performance can take a hit. The impact of replication on network, CPU and Disk must be assessed carefully.

Data Size

If the table to be migrated is too big, then, the initial data migration would take up resources and time, DBAs must ensure the production database is not impacted.

Infrastructure Resources

Infrastructure must be adequately resourced to ensure a reliable and stable performing replication system can be built. What infrastructure components must be considered?

CPUs

Data replication relies heavily on CPUs. When replicating from production, CPUs must not get exhausted which can impact the production performance.

Network

It is critical for replication performance. Network latency between Source and Target database(s) must be assessed by stress-testing to ensure there is enough bandwidth for the replication to be faster. Also, the same network could be used up by other processes or applications. So, capacity planning must be done here.

Memory

There must be adequate memory available to ensure enough data is cached for faster replication.

Source Table Updates

If the data changes on the source table are heavy, then, the replication system must have the ability to sync the changes to the remote site(s) as soon as possible. Replication will end up sending a high number of sync requests to the target database which can be resource intensive.

Type of Infrastructure (data centers or cloud) can also impact replication performance and can pose challenges. Implementing monitoring could be a challenge too. If there is a lag and certain data is missing on the target database, then, it could be difficult to monitor and it cannot be synchronous

How to Implement Table Replication

Table level replication in PostgreSQL can be implemented using a variety of external tools (commercial or open-source) which are available on the market or by using custom built data-streams.

Let us have a look at some of these tools, their features and capabilities...

Download the Whitepaper Today
 
PostgreSQL Management & Automation with ClusterControl
Learn about what you need to know to deploy, monitor, manage and scale PostgreSQL

Slony

Slony is one of the most popular tools used to asynchronously replicate specific individual table or tables in real-time from one PostgreSQL database to another one. This is a Perl based tool which performs trigger based replication of data changes of a table (or set of tables) from a database at one site to another. It is quite reliable and it has years of development history. Though highly reliable, being a trigger-based tool, it can become complex to manage the replication setups.

Let us look at some capabilities of Slony...

Advantages of Using Slony

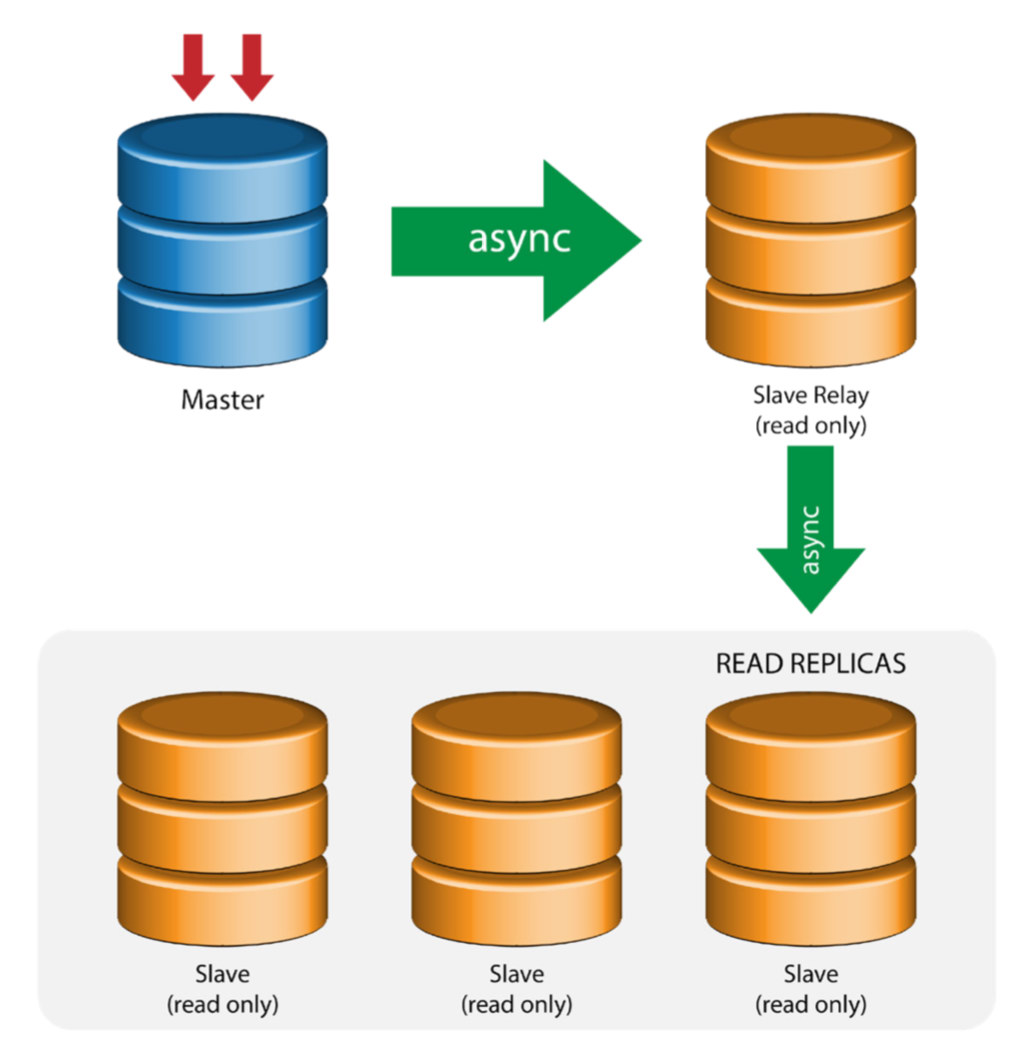
  • Supports master to slave or multiple slaves replication methodology which, helps enhance horizontal read scalability. In other words, slaves are not writable
  • Configuring Multiple slaves to a single master is possible and also supports Cascading replication methodology
  • Supports switchover and failover mechanisms
  • A high number of tables can be replicated in groups, in parallel
  • We can replicate between different major versions of PostgreSQL instances which makes Slony a great option for database upgrades
  • Simple to install

Disadvantages of Using Slony

  • Does not support DDL replication
  • Certain schema changes can break the replication
  • Replication events are logged within the database in Slony specific log tables which can pose a maintenance overhead.
  • If a huge number of tables with large data sets are to be replicated, then, performance and maintenance could pose serious challenges
  • Being a trigger based replication, the performance can be affected

Bucardo

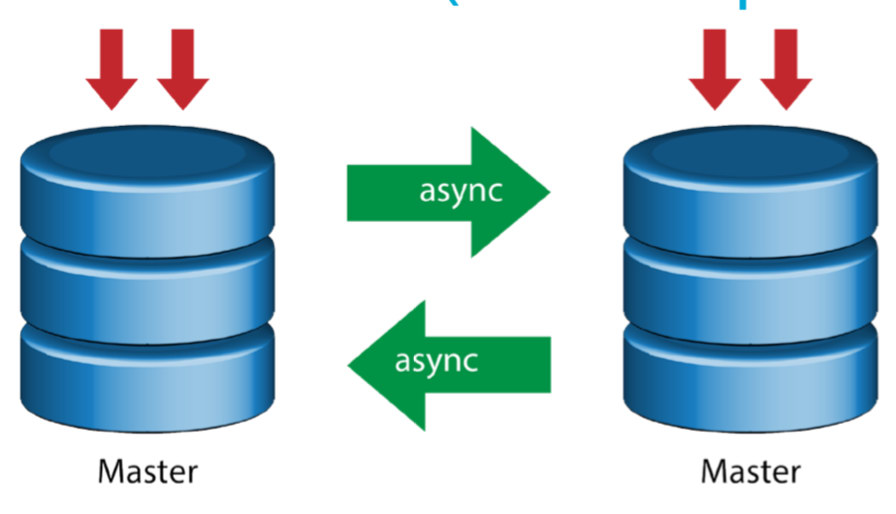
Bucardo is another open-source perl-based replication system for PostgreSQL which supports asynchronous replication of specific Table data between two or more PostgreSQL instances. What makes Bucardo different from Slony is that it also supports multi-master replication.

Let us look at different types of replication mechanisms bucardo helps implement...

  • Multi-master replication: Tables can be replicated in both directions between two or more PostgreSQL instances and the transactional data will be synced bi-directionally
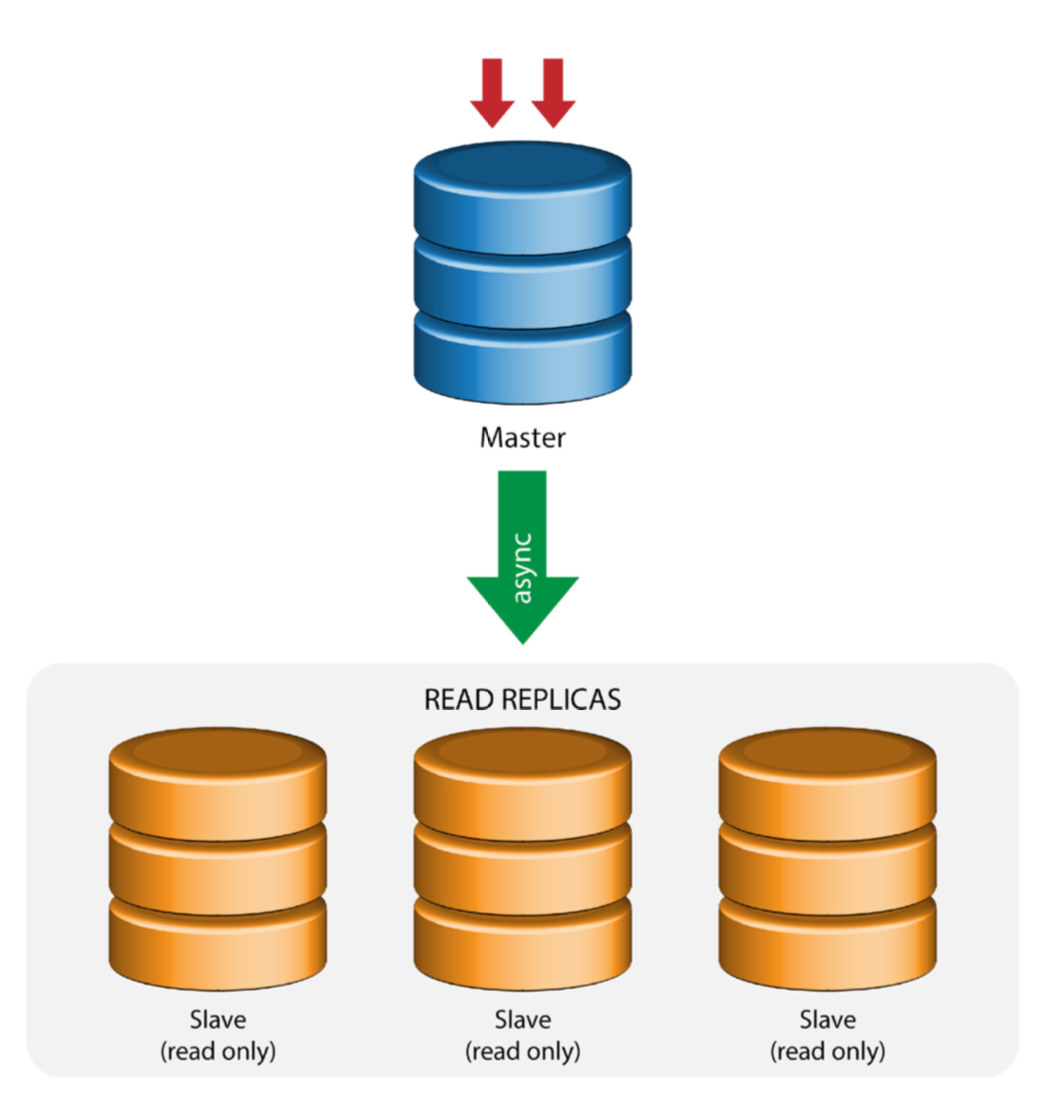
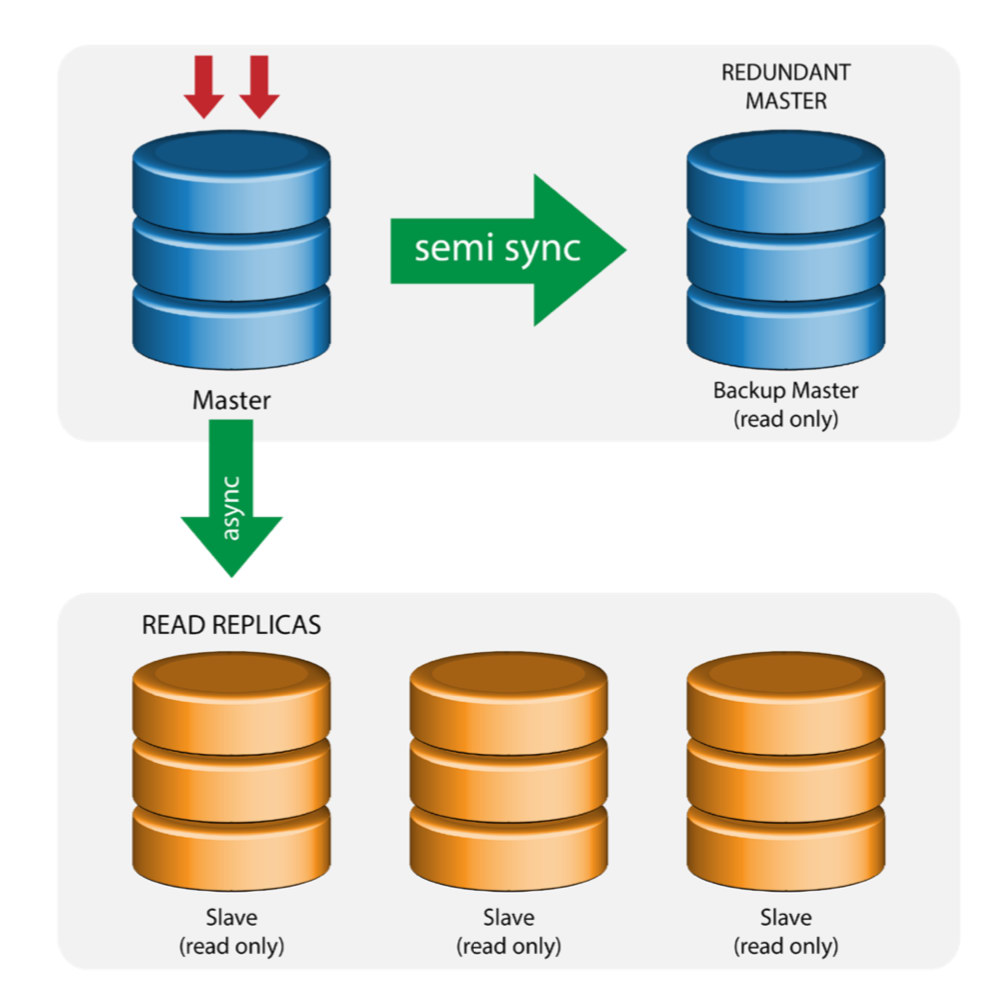
  • Master-slave: The data from tables in master will be replicated to slave asynchronously and slave is available for reading operations
  • Full copy mode (Master-slave): Bucardo -/replicate the entire data from the master to the slave node by deleting all the data from the slave

Advantages of Using Bucardo

  • Simple to install
  • Supports multi-master, master-slave and full copy replication modes
  • It can be used to upgrade databases
  • Replication can be done between different PostgreSQL versions

Disadvantages of Using Bucardo

  • Being a trigger-based replication, the performance can be a challenge
  • The schema changes like DDLs can break the replication
  • Replicating a high number of tables can pose maintenance overhead
  • The infrastructure resources must be optimized for good performing replication, otherwise, the consistency cannot be achieved.

PostgreSQL Logical Replication

Logical replication is a revolutionary built-in feature of PostgreSQL which helps to replicate individual tables via WAL records. Being a WAL based replication (similar to Streaming Replication) pg logical stands out when compared to other table replication tools. Replicating data via WAL records is always the most reliable and performant way to replicating data on the network. Almost all the tools in the market provide trigger-based replication except Logical Replication.

Advantages of Using PostgreSQL Logical Replication

  • The best option when you wish to replication a single Table or set of tables
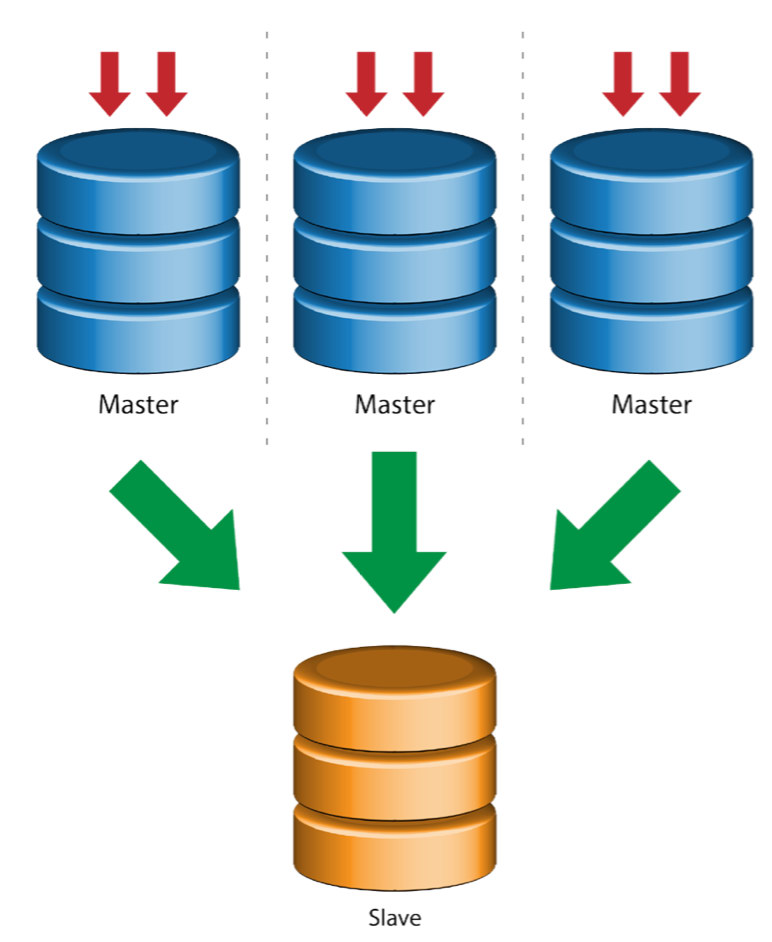
  • It is a good option If the requirement is to migrate specific tables from various databases to one single database (like data warehousing or reporting databases) for reporting or analytical purposes
  • No hassle of triggers

Disadvantages of Using PostgreSQL Logical Replication

  • Mis-management of WAL files / WAL archive files can pose challenges to Logical Replication
  • We cannot replicate tables without Primary or Unique keys
  • DDLs and TRUNCATE are not replicated
  • Replication Lag could increase if the WALs are removed. This means, the replication and WAL management must complement each other to ensure the replication does not break
  • Large objects cannot be replicated

Here are some more resources to help you better understand PostgreSQL Logical Replication and the differences between it and streaming replication.

Foreign Data Wrappers

While Foreign Data Wrappers do not actually replicate the data, I wanted to highlight this feature of PostgreSQL because it can help DBAs achieve something similar to replication without actually replicating the data. This means the data is not replicated from source to target and the data can be accessed by applications from the target database. The target database only has a table structure with a link containing Host and database details of the source table and when application query the target table, then, the data is pulled over from the source database to the target database similar to Database Links. If FDWs can help, then, you can entirely avoid the overhead of replicating the data over the network. Many times we do get into a situation where reports can be executed on a remote target database without needing the data to be present physically.

FDWs are a great option in the following situations -

  • If you have small and static tables in the source database, then, it is not really worth replicating the data over
  • Can be really beneficial, If you have really big tables in the source database and you are running aggregate queries on the target database.

Advantages of Using Foreign Data Wrappers

  • Replicating data can be completely avoided which can save time and resources
  • Simple to implement
  • Data pulled over is always the latest
  • No maintenance over head

Disadvantages of Using Foreign Data Wrappers

  • Structural changes on the source table can impact application functionality on the target database
  • Heavily relies on the network and can have a significant network overhead depending on the type of reports being run
  • Performance overhead is expected when the queries are executed a several number of times as each time query is executed, the data must be pulled over the network from the source database and also can pose performance overhead on the source database
  • Any load on the source can impact the performance of applications on the target database

Conclusion

  • Replicating tables can serve various critical purposes for business
  • Can support distributed parallel querying in distributed environments
  • Implementing synchronous is nearly impossible
  • Infrastructure must be adequately capacitated which involves costs
  • A great option to build an integrated centralized database for reporting and analytical purposes

Configuring PostgreSQL for Business Continuity

Image may be NSFW.
Clik here to view.

Business Continuity for Databases

Business continuity for databases means databases must be continuously operational even during the disasters. It is imperative to ensure that production databases are available for the applications all the time even during the disasters, otherwise, could end-up being an expensive deal. DBAs, Architects would need to ensure that database environments can sustain disasters and are disaster recovery SLA compliant. To ensure disasters does not affect database availability, databases must be configured for business continuity.

Configuring databases for business continuity involves a lot of architecting, planning, designing and testing. A lot of factors like data centers and their geographic territories including infrastructure design come into consideration when it comes to designing and implementing an effective disaster recovery strategy for databases. That explains the fact that “Business Continuity = Avoid outages during disasters”.

To ensure production databases survive a disaster, a Disaster Recovery (DR) site must be configured. Production and DR sites must be part of two geographically distant Data Centres. This means, a standby database must be configured at the DR site for every production database so that, the data changes occurring on production database are immediately synced across to the standby database via transaction logs. This can be achieved by “Streaming Replication” capability in PostgreSQL.

What Needs to Happen if Disaster Strikes Production (or Primary) Database?

When production (primary) database crashes or becomes unresponsive, standby database must be promoted to primary and the applications must be pointed to newly promoted standby (new primary) database and all of it must happen automatically within the designated outage SLA. This process is termed as failover.

Configuring PostgreSQL for High Availability

As said above, to ensure that the PostgreSQL is disaster recovery compliant, it must be first configured with Streaming Replication (master + standby database) and with automatic standby promotion/ failover capabilities. Let us look at how to configure streaming replication first and followed by the “failover” process.

Configuring Standby Database (Streaming Replication)

Streaming replication is the in-built feature of PostgreSQL which ensures data is replicated from Primary to Standby database via WAL records and supports both Asynchronous and Synchronous replication methods. This way of replicating is quite reliable and suitable for environments demanding real-time and highly performant replication.

Configuring streaming standby is pretty simple. The first step is to ensure that primary database configurations are as follows:

Primary Database Mandatory Configurations

Ensure the following parameters are configured in postgresql.conf on the primary database. Doing the following changes would require a database restart.

wal_level=logical

wal_level parameter ensures that the information required for replication is written to the WAL files.

max_wal_senders=1 (or any number more than 0)

WAL records are shipped by wal sender process from the primary database to the standby database. So, the above parameter must be configured to minimum 1. More than a value of 1 is required when multiple wal senders are required.

Enable WAL Archiving

There is no hard dependency on WAL Archiving for streaming replication. However, it is strongly recommended to configure WAL Archiving because, if the standby lags behind and if the required WAL files are removed from the pg_xlog (or pg_wal) directory, then, Archive files will be required to get the standby in sync with the primary if not, the standby must be rebuilt from scratch.

archive_mode=on
archive_command=<archive location>

Primary database must be configured to accept connections from standby.

Below configuration must be there in pg_hba.conf

host    replication     postgres        <standby-database-host-ip>/32            trust

Now, take a backup of the primary database and restore the same on the DR site. Once done with the restoration, build the recovery.conf file in the data directory with the below contents:

standby_mode=’on’
primary_conninfo=’host=<master-database-host-ip>, port=<master-database-port>, user=<replication-user>’
restore_command=’cp /database/wal_restore/%f %p’
trigger_file=’/database/promote_trigfile’
recovery_target_timeline=’latest’

Now, start the standby database. The streaming replication must be enabled. The below message in the postgresql log file of standby database confirms that streaming replication is succesfully working:

2018-01-13 00:22:44 AEDT [4432]: [1] user=,db=,app=,client= LOG:  started streaming WAL from primary at 127/CD000000 on timeline 1
2018-01-13 00:22:44 AEDT [4268]: [5] user=,db=,app=,client= LOG:  redo starts at 127/CD380170

That concludes that a fully functional streaming replication is in place. Next step to install/configure repmgr. Before that, let us understand the failover process.

Download the Whitepaper Today
 
PostgreSQL Management & Automation with ClusterControl
Learn about what you need to know to deploy, monitor, manage and scale PostgreSQL

What is Failover?

Failover occurs when the primary database becomes completely unavailable due to a disaster. During the failover process, the Standby database will be promoted to become a new primary database so that applications can continue the business operations.

Automatic Failover

The whole failover process has to happen automatically to ensure effective business continuity is in place and this can only be achieved by some middleware tools. The whole idea is to avoid a manual intervention of DBAs, Developers.

One such tool which helps perform automatic failover is “repmgr”.

Let us take a look at repmgr and its capabilities.

Repmgr

Repmgr is an opensource tool developed by 2nd Quadrant. This tool helps to perform various database administrative activities like building and monitoring PostgreSQL replication including performing automated failover activities in the event of a disaster and also helps to perform switchover operations.

Repmgr is an easy to install tool and the configurations are not complex as well. Let us take a look at installation first:

Installing repmgr

Download the tool from here.

Untar the tarball and perform the installation as shown below:

I have installed repmgr-4.2.0 on a CentOS 7 host and I have installed repmgr against PostgreSQL-11.1.Before installation ensure PostgreSQL bin directory is part of $PATH and the PostgreSQL lib directory is part of $LD_LIBRARY_PATH. To understand that the repmgr is installed against PostgreSQL-11.1, I am displaying the “make install” output below:

[root@buildhost repmgr-4.2.0]# ./configure --prefix=/opt/repmgr-4.2
[root@buildhost repmgr-4.2.0]# make
[root@buildhost repmgr-4.2.0]# make install
Building against PostgreSQL 11
/bin/mkdir -p '/opt/pgsql-11.1/lib'
/bin/mkdir -p '/opt/pgsql-11.1/share/extension'
/bin/mkdir -p '/opt/pgsql-11.1/bin'
/bin/install -c -m 755  repmgr.so '/opt/pgsql-11.1/lib/repmgr.so'
/bin/install -c -m 644 .//repmgr.control '/opt/pgsql-11.1/share/extension/'
/bin/install -c -m 644 .//repmgr--unpackaged--4.0.sql .//repmgr--4.0.sql .//repmgr--4.0--4.1.sql .//repmgr--4.1.sql .//repmgr--4.1--4.2.sql .//repmgr--4.2.sql  '/opt/pgsql-11.1/share/extension/'
/bin/install -c -m 755 repmgr repmgrd '/opt/pgsql-11.1/bin/'

Configuring repmgr for Automatic Failover

Before looking at configuring “repmgr”, the databases must be configured with streaming replication which we have seen earlier. To start with, both the databases (primary and standby) must be configured with the following parameter in postgresql.conf:

Primary

[postgres@buildhost log]$ grep "shared_preload" /data/pgdata11/postgresql.conf
shared_preload_libraries = 'repmgr'     # (change requires restart)

Standby

[postgres@buildhost log]$ grep "shared_preload" /data/pgdata-standby11/postgresql.conf
shared_preload_libraries = 'repmgr'     # (change requires restart)

The above parameter is to enable “repmgrd” daemon which, continuously runs in the background and monitors the streaming replication. Without this parameter, it is not possible to perform automatic failover. Changing this parameter would need a database restart.
Next, build the repmgr configuration file (say with the name repmgr.conf) for both the databases. Primary database must have a configuration file with the following contents:

node_id=1
node_name=node1
conninfo='host=xxx.xxx.xx.xx user=postgres dbname=postgres connect_timeout=2'
data_directory='/data/pgdata11'

Place the file in the data directory, in this case, it is “/data/pgdata11”.

Standby database configuration file must have the following contents:

node_id=2
node_name=node2
conninfo='host=xxx.xxx.xx.xx user=postgres dbname=postgres port=6432 connect_timeout=2'
data_directory='/data/pgdata-standby11'

failover=automatic
promote_command='repmgr standby promote -f /data/pgdata-standby11/repmgr.conf'
follow_command='repmgr standby follow -f /data/pgdata-standby11/repmgr.conf --upstream-node-id=%n'

monitoring_history=yes
monitor_interval_secs=5

log_file='/data/pgdata-standby11/repmgr_logs/repmgr.log'
log_status_interval=5
log_level=DEBUG

promote_check_timeout=5
promote_check_interval=1

master_response_timeout=5
reconnect_attempts=5
reconnect_interval=10

Both the databases must be registered with repmgr.
Register Primary database

[postgres@buildhost pgdata-standby11]$ repmgr -f /data/pgdata11/repmgr.conf primary register
INFO: connecting to primary database...
NOTICE: attempting to install extension "repmgr"
NOTICE: "repmgr" extension successfully installed
NOTICE: primary node record (id: 1) registered

Register Standby Database

[postgres@buildhost pgdata-standby11]$ repmgr -f /data/pgdata-standby11/repmgr.conf standby register --upstream-node-id=1
INFO: connecting to local node "node2" (ID: 2)
INFO: connecting to primary database
INFO: standby registration complete
NOTICE: standby node "node2" (id: 2) successfully registered

Run the below command to ensure repmgr logging is working.

[postgres@buildhost ~]$ repmgrd -f /data/pgdata-standby11/repmgr.conf --verbose --monitoring-history
[2019-02-16 16:31:26] [NOTICE] using provided configuration file "/data/pgdata-standby11/repmgr.conf"
[2019-02-16 16:31:26] [WARNING] master_response_timeout/5: unknown name/value pair provided; ignoring
[2019-02-16 16:31:26] [NOTICE] redirecting logging output to "/data/pgdata-standby11/repmgr_logs/repmgr.log"

If you can observe, I have configured log_level to DEBUG to generate detailed logging in the standby’s repmgr.conf file. Check the logs for replication status.
Check if the replication is working as expected using repmgr:

[postgres@buildhost pgdata-standby11]$ repmgr -f /data/pgdata-standby11/repmgr.conf cluster show
 ID | Name  | Role    | Status    | Upstream | Location | Connection string
----+-------+---------+-----------+----------+----------+-------------------------------------------------------------------------------
 1  | node1 | primary | * running |          | default  | host=xxx.xxx.xx.xx user=postgres dbname=postgres connect_timeout=2
 2  | node2 | standby |   running | node1    | default  | host=xxx.xxx.xx.xx user=postgres dbname=postgres port=6432 connect_timeout=2

The above message confirms replication is running fine.

Now, if I shutdown the primary database, repmgrd daemon should detect the failure of the primary database and should promote the standby database. Let us see if that happens -The primary database is stopped:

[postgres@buildhost ~]$ pg_ctl -D /data/pgdata-standby11 stop
waiting for server to shut down.... done
server stopped

The standby database must be promoted automatically. The repmgr logs would show the same:

fallback_application_name=repmgr is 2
[2019-02-14 17:09:23] [WARNING] unable to reconnect to node 1 after 5 attempts
[2019-02-14 17:09:23] [DEBUG] is_server_available(): ping status for host=xxx.xxx.xx.xx user=postgres dbname=postgres port=6432 connect_timeout=2 is 0
[2019-02-14 17:09:23] [DEBUG] do_election(): electoral term is 1
[2019-02-14 17:09:23] [DEBUG] get_active_sibling_node_records():
  SELECT n.node_id, n.type, n.upstream_node_id, n.node_name, n.conninfo, n.repluser, n.slot_name, n.location, n.priority, n.active, n.config_file, '' AS upstream_node_name     FROM repmgr.nodes n    WHERE n.upstream_node_id = 1      AND n.node_id != 2      AND n.active IS TRUE ORDER BY n.node_id
[2019-02-14 17:09:23] [DEBUG] clear_node_info_list() - closing open connections
[2019-02-14 17:09:23] [DEBUG] clear_node_info_list() - unlinking
[2019-02-14 17:09:23] [DEBUG] do_election(): primary location is "default", standby location is "default"
[2019-02-14 17:09:23] [DEBUG] no other nodes - we win by default
[2019-02-14 17:09:23] [DEBUG] election result: WON
[2019-02-14 17:09:23] [NOTICE] this node is the only available candidate and will now promote itself
[2019-02-14 17:09:23] [DEBUG] get_node_record():
  SELECT n.node_id, n.type, n.upstream_node_id, n.node_name, n.conninfo, n.repluser, n.slot_name, n.location, n.priority, n.active, n.config_file, '' AS upstream_node_name   FROM repmgr.nodes n  WHERE n.node_id = 1
[2019-02-14 17:09:23] [INFO] promote_command is:
  "repmgr standby promote -f /data/pgdata-standby11/repmgr.conf"
WARNING: master_response_timeout/5: unknown name/value pair provided; ignoring
DEBUG: connecting to: "user=postgres connect_timeout=2 dbname=postgres host=xxx.xxx.xx.xx port=6432 fallback_application_name=repmgr"
DEBUG: connecting to: "user=postgres connect_timeout=2 dbname=postgres host=xxx.xxx.xx.xx fallback_application_name=repmgr"
DEBUG: connecting to: "user=postgres connect_timeout=2 dbname=postgres host=xxx.xxx.xx.xx port=6432 fallback_application_name=repmgr"
NOTICE: promoting standby to primary
DETAIL: promoting server "node2" (ID: 2) using "pg_ctl  -w -D '/data/pgdata-standby11' promote"
DETAIL: waiting up to 5 seconds (parameter "promote_check_timeout") for promotion to complete
DEBUG: setting node 2 as primary and marking existing primary as failed
NOTICE: STANDBY PROMOTE successful
DETAIL: server "node2" (ID: 2) was successfully promoted to primary

The above precisely means, repmgr was unable to connect to the primary database and after unsuccessful 5 attempts, the standby is promoted to the new primary database. Below is what shows up the promoted standby (new primary) database logs:


2019-02-14 17:09:21 AEDT [20789]: [1] user=,db=,app=,client= FATAL:  could not connect to the primary server: could not connect to server: Connection refused
                Is the server running on host "xxx.xxx.xx.xx" and accepting
                TCP/IP connections on port 5432?
2019-02-14 17:09:23 AEDT [20506]: [7] user=,db=,app=,client= LOG:  received promote request
2019-02-14 17:09:23 AEDT [20506]: [8] user=,db=,app=,client= LOG:  redo done at 10F/5A335FF0
2019-02-14 17:09:23 AEDT [20506]: [9] user=,db=,app=,client= LOG:  last completed transaction was at log time 2019-02-14 17:08:38.350695+11
2019-02-14 17:09:23 AEDT [20506]: [10] user=,db=,app=,client= LOG:  selected new timeline ID: 2
2019-02-14 17:09:23 AEDT [20506]: [11] user=,db=,app=,client= LOG:  archive recovery complete
2019-02-14 17:09:24 AEDT [20507]: [1] user=,db=,app=,client= LOG:  checkpoint starting: force
2019-02-14 17:09:24 AEDT [20504]: [7] user=,db=,app=,client= LOG:  database system is ready to accept connections

I have only mentioned the important parameters in the repmgr configuration file. There are a lot of other parameters which can be modified to meet various requirements. The other important parameters are replication_lag_* parameters as shown below:

#replication_lag_warning=300            # repmgr node check --replication-lag
#replication_lag_critical=600           #

Repmgr would check the thresholds of above parameters before promoting standby. If replication lag is critical then, the promotion will not go-ahead. Which is really good because if standby gets promoted when there is a lag that would result in a data loss.

The applications must ensure they reconnect to newly promoted standby successfully with-in the expected timeframe. The load balancers would have the capability of diverting the app connections when the primary database becomes unresponsive. The other alternative would be using middleware tools like PgPool-II to ensure all the connections are diverted successfully.

To ensure successful high-availability architecture is deployed in production, thorough end-to-end testing of the complete process must be performed. In my experience, we use to term this exercise as DR DRILL. Meaning, every 6 months or so, a switchover operation would be performed to ensure standby is successfully getting promoted and the app connections are reconnecting to the promoted standby successfully. The existing primary will become a new standby. Once the switchover operation is successful, metrics are taken down to see SLAs are met.

What is Switchover?

As explained above, Switchover is a planned activity wherein the roles of Primary and Standby database are switched over. Meaning, Standby will become primary and primary will become standby. Using repmgr, this can be achieved. Below is what repmgr does when switchover command is issued.

$ repmgr -f /etc/repmgr.conf standby switchover
    NOTICE: executing switchover on node "node2" (ID: 2)
    INFO: searching for primary node
    INFO: checking if node 1 is primary
    INFO: current primary node is 1
    INFO: SSH connection to host "node1" succeeded
    INFO: archive mode is "off"
    INFO: replication lag on this standby is 0 seconds
    NOTICE: local node "node2" (ID: 2) will be promoted to primary; current primary "node1" (ID: 1) will be demoted to standby
    NOTICE: stopping current primary node "node1" (ID: 1)
    NOTICE: issuing CHECKPOINT
    DETAIL: executing server command "pg_ctl -D '/data/pgdata11' -m fast -W stop"
    INFO: checking primary status; 1 of 6 attempts
    NOTICE: current primary has been cleanly shut down at location 0/0501460
    NOTICE: promoting standby to primary
    DETAIL: promoting server "node2" (ID: 2) using "pg_ctl -D '/data/pgdata-standby11' promote"
    server promoting
    NOTICE: STANDBY PROMOTE successful
    DETAIL: server "node2" (ID: 2) was successfully promoted to primary
    INFO: setting node 1's primary to node 2
    NOTICE: starting server using  "pg_ctl -D '/data/pgdata11' restart"
    NOTICE: NODE REJOIN successful
    DETAIL: node 1 is now attached to node 2
    NOTICE: switchover was successful
    DETAIL: node "node2" is now primary
    NOTICE: STANDBY SWITCHOVER is complete

What Else repmgr Can Do?

  • Repmgr can help build the standby databases from scratch
  • Multiple standby databases can be built with one master running
  • Cascading standby’s can be built which I feel is more beneficial than configuring multiple standbys to one master database

What if Both Primary and Standby Are Gone?

Well, this is a situation wherein business think about having multiple standby instances. If all of them are gone, then, the only way out is to restore the database from the backups. This is the reason why a good backup strategy is imperative. The backups must be test-restored, validated on regular basis to ensure backups are reliable. Infrastructure design for backups must be such that, restoration and recovery of the backups must not take long. The restoration and recovery process of the backups must be completed within the designated SLA. SLAs for backups are designed in terms of RTO (Recovery Time Objective) and RPO (Recovery Point Objective). Meaning, RTO: time taken to restore and recover the backup must be with-in the SLA and RPO: till what point in time the recovery was done must be acceptable, in other terms it is data loss tolerance and generally businesses say 0 data loss tolerance.

Conclusion

  • Business continuity for PostgreSQL is an important requirement for mission-critical database environments. Achieving this involves a lot of planning and costs.
  • Resources and Infrastructure must be optimally utilized to ensure an efficient disaster recovery strategy is in place.
  • There could challenges from costs perspective which needs to be taken care
  • If the budget permits, ensure there are multiple DR sites to failover
  • In-case the backups are to be restored, ensure a good backup strategy is in place.

Selling Your Boss on the Value of Database Automation

Image may be NSFW.
Clik here to view.

It’s a tough position to be in. You’re a DBA who doesn’t want to risk your job by introducing an automation solution. Or maybe a DevOps or SysAdmin who is being asked to run the database show but don’t really have the specialized skills. Either option you are asking to spend money on something that she says “isn’t that your job?” With so many tasks to manage and only so many hours in a day, it is getting harder to do the most crucial job you are tasked with - protect the data.

In this webinar we will explore the real value of database automation and how it can enable both of the scenarios above to show the powers that be that automation will save their companies time and money as well as build a strong platform of reliability and stability.

Image: 
Image may be NSFW.
Clik here to view.
Agenda: 
  • Understanding the Database World
    • Closed vs Open Source
  • What is Database Automation?
  • The Real Cost of Free
  • The Cost of Downtime
  • Managing Databases Comparison
    • DIY with Multiple Tools & Utilities
    • Database Support Model
    • Total Cost of Ownership
  • What Can Automation Do?
    • A Demonstration of Automated Database Deployment
    • A Demonstration of Automated Failover
    • A Demonstration of How to Automate Backup MExplanagement
Date & Time v2: 
Tuesday, April 23, 2019 - 16:00 to 17:15

Sell You Boss on the Value of Database Automation

Image may be NSFW.
Clik here to view.

It’s a tough position to be in. You’re a DBA who doesn’t want to risk your job by introducing an automation solution. Or maybe a DevOps or SysAdmin who is being asked to run the database show but don’t really have the specialized skills. Either option you are asking to spend money on something that she says “isn’t that your job?” With so many tasks to manage and only so many hours in a day, it is getting harder to do the most crucial job you are tasked with - protect the data.

In this webinar we will explore the real value of database automation and how it can enable both of the scenarios above to show the powers that be that automation will save their companies time and money as well as build a strong platform of reliability and stability.

Date, Time & Registration

One Global Session

Tuesday, April 23rd at 4:00 CET (Germany, France, Sweden) / 10:00AM EST (US)

Register Now

Agenda

  • Understanding the Database World
    • Closed vs Open Source
  • What is Database Automation?
  • The Real Cost of Free
  • The Cost of Downtime
  • Managing Databases Comparison
    • DIY with Multiple Tools & Utilities
    • Database Support Model
    • Total Cost of Ownership
  • What Can Automation Do?
    • A demonstration of automated database deployment
    • A demonstration of automated failover
    • A demonstration of how to automate backup management

Speakers

Image may be NSFW.
Clik here to view.

Forrest Lymburner is a Marketing Manager at Severalnines. He is responsible for developing programs to educate visitors on the value of database automation and why they should utilize products like ClusterControl to monitor and manage their database environments. With nearly twenty years in the marketing world at companies like RadioShack, Texas Instruments, Rackspace, Dell, etc; Forrest has worked in a variety of industries developing strategies and building programs to increase brand awareness and user adoption. Forrest is an avid Sci-Fan, PC Gamer, world traveler and regularly attends comic con events.

Image may be NSFW.
Clik here to view.

Bartlomiej Oles is a MySQL and Oracle DBA, with over 15 years experience in managing highly available production systems at IBM, Nordea Bank, Acxiom, Lufthansa, and other Fortune 500 companies. In the past five years, his focus has been on building and applying automation tools to manage multi-datacenter database environments.

We look forward to “seeing” you there!

How to Run and Configure ProxySQL 2.0 for MySQL Galera Cluster on Docker

Image may be NSFW.
Clik here to view.

ProxySQL is an intelligent and high-performance SQL proxy which supports MySQL, MariaDB and ClickHouse. Recently, ProxySQL 2.0 has become GA and it comes with new exciting features such as GTID consistent reads, frontend SSL, Galera and MySQL Group Replication native support.

It is relatively easy to run ProxySQL as Docker container. We have previously written about how to run ProxySQL on Kubernetes as a helper container or as a Kubernetes service, which is based on ProxySQL 1.x. In this blog post, we are going to use the new version ProxySQL 2.x which uses a different approach for Galera Cluster configuration.

ProxySQL 2.x Docker Image

We have released a new ProxySQL 2.0 Docker image container and it's available in Docker Hub. The README provides a number of configuration examples particularly for Galera and MySQL Replication, pre and post v2.x. The configuration lines can be defined in a text file and mapped into the container's path at /etc/proxysql.cnf to be loaded into ProxySQL service.

The image "latest" tag still points to 1.x until ProxySQL 2.0 officially becomes GA (we haven't seen any official release blog/article from ProxySQL team yet). Which means, whenever you install ProxySQL image using latest tag from Severalnines, you will still get version 1.x with it. Take note the new example configurations also enable ProxySQL web stats (introduced in 1.4.4 but still in beta) - a simple dashboard that summarizes the overall configuration and status of ProxySQL itself.

ProxySQL 2.x Support for Galera Cluster

Let's talk about Galera Cluster native support in greater detail. The new mysql_galera_hostgroups table consists of the following fields:

  • writer_hostgroup: ID of the hostgroup that will contain all the members that are writers (read_only=0).
  • backup_writer_hostgroup: If the cluster is running in multi-writer mode (i.e. there are multiple nodes with read_only=0) and max_writers is set to a smaller number than the total number of nodes, the additional nodes are moved to this backup writer hostgroup.
  • reader_hostgroup: ID of the hostgroup that will contain all the members that are readers (i.e. nodes that have read_only=1)
  • offline_hostgroup: When ProxySQL monitoring determines a host to be OFFLINE, the host will be moved to the offline_hostgroup.
  • active: a boolean value (0 or 1) to activate a hostgroup
  • max_writers: Controls the maximum number of allowable nodes in the writer hostgroup, as mentioned previously, additional nodes will be moved to the backup_writer_hostgroup.
  • writer_is_also_reader: When 1, a node in the writer_hostgroup will also be placed in the reader_hostgroup so that it will be used for reads. When set to 2, the nodes from backup_writer_hostgroup will be placed in the reader_hostgroup, instead of the node(s) in the writer_hostgroup.
  • max_transactions_behind: determines the maximum number of writesets a node in the cluster can have queued before the node is SHUNNED to prevent stale reads (this is determined by querying the wsrep_local_recv_queue Galera variable).
  • comment: Text field that can be used for any purposes defined by the user

Here is an example configuration for mysql_galera_hostgroups in table format:

Admin> select * from mysql_galera_hostgroups\G
*************************** 1. row ***************************
       writer_hostgroup: 10
backup_writer_hostgroup: 20
       reader_hostgroup: 30
      offline_hostgroup: 9999
                 active: 1
            max_writers: 1
  writer_is_also_reader: 2
max_transactions_behind: 20
                comment: 

ProxySQL performs Galera health checks by monitoring the following MySQL status/variable:

  • read_only - If ON, then ProxySQL will group the defined host into reader_hostgroup unless writer_is_also_reader is 1.
  • wsrep_desync - If ON, ProxySQL will mark the node as unavailable, moving it to offline_hostgroup.
  • wsrep_reject_queries - If this variable is ON, ProxySQL will mark the node as unavailable, moving it to the offline_hostgroup (useful in certain maintenance situations).
  • wsrep_sst_donor_rejects_queries - If this variable is ON, ProxySQL will mark the node as unavailable while the Galera node is serving as an SST donor, moving it to the offline_hostgroup.
  • wsrep_local_state - If this status returns other than 4 (4 means Synced), ProxySQL will mark the node as unavailable and move it into offline_hostgroup.
  • wsrep_local_recv_queue - If this status is higher than max_transactions_behind, the node will be shunned.
  • wsrep_cluster_status - If this status returns other than Primary, ProxySQL will mark the node as unavailable and move it into offline_hostgroup.

Having said that, by combining these new parameters in mysql_galera_hostgroups together with mysql_query_rules, ProxySQL 2.x has the flexibility to fit into much more Galera use cases. For example, one can have a single-writer, multi-writer and multi-reader hostgroups defined as the destination hostgroup of a query rule, with the ability to limit the number of writers and finer control on the stale reads behaviour.

Contrast this to ProxySQL 1.x, where the user had to explicitly define a scheduler to call an external script to perform the backend health checks and update the database servers state. This requires some customization to the script (user has to update the ProxySQL admin user/password/port) plus it depended on an additional tool (MySQL client) to connect to ProxySQL admin interface.

Here is an example configuration of Galera health check script scheduler in table format for ProxySQL 1.x:

Admin> select * from scheduler\G
*************************** 1. row ***************************
         id: 1
     active: 1
interval_ms: 2000
   filename: /usr/share/proxysql/tools/proxysql_galera_checker.sh
       arg1: 10
       arg2: 20
       arg3: 1
       arg4: 1
       arg5: /var/lib/proxysql/proxysql_galera_checker.log
    comment:

Besides, since ProxySQL scheduler thread executes any script independently, there are many versions of health check scripts available out there. All ProxySQL instances deployed by ClusterControl uses the default script provided by the ProxySQL installer package.

In ProxySQL 2.x, max_writers and writer_is_also_reader variables can determine how ProxySQL dynamically groups the backend MySQL servers and will directly affect the connection distribution and query routing. For example, consider the following MySQL backend servers:

Admin> select hostgroup_id, hostname, status, weight from mysql_servers;
+--------------+--------------+--------+--------+
| hostgroup_id | hostname     | status | weight |
+--------------+--------------+--------+--------+
| 10           | DB1          | ONLINE | 1      |
| 10           | DB2          | ONLINE | 1      |
| 10           | DB3          | ONLINE | 1      |
+--------------+--------------+--------+--------+

Together with the following Galera hostgroups definition:

Admin> select * from mysql_galera_hostgroups\G
*************************** 1. row ***************************
       writer_hostgroup: 10
backup_writer_hostgroup: 20
       reader_hostgroup: 30
      offline_hostgroup: 9999
                 active: 1
            max_writers: 1
  writer_is_also_reader: 2
max_transactions_behind: 20
                comment: 

Considering all hosts are up and running, ProxySQL will most likely group the hosts as below:

Image may be NSFW.
Clik here to view.

Let's look at them one by one:

ConfigurationDescription
writer_is_also_reader=0
  • Groups the hosts into 2 hostgroups (writer and backup_writer).
  • Writer is part of the backup_writer.
  • Since the writer is not a reader, nothing in hostgroup 30 (reader) because none of the hosts are set with read_only=1. It is not a common practice in Galera to enable the read-only flag.
writer_is_also_reader=1
  • Groups the hosts into 3 hostgroups (writer, backup_writer and reader).
  • Variable read_only=0 in Galera has no affect thus writer is also in hostgroup 30 (reader)
  • Writer is not part of backup_writer.
writer_is_also_reader=2
  • Similar with writer_is_also_reader=1 however, writer is part of backup_writer.

With this configuration, one can have various choices for hostgroup destination to cater for specific workloads. "Hotspot" writes can be configured to go to only one server to reduce multi-master conflicts, non-conflicting writes can be distributed equally on the other masters, most reads can be distributed evenly on all MySQL servers or non-writers, critical reads can be forwarded to the most up-to-date servers and analytical reads can be forwarded to a slave replica.

ProxySQL Deployment for Galera Cluster

In this example, suppose we already have a three-node Galera Cluster deployed by ClusterControl as shown in the following diagram:

Image may be NSFW.
Clik here to view.

Our Wordpress applications are running on Docker while the Wordpress database is hosted on our Galera Cluster running on bare-metal servers. We decided to run a ProxySQL container alongside our Wordpress containers to have a better control on Wordpress database query routing and fully utilize our database cluster infrastructure. Since the read-write ratio is around 80%-20%, we want to configure ProxySQL to:

  • Forward all writes to one Galera node (less conflict, focus on write)
  • Balance all reads to the other two Galera nodes (better distribution for the majority of the workload)

Firstly, create a ProxySQL configuration file inside the Docker host so we can map it into our container:

$ mkdir /root/proxysql-docker
$ vim /root/proxysql-docker/proxysql.cnf

Then, copy the following lines (we will explain the configuration lines further down):

datadir="/var/lib/proxysql"

admin_variables=
{
    admin_credentials="admin:admin"
    mysql_ifaces="0.0.0.0:6032"
    refresh_interval=2000
    web_enabled=true
    web_port=6080
    stats_credentials="stats:admin"
}

mysql_variables=
{
    threads=4
    max_connections=2048
    default_query_delay=0
    default_query_timeout=36000000
    have_compress=true
    poll_timeout=2000
    interfaces="0.0.0.0:6033;/tmp/proxysql.sock"
    default_schema="information_schema"
    stacksize=1048576
    server_version="5.1.30"
    connect_timeout_server=10000
    monitor_history=60000
    monitor_connect_interval=200000
    monitor_ping_interval=200000
    ping_interval_server_msec=10000
    ping_timeout_server=200
    commands_stats=true
    sessions_sort=true
    monitor_username="proxysql"
    monitor_password="proxysqlpassword"
    monitor_galera_healthcheck_interval=2000
    monitor_galera_healthcheck_timeout=800
}

mysql_galera_hostgroups =
(
    {
        writer_hostgroup=10
        backup_writer_hostgroup=20
        reader_hostgroup=30
        offline_hostgroup=9999
        max_writers=1
        writer_is_also_reader=1
        max_transactions_behind=30
        active=1
    }
)

mysql_servers =
(
    { address="db1.cluster.local" , port=3306 , hostgroup=10, max_connections=100 },
    { address="db2.cluster.local" , port=3306 , hostgroup=10, max_connections=100 },
    { address="db3.cluster.local" , port=3306 , hostgroup=10, max_connections=100 }
)

mysql_query_rules =
(
    {
        rule_id=100
        active=1
        match_pattern="^SELECT .* FOR UPDATE"
        destination_hostgroup=10
        apply=1
    },
    {
        rule_id=200
        active=1
        match_pattern="^SELECT .*"
        destination_hostgroup=20
        apply=1
    },
    {
        rule_id=300
        active=1
        match_pattern=".*"
        destination_hostgroup=10
        apply=1
    }
)

mysql_users =
(
    { username = "wordpress", password = "passw0rd", default_hostgroup = 10, transaction_persistent = 0, active = 1 },
    { username = "sbtest", password = "passw0rd", default_hostgroup = 10, transaction_persistent = 0, active = 1 }
)

Now, let's pay a visit to some of the most configuration sections. Firstly, we define the Galera hostgroups configuration as below:

mysql_galera_hostgroups =
(
    {
        writer_hostgroup=10
        backup_writer_hostgroup=20
        reader_hostgroup=30
        offline_hostgroup=9999
        max_writers=1
        writer_is_also_reader=1
        max_transactions_behind=30
        active=1
    }
)

Hostgroup 10 will be the writer_hostgroup, hostgroup 20 for backup_writer and hostgroup 30 for reader. We set max_writers to 1 so we can have a single-writer hostgroup for hostgroup 10 where all writes should be sent to. Then, we define writer_is_also_reader to 1 which will make all Galera nodes as reader as well, suitable for queries that can be equally distributed to all nodes. Hostgroup 9999 is reserved for offline_hostgroup if ProxySQL detects unoperational Galera nodes.

Then, we configure our MySQL servers with default to hostgroup 10:

mysql_servers =
(
    { address="db1.cluster.local" , port=3306 , hostgroup=10, max_connections=100 },
    { address="db2.cluster.local" , port=3306 , hostgroup=10, max_connections=100 },
    { address="db3.cluster.local" , port=3306 , hostgroup=10, max_connections=100 }
)

With the above configurations, ProxySQL will "see" our hostgroups as below:

Image may be NSFW.
Clik here to view.

Then, we define the query routing through query rules. Based on our requirement, all reads should be sent to all Galera nodes except the writer (hostgroup 20) and everything else is forwarded to hostgroup 10 for single writer:

mysql_query_rules =
(
    {
        rule_id=100
        active=1
        match_pattern="^SELECT .* FOR UPDATE"
        destination_hostgroup=10
        apply=1
    },
    {
        rule_id=200
        active=1
        match_pattern="^SELECT .*"
        destination_hostgroup=20
        apply=1
    },
    {
        rule_id=300
        active=1
        match_pattern=".*"
        destination_hostgroup=10
        apply=1
    }
)

Finally, we define the MySQL users that will be passed through ProxySQL:

mysql_users =
(
    { username = "wordpress", password = "passw0rd", default_hostgroup = 10, transaction_persistent = 0, active = 1 },
    { username = "sbtest", password = "passw0rd", default_hostgroup = 10, transaction_persistent = 0, active = 1 }
)

We set transaction_persistent to 0 so all connections coming from these users will respect the query rules for reads and writes routing. Otherwise, the connections would end up hitting one hostgroup which defeats the purpose of load balancing. Do not forget to create those users first on all MySQL servers. For ClusterControl user, you may use Manage -> Schemas and Users feature to create those users.

We are now ready to start our container. We are going to map the ProxySQL configuration file as bind mount when starting up the ProxySQL container. Thus, the run command will be:

$ docker run -d \
--name proxysql2 \
--hostname proxysql2 \
--publish 6033:6033 \
--publish 6032:6032 \
--publish 6080:6080 \
--restart=unless-stopped \
-v /root/proxysql/proxysql.cnf:/etc/proxysql.cnf \
severalnines/proxysql:2.0

Finally, change the Wordpress database pointing to ProxySQL container port 6033, for instance:

$ docker run -d \
--name wordpress \
--publish 80:80 \
--restart=unless-stopped \
-e WORDPRESS_DB_HOST=proxysql2:6033 \
-e WORDPRESS_DB_USER=wordpress \
-e WORDPRESS_DB_HOST=passw0rd \
wordpress

At this point, our architecture is looking something like this:

Image may be NSFW.
Clik here to view.

If you want ProxySQL container to be persistent, map /var/lib/proxysql/ to a Docker volume or bind mount, for example:

$ docker run -d \
--name proxysql2 \
--hostname proxysql2 \
--publish 6033:6033 \
--publish 6032:6032 \
--publish 6080:6080 \
--restart=unless-stopped \
-v /root/proxysql/proxysql.cnf:/etc/proxysql.cnf \
-v proxysql-volume:/var/lib/proxysql \
severalnines/proxysql:2.0

Keep in mind that running with persistent storage like the above will make our /root/proxysql/proxysql.cnf obsolete on the second restart. This is due to ProxySQL multi-layer configuration whereby if /var/lib/proxysql/proxysql.db exists, ProxySQL will skip loading options from configuration file and load whatever is in the SQLite database instead (unless you start proxysql service with --initial flag). Having said that, the next ProxySQL configuration management has to be performed via ProxySQL admin console on port 6032, instead of using configuration file.

Monitoring

ProxySQL process log by default logging to syslog and you can view them by using standard docker command:

$ docker ps
$ docker logs proxysql2

To verify the current hostgroup, query the runtime_mysql_servers table:

$ docker exec -it proxysql2 mysql -uadmin -padmin -h127.0.0.1 -P6032 --prompt='Admin> '
Admin> select hostgroup_id,hostname,status from runtime_mysql_servers;
+--------------+--------------+--------+
| hostgroup_id | hostname     | status |
+--------------+--------------+--------+
| 10           | 192.168.0.21 | ONLINE |
| 30           | 192.168.0.21 | ONLINE |
| 30           | 192.168.0.22 | ONLINE |
| 30           | 192.168.0.23 | ONLINE |
| 20           | 192.168.0.22 | ONLINE |
| 20           | 192.168.0.23 | ONLINE |
+--------------+--------------+--------+

If the selected writer goes down, it will be transferred to the offline_hostgroup (HID 9999):

Admin> select hostgroup_id,hostname,status from runtime_mysql_servers;
+--------------+--------------+--------+
| hostgroup_id | hostname     | status |
+--------------+--------------+--------+
| 10           | 192.168.0.22 | ONLINE |
| 9999         | 192.168.0.21 | ONLINE |
| 30           | 192.168.0.22 | ONLINE |
| 30           | 192.168.0.23 | ONLINE |
| 20           | 192.168.0.23 | ONLINE |
+--------------+--------------+--------+

The above topology changes can be illustrated in the following diagram:

Image may be NSFW.
Clik here to view.

We have also enabled the web stats UI with admin-web_enabled=true.To access the web UI, simply go to the Docker host in port 6080, for example: http://192.168.0.200:8060 and you will be prompted with username/password pop up. Enter the credentials as defined under admin-stats_credentials and you should see the following page:

Image may be NSFW.
Clik here to view.

By monitoring MySQL connection pool table, we can get connection distribution overview for all hostgroups:

Admin> select hostgroup, srv_host, status, ConnUsed, MaxConnUsed, Queries from stats.stats_mysql_connection_pool order by srv_host;
+-----------+--------------+--------+----------+-------------+---------+
| hostgroup | srv_host     | status | ConnUsed | MaxConnUsed | Queries |
+-----------+--------------+--------+----------+-------------+---------+
| 20        | 192.168.0.23 | ONLINE | 5        | 24          | 11458   |
| 30        | 192.168.0.23 | ONLINE | 0        | 0           | 0       |
| 20        | 192.168.0.22 | ONLINE | 2        | 24          | 11485   |
| 30        | 192.168.0.22 | ONLINE | 0        | 0           | 0       |
| 10        | 192.168.0.21 | ONLINE | 32       | 32          | 9746    |
| 30        | 192.168.0.21 | ONLINE | 0        | 0           | 0       |
+-----------+--------------+--------+----------+-------------+---------+

The output above shows that hostgroup 30 does not process anything because our query rules do not have this hostgroup configured as destination hostgroup.

The statistics related to the Galera nodes can be viewed in the mysql_server_galera_log table:

Admin>  select * from mysql_server_galera_log order by time_start_us desc limit 3\G
*************************** 1. row ***************************
                       hostname: 192.168.0.23
                           port: 3306
                  time_start_us: 1552992553332489
                success_time_us: 2045
              primary_partition: YES
                      read_only: NO
         wsrep_local_recv_queue: 0
              wsrep_local_state: 4
                   wsrep_desync: NO
           wsrep_reject_queries: NO
wsrep_sst_donor_rejects_queries: NO
                          error: NULL
*************************** 2. row ***************************
                       hostname: 192.168.0.22
                           port: 3306
                  time_start_us: 1552992553329653
                success_time_us: 2799
              primary_partition: YES
                      read_only: NO
         wsrep_local_recv_queue: 0
              wsrep_local_state: 4
                   wsrep_desync: NO
           wsrep_reject_queries: NO
wsrep_sst_donor_rejects_queries: NO
                          error: NULL
*************************** 3. row ***************************
                       hostname: 192.168.0.21
                           port: 3306
                  time_start_us: 1552992553329013
                success_time_us: 2715
              primary_partition: YES
                      read_only: NO
         wsrep_local_recv_queue: 0
              wsrep_local_state: 4
                   wsrep_desync: NO
           wsrep_reject_queries: NO
wsrep_sst_donor_rejects_queries: NO
                          error: NULL

The resultset returns the related MySQL variable/status state for every Galera node for a particular timestamp. In this configuration, we configured the Galera health check to run every 2 seconds (monitor_galera_healthcheck_interval=2000). Hence, the maximum failover time would be around 2 seconds if a topology change happens to the cluster.

References

Best Practices for Running MongoDB in a Cluster

Image may be NSFW.
Clik here to view.

Deploying a clustered database is one thing, but how you maintain your DBM while in cluster can be a large undertaking for a consistent serving of your applications. One should have an often update on the status of the database more especially the most crucial metrics in order to get a clue of what to upgrade or rather alter as a way of preventing any bottlenecks that may emerge.

There are a lot of considerations regarding MongoDB one should take into account especially the fact that it’s installation and running are quite easy chances of neglecting basic database management practices are high.

Many at times, developers fail to put into account future growth and increased usage of the database which consequently results in crashing of application or data with some integrity issues besides being inconsistent.

In this article we are going to discuss some of the best practices one should employ for MongoDB cluster for an efficient performance of your applications. Some of the factors one should consider include...

  1. Upgrading to latest version
  2. Appropriate storage engine
  3. Hardware resources allocation
  4. Replication and sharding
  5. Never change server configuration file
  6. Good Security Strategy

Upgrading to Latest Version

I have worked with MongoDB from versions before 3.2 and to be honest, things were not easy at that time. With great developments, fixed bugs and newly introduced features, I will advise you to always upgrade your database to the latest version. For instance, the introduction of the aggregation framework had a better performance impact rather than relying on the Map-Reduce concept that was already in existence. With the latest version 4.0, one has now the capability to utilize the multi document transactions feature which generally improves on throughput operations. The latest version also has some additional new type conversion operators such as $toInt, $toString, $trim and $toBool. This operators will greatly help in the validation of data hence create some sense of data consistency. When upgrading please refer to the docs so that you may avoid making slight mistakes that may escalate to be erroneous.

Choose an Appropriate Storage Engine

MongoDB supports 3 storage engines as per now that is: WiredTiger, In-Memory and MMAPv1 storage engines. Each of these storage engines has got merits and limitations over the other but your choice will depend on your application specification and the core functionality of the engine. However, I personally prefer the WiredTiger storage engine and I would recommend this for one who is not sure which one to use. The WiredTiger storage engine is well suited for most workloads, provides a document-level concurrency model, checkpointing and compression.

Some of the considerations regarding selections of storage engine are dependent on this aspects:

  1. Transactions and atomicity: provision of data during an insert or update which is committed only when all conditions and stages in application have been executed successfully. Operations are therefore bundled together in an immutable unit. With this in place multi-document transaction can be supported as seen in the latest version of MongoDB for the WiredTiger storage engine.
  2. Locking type: it is a control strategy on access or update of information. During the lock duration no other operation can change the data of selected object until the current operation has been executed. Consequently, queries get affected at this time hence important to monitor them and reduce the bulk of locking mechanism by ensuring you select the most appropriate storage engine for your data.
  3. Indexing: Storage engines in MongoDB provide different indexing strategies depending on the data types you are storing. Efficiency of that data structure should be quite friendly with your workload and one can determine this by considering every extra index as having some performance overhead. Write optimized data structures have lower overhead for every index in a high-insert application environment than non-write optimized data structures. This will be a major setback especially where a large number of indexes is involved and selection of an inappropriate storage engine. Therefore, choosing an appropriate storage engine can have a dramatic impact.

Hardware Resources Allocation

As new users sign into your application, the database grows with time and new shards will be introduced. However, you cannot rely on the hardware resources you had established during the deployment stage. There will be a correspondent increase on the workload and hence require more processing resources provision such as CPU and RAM to support your large data clusters. This is often referred to capacity planning in MongoDB. The best practices around capacity planning include:

  • Monitor your database constantly and adjust in accordance to expectations. As mentioned before, an increase in number of users will trigger more queries henceforth with an increased workload set especially if you employ indexes. You may start experiencing this impacts on the application end when it starts recording a change in the percentage of writes versus reads with time. You will therefore need to re-configure your hardware configurations in order to address this issue. Use mongoperf and MMS tool to detect changes in system performance parameters.
  • Document all you performance requirement upfronts. When you encounter same problem you will at least have a point of reference which will save you some time. Your recording should involve size of data you want to store, analysis of queries in terms of latency and how much data you would like to access at a given time. In production environment you need to determine how many requests are you going to handle per second and lastly how much latency you are going to tolerate.
  • Stage a Proof of Concept. Performa schema/index design and comprehend the query patterns and then refine your estimate of the working set size. Record this configuration as a point of reference for testing with successive revisions of the application.
  • Do your tests with real workload. After carrying out stage of proof concept, deploy only after carrying a substantial testing with real world data and performance requirements.

Replication and Sharding

These are the two major concepts of ensuring High Availability of data and increased horizontal scalability respectively in MongoDB cluster.

Sharding basically partitions data across servers into small portions known as shards. Balancing of data across shards is automatic, shards can be added or removed without necessarily taking the database offline.

Replication on the other end maintains a multiple redundant copies of the data for high availability. It is an in-built feature in MongoDB and works across a wide area networks without the need for specialized networks. For a cluster setup, i recommend you have at least have 2+ mongos, 3 config servers, 1 shard an ensure connectivity between machines involved in the sharded cluster. Use a DNS name rather than IPs in the configuration.

For production environments use a replica set with at least 3 members and remember to populate more configuration variables like oplog size.

When starting your mongod instances for your members use the same keyfile.

Some of the considerations of your shardkey should include:

  • Key and value are immutable
  • Always consider using indexes in a sharded collection
  • Update driver command should contain a shard key
  • Unique constraints to be maintained by the shard key.
  • A shard key cannot contain special index types and must not exceed 512 bytes.
Severalnines
 
Become a MongoDB DBA - Bringing MongoDB to Production
Learn about what you need to know to deploy, monitor, manage and scale MongoDB

Never Change Server Configuration File

After doing your first deployment, it is advisable not to change a lot of parameters in the configuration file otherwise you may land into trouble especially with shards. The weakest link with sharding is the config servers. This is to say all the mongod instances have to be running in order for sharding to work.

Good Security Strategy

MongoDB has been vulnerable to external attacks in the past years hence an important undertaking for your database to have some security protocols. Besides running the processes in different ports, one should at least employ one of the 5 different ways of securing MongoDB databases. You can consider platforms such as MongoDB Atlas which secure databases by default through encryption of the data both in-transit and at-rest. You can use strategies like TLS/SSL for all incoming and outgoing connections.

Conclusion

MongoDB cluster control is not an easy task and it involves a lot of workarounds. Databases grow as a result of more users hence increased workload set. On has therefore a mandate to ensure the performance of the DBM is in line with this increased number of users. The best practices go beyond increasing hardware resources and applying some MongoDB concepts such as sharding, replication and indexing. However, many of the inconveniences that may arise are well addressed by upgrading your MongoDB version. More often the latest versions have bugs fixed, new feature requests integrated and almost no negative impact to upgrading even with major revision numbers.

Benchmarking Managed PostgreSQL Cloud Solutions - Part Two: Amazon RDS

Image may be NSFW.
Clik here to view.

This is the second part of the multi-series Benchmarking Managed PostgreSQL Cloud Solutions. In Part 1 I presented an overview of the available tools, I discussed the reason for using the AWS Benchmark Procedure for Aurora, as well as PostgreSQL versions to be used, and I reviewed Amazon Aurora PostgreSQL 10.6.

In this part, pgbench and sysbench will be running against Amazon RDS for PostgreSQL 11.1. At the time of this writing the latest PostgreSQL version is 11.2 released about a month ago.

It’s worth pausing for a second to quickly review the PostgreSQL versions currently available in the cloud:

Amazon is again a winner, with its RDS offering, by providing the most recent version of PostgreSQL. As announced in the RDS forum AWS made PostgreSQL 11.1 available on March 13th, which is four months after the community release.

Setting Up the Environment

A few notes about the constraints related to setting up the environment and running the benchmark, points that were discussed in more detail during Part 1 of this series:

  • No changes to the cloud provider default GUC settings.
  • The connections are limited to a maximum of 1,000 as the AWS patch for pgbench did not apply cleanly. On a related note, I had to download the AWS timing patch from this pgsql-hackers submission since it was no longer available at the link mentioned in the guide.
  • The Enhanced Networking must be enabled for the client instance.
  • The database does not include a replica.
  • The database storage is not encrypted.
  • Both the client and the target instances are in the same availability zone.

First, setup the client and the database instances:

  • The client is an on demand r4.8xlarge EC2 instance:
    • vCPU: 32 (16 Cores x 2 Threads/Core)
    • RAM: 244 GiB
    • Storage: EBS Optimized
    • Network: 10 Gigabit
    Image may be NSFW.
    Clik here to view.
    Client Instance Configuration
    Client Instance Configuration
  • The DB Cluster is an on demand db.r4.2xlarge:
    • vCPU: 8
    • RAM: 61GiB
    • Storage: EBS Optimized
    • Network: 1,750 Mbps Max Bandwidth on an up to 10 Gbps connection
    Image may be NSFW.
    Clik here to view.
    Database Instance Configuration
    Database Instance Configuration

Next, install and configure the benchmark tools, pgbench and sysbench, by following the instructions in the Amazon guide.

The last step in getting the environment ready is configuring the PostgreSQL connection parameters. One way of doing it is by initializing the environment variables in .bashrc. Also, we need to set the paths to PostgreSQL binaries and libraries:

export PGHOST=benchmark.ctfirtyhadgr.us-east-1.rds.amazonaws.com

export PGHOST=benchmark.ctfirtyhadgr.us-east-1.rds.amazonaws.com
export PGUSER=postgres
export PGPASSWORD=postgres
export PGDATABASE=postgres
export PATH=$PATH:/usr/local/pgsql/bin
export LD_LIBRARY_PATH=$LD_LIBRARY_PATH:/usr/local/pgsql/lib
Verify that everything is in place:
[root@ip-172-31-84-185 ~]# psql --version
psql (PostgreSQL) 11.1
[root@ip-172-31-84-185 ~]# pgbench --version
pgbench (PostgreSQL) 11.1
[root@ip-172-31-84-185 ~]# sysbench --version
sysbench 0.5

Running the Benchmarks

pgench

First, initialize the pgbench database.

[root@ip-172-31-84-185 ~]# pgbench -i --fillfactor=90 --scale=10000

The initialization process takes some time, and while running generated the following output:

dropping old tables...
NOTICE:  table "pgbench_accounts" does not exist, skipping
NOTICE:  table "pgbench_branches" does not exist, skipping
NOTICE:  table "pgbench_history" does not exist, skipping
NOTICE:  table "pgbench_tellers" does not exist, skipping
creating tables...
generating data...
100000 of 1000000000 tuples (0%) done (elapsed 0.06 s, remaining 599.79 s)
200000 of 1000000000 tuples (0%) done (elapsed 0.15 s, remaining 739.16 s)
300000 of 1000000000 tuples (0%) done (elapsed 0.22 s, remaining 742.21 s)
400000 of 1000000000 tuples (0%) done (elapsed 0.33 s, remaining 814.64 s)
500000 of 1000000000 tuples (0%) done (elapsed 0.41 s, remaining 825.82 s)
600000 of 1000000000 tuples (0%) done (elapsed 0.51 s, remaining 854.13 s)
700000 of 1000000000 tuples (0%) done (elapsed 0.66 s, remaining 937.01 s)
800000 of 1000000000 tuples (0%) done (elapsed 1.52 s, remaining 1897.42 s)
900000 of 1000000000 tuples (0%) done (elapsed 1.66 s, remaining 1840.08 s)

...

500600000 of 1000000000 tuples (50%) done (elapsed 814.78 s, remaining 812.83 s)
500700000 of 1000000000 tuples (50%) done (elapsed 814.81 s, remaining 812.53 s)
500800000 of 1000000000 tuples (50%) done (elapsed 814.83 s, remaining 812.23 s)
500900000 of 1000000000 tuples (50%) done (elapsed 815.11 s, remaining 812.19 s)
501000000 of 1000000000 tuples (50%) done (elapsed 815.20 s, remaining 811.94 s)

...

999200000 of 1000000000 tuples (99%) done (elapsed 1645.02 s, remaining 1.32 s)
999300000 of 1000000000 tuples (99%) done (elapsed 1645.17 s, remaining 1.15 s)
999400000 of 1000000000 tuples (99%) done (elapsed 1645.20 s, remaining 0.99 s)
999500000 of 1000000000 tuples (99%) done (elapsed 1645.23 s, remaining 0.82 s)
999600000 of 1000000000 tuples (99%) done (elapsed 1645.26 s, remaining 0.66 s)
999700000 of 1000000000 tuples (99%) done (elapsed 1645.28 s, remaining 0.49 s)
999800000 of 1000000000 tuples (99%) done (elapsed 1645.51 s, remaining 0.33 s)
999900000 of 1000000000 tuples (99%) done (elapsed 1645.77 s, remaining 0.16 s)
1000000000 of 1000000000 tuples (100%) done (elapsed 1646.03 s, remaining 0.00 s)
vacuuming...
creating primary keys...
total time: 5538.86 s (drop 0.00 s, tables 0.01 s, insert 1647.08 s, commit 0.03 s, primary 1251.60 s, foreign 0.00 s, vacuum 2640.14 s)
done.

Once that part is complete, verify that the PostgreSQL database has been populated. The following simplified version of the disk usage query can be used to return the PostgreSQL database size:

SELECT
   d.datname AS Name,
   pg_catalog.pg_get_userbyid(d.datdba) AS Owner,
   pg_catalog.pg_size_pretty(pg_catalog.pg_database_size(d.datname)) AS SIZE
FROM pg_catalog.pg_database d
WHERE d.datname = 'postgres';

…and the output:

  name   |  owner   |  size
----------+----------+--------
postgres | postgres | 160 GB
(1 row)

With all the preparations completed we can start the read/write pgbench test:

[root@ip-172-31-84-185 ~]# pgbench --protocol=prepared -P 60 --time=600 --client=1000 --jobs=2048

After 10 minutes we get the results:

starting vacuum...end.
progress: 60.0 s, 878.3 tps, lat 1101.258 ms stddev 339.491
progress: 120.0 s, 885.2 tps, lat 1132.301 ms stddev 292.551
progress: 180.0 s, 656.3 tps, lat 1522.102 ms stddev 666.017
progress: 240.0 s, 436.8 tps, lat 2277.140 ms stddev 524.603
progress: 300.0 s, 742.2 tps, lat 1363.558 ms stddev 578.541
progress: 360.0 s, 866.4 tps, lat 1146.972 ms stddev 301.861
progress: 420.0 s, 878.2 tps, lat 1143.939 ms stddev 304.396
progress: 480.0 s, 872.7 tps, lat 1139.892 ms stddev 304.421
progress: 540.0 s, 881.0 tps, lat 1132.373 ms stddev 311.890
progress: 600.0 s, 729.3 tps, lat 1366.517 ms stddev 867.784
transaction type: <builtin: TPC-B (sort of)>
scaling factor: 10000
query mode: prepared
number of clients: 1000
number of threads: 1000
duration: 600 s
number of transactions actually processed: 470582
latency average = 1274.340 ms
latency stddev = 544.179 ms
tps = 782.084354 (including connections establishing)
tps = 783.610726 (excluding connections establishing)

sysbench

The first step is adding some data:

sysbench --test=/usr/local/share/sysbench/oltp.lua \
      --pgsql-host=aurora.cluster-ctfirtyhadgr.us-east-1.rds.amazonaws.com \
      --pgsql-db=postgres \
      --pgsql-user=postgres \
      --pgsql-password=postgres \
      --pgsql-port=5432 \
      --oltp-tables-count=250\
      --oltp-table-size=450000 \
      prepare

The command creates 250 tables, each table having 2 indexes:

sysbench 0.5:  multi-threaded system evaluation benchmark

Creating table 'sbtest1'...
Inserting 450000 records into 'sbtest1'
Creating secondary indexes on 'sbtest1'...
Creating table 'sbtest2'...
...
Creating table 'sbtest250'...
Inserting 450000 records into 'sbtest250'
Creating secondary indexes on 'sbtest250'...

Let’s look at indexes:

postgres=> \di
                        List of relations
Schema |         Name          | Type  |  Owner   |      Table
--------+-----------------------+-------+----------+------------------
public | k_1                   | index | postgres | sbtest1
public | k_10                  | index | postgres | sbtest10
public | k_100                 | index | postgres | sbtest100
public | k_101                 | index | postgres | sbtest101
public | k_102                 | index | postgres | sbtest102
public | k_103                 | index | postgres | sbtest103

...

public | k_97                  | index | postgres | sbtest97
public | k_98                  | index | postgres | sbtest98
public | k_99                  | index | postgres | sbtest99
public | pgbench_accounts_pkey | index | postgres | pgbench_accounts
public | pgbench_branches_pkey | index | postgres | pgbench_branches
public | pgbench_tellers_pkey  | index | postgres | pgbench_tellers
public | sbtest100_pkey        | index | postgres | sbtest100
public | sbtest101_pkey        | index | postgres | sbtest101
public | sbtest102_pkey        | index | postgres | sbtest102
public | sbtest103_pkey        | index | postgres | sbtest103
public | sbtest104_pkey        | index | postgres | sbtest104
public | sbtest105_pkey        | index | postgres | sbtest105

...

public | sbtest97_pkey         | index | postgres | sbtest97
public | sbtest98_pkey         | index | postgres | sbtest98
public | sbtest99_pkey         | index | postgres | sbtest99
public | sbtest9_pkey          | index | postgres | sbtest9
(503 rows)

Looking good...to start the test just run:

sysbench --test=/usr/local/share/sysbench/oltp.lua \
      --pgsql-host=aurora.cluster-ctfirtyhadgr.us-east-1.rds.amazonaws.com \
      --pgsql-db=postgres \
      --pgsql-user=postgres \
      --pgsql-password=postgres \
      --pgsql-port=5432 \
      --oltp-tables-count=250 \
      --oltp-table-size=450000 \
      --max-requests=0 \
      --forced-shutdown \
      --report-interval=60 \
      --oltp_simple_ranges=0 \
      --oltp-distinct-ranges=0 \
      --oltp-sum-ranges=0 \
      --oltp-order-ranges=0 \
      --oltp-point-selects=0 \
      --rand-type=uniform \
      --max-time=600 \
      --num-threads=1000 \
      run

A note of caution:

RDS storage is not “elastic”, meaning that the storage space allocated when creating the instance must be large enough to fit the amount of data generated during benchmark, or else RDS will fail with:

FATAL: PQexec() failed: 7 PANIC:  could not write to file "pg_wal/xlogtemp.29144": No space left on device
server closed the connection unexpectedly
        This probably means the server terminated abnormally
        before or while processing the request.

FATAL: failed query: COMMIT
FATAL: failed to execute function `event': 3
WARNING:  terminating connection because of crash of another server process
DETAIL:  The postmaster has commanded this server process to roll back the current transaction and exit, because another server process exited abnormally and possibly corrupted shared memory.
HINT:  In a moment you should be able to reconnect to the database and repeat your command.
WARNING:  terminating connection because of crash of another server process

The storage size can be increased without stopping the database, however, it took me about 30 minutes to grow it from 200 GiB to 500 GiB:

Image may be NSFW.
Clik here to view.
Increasing storage space on RDS

And here are the sysbench test results:

sysbench 0.5:  multi-threaded system evaluation benchmark

Running the test with following options:
Number of threads: 1000
Report intermediate results every 60 second(s)
Random number generator seed is 0 and will be ignored

Forcing shutdown in 630 seconds

Initializing worker threads...

Threads started!

[  60s] threads: 1000, tps: 1070.40, reads: 0.00, writes: 4309.35, response time: 1808.81ms (95%), errors: 0.02, reconnects:  0.00
[ 120s] threads: 1000, tps: 889.68, reads: 0.00, writes: 3575.35, response time: 1951.12ms (95%), errors: 0.02, reconnects:  0.00
[ 180s] threads: 1000, tps: 574.57, reads: 0.00, writes: 2320.62, response time: 3936.73ms (95%), errors: 0.00, reconnects:  0.00
[ 240s] threads: 1000, tps: 232.10, reads: 0.00, writes: 928.43, response time: 10994.37ms (95%), errors: 0.00, reconnects:  0.00
[ 300s] threads: 1000, tps: 242.40, reads: 0.00, writes: 969.60, response time: 9412.39ms (95%), errors: 0.00, reconnects:  0.00
[ 360s] threads: 1000, tps: 257.73, reads: 0.00, writes: 1030.98, response time: 8833.64ms (95%), errors: 0.02, reconnects:  0.00
[ 420s] threads: 1000, tps: 264.65, reads: 0.00, writes: 1036.60, response time: 9192.42ms (95%), errors: 0.00, reconnects:  0.00
[ 480s] threads: 1000, tps: 278.07, reads: 0.00, writes: 1134.27, response time: 7133.76ms (95%), errors: 0.00, reconnects:  0.00
[ 540s] threads: 1000, tps: 250.40, reads: 0.00, writes: 1001.53, response time: 9628.97ms (95%), errors: 0.00, reconnects:  0.00
[ 600s] threads: 1000, tps: 249.97, reads: 0.00, writes: 996.92, response time: 10724.58ms (95%), errors: 0.00, reconnects:  0.00
OLTP test statistics:
   queries performed:
      read:                            0
      write:                           1038401
      other:                           519199
      total:                           1557600
   transactions:                        259598 (428.59 per sec.)
   read/write requests:                 1038401 (1714.36 per sec.)
   other operations:                    519199 (857.18 per sec.)
   ignored errors:                      3      (0.00 per sec.)
   reconnects:                          0      (0.00 per sec.)

General statistics:
   total time:                          605.7086s
   total number of events:              259598
   total time taken by event execution: 602999.7582s
   response time:
         min:                                 55.02ms
         avg:                               2322.82ms
         max:                              13133.36ms
         approx.  95 percentile:            8400.39ms

Threads fairness:
   events (avg/stddev):           259.5980/3.20
   execution time (avg/stddev):   602.9998/2.77
Download the Whitepaper Today
 
PostgreSQL Management & Automation with ClusterControl
Learn about what you need to know to deploy, monitor, manage and scale PostgreSQL

Benchmark Metrics

The metrics can be captured using AWS monitoring tools CloudWatch and Performance Insights. Here a few samples for the curious:

Image may be NSFW.
Clik here to view.
DB Instance CloudWatch Metrics
Image may be NSFW.
Clik here to view.
RDS Performance Insights - Counter Metrics
Image may be NSFW.
Clik here to view.
RDS Performance Insights - Database Load

Results

Image may be NSFW.
Clik here to view.
pgbench initialization results
Image may be NSFW.
Clik here to view.
pgbench run results
pgbench run results
Image may be NSFW.
Clik here to view.
sysbench results
sysbench results

Conclusion

Despite running PostgreSQL version 10.6, Amazon Aurora clearly outperforms RDS which is at version 11.1, and that comes as no surprise. According to Aurora FAQs Amazon went to great lengths in order to improve the overall database performance which was built on top of a redesigned storage engine.

Next in Series

The next part will be about Google Cloud SQL for PostgreSQL.

Understanding MongoDB Indexes

Image may be NSFW.
Clik here to view.

Among the tasks involved in database management is improving performance by employing different strategies. Indexing is one of the tips that improve throughput operations by facilitating data access to query requests. It does so by minimizing the number of disk access required when a query is processed. Failure to use indexes in MongoDB will force the database to perform a full collection scan, that is, scan through all the documents in the collection in order to select documents that match an issued query statement. Obviously, this will take a lot of time especially if there are so many documents involved. In a nutshell, indexes support efficient execution of queries.

MongoDB Indexes

Since we expect to store many documents in a MongoDB collection, we need to find a way to store a small portion of data for each document in a different partition for easy traversing by use of indexes. An index will store a specific field value or fields and then sort this data in order of the value of that field. With this ordering, efficient query matching and range-based query operations are supported. Indexes are defined at the collection level and they are supported by any field or embedded field of the documents in the collection.

When you create a document, MongoDB by default assigns an _id field if not specified and makes this a unique index for that document. Basically, this is to prevent inserting of the same document more than ones in that collection. In addition, for a sharded cluster, it is advisable to use this _id field as part of the shard keys selection, otherwise there must be some uniqueness of data in the _id field in order to avoid errors.

Creating an Index for a Collection

Assuming you have inserted some data in your collection and you want to assign a field to be an index, you can use the createIndex method to achieve this, i.e.

Let’s say you have this json data:

{
    _id:1,
    Name: “Sepp Maier”, 
    Country: “Germany”
}

We can make the Name field a descending index by:

db.collection.createIndex({Name: -1})

This method creates an index with the same specification if only not in existence already.

Types of Indexes in MongoDB

MongoDB involves different types of data hence different types of indexes are derived to support these data types and queries.

  1. Single Field

    Using a single field of a document one can make the field an index in an ascending or descending manner just like the example above. Besides, you can create an index on an embedded document as a whole, for example:

    { 
        _id: “xyz”,
        Contact:{
            email: “example@gmail.com”, 
            phone:”+420 78342823” },
        Name: “Sergio”
    }

    Contact field is an embedded document hence we can make it an ascending index with the command:

    db.collection.createIndex({ Contact: 1})

    In a query we can fetch the document like:

    db.collection.find({ 
        Contact: {email: “example@gmail.com”,
        phone:”+420 78342823”} 
    })

    A best practice is creating the index in the background especially when a large amount of data is involved since the application needs to access the data while building the index.

  2. Compound Index

    Compound indexes are often used to facilitate the sort operation within a query and support queries that match on multiple fields. The syntax for creating a compound index is:

    db.collection.createIndex( { <field0>: <type>, <field1>: <type1>, ... } )

    Creating a compound index for the sample data below

    { 
        _id: “1”,
        Name: “Tom”,
        Age: 24,
        Score:”80”
    }
    db.collection.createIndex({ Age: 1, Score:-1})

    Considerations:

    • A limit of only 32 fields can be supported.
    • Value of the field will define the type of index i.e. 1 is ascending and -1 is descending.
    • Don’t create compound indexes that have hashed index type.
    • The order of fields listed in a compound index is important. The sorting will be done in accordance with the order of the fields.
  3. Multikey Index

    At some point, you may have fields with stored array content. When these fields are indexed, separate index entries for every element are created. It therefore helps a query to select documents that consist arrays by matching on element or elements of the arrays. This is done automatically by MongoDB hence no need for one to explicitly specify the multikey type. From version 3.4, MongoDB tracks which indexed fields cause an index to be a multikey index. With this tracking, the database query engine is allowed to use tighter index bounds.

    Limitations of Multikey Index

    • Only one array field can be used in the multikey indexing for a document in the collection. I.e. You cannot create a multikey index for the command and data below
      { _id: 1, nums: [ 1, 2 ], scores: [ 30, 60 ]}
      You cannot create a multikey index
      { nums: 1, scores: 1 } 
    • If the multikey index already exists, you cannot insert a document that violates this restriction. This is to say if we have
      { _id: 1, nums:  1, scores: [ 30, 60 ]}
      { _id: 1, nums: [ 1, 2 ], scores:  30}
      After creating a compound multikey index, an attempt to insert a document where both nums and scores fields are arrays, the database will fail the insert.
  4. Text Indexes

    Text indexes are often used to improve on search queries for a string in a collection. They do not store language-specific stop words (i.e “the”, ”a”, “or”). A collection can have at most one text index. To create a text index:

    db.collection.createIndex({Name:”text”})

    You can also index multiple fields i.e.

    db.collection.createIndex({
        Name:”text”,
        place:”text”
    })

    A compound index can include a text index key in combination with the ascending/descending index key but:

    • All text index keys must be adjacently in the index specification document when creating a compound text index.
    • No other special index types such as multikey index fields should be involved in the compound text index.
    • To perform a $text search, the query predicate must include equality match conditions on the preceding keys.
  5. Hashed Indexes

    Sharding is one of the techniques used in MongoDB to improve on horizontal scaling. Sharding often involves hash based concept by use of hashed indexes. The more random distribution of values along their range is portrayed by these indexes, but only support equality matches and cannot support range-based queries.

Overall Operational Considerations for Indexes

  • Each index requires at least 8kB of data space.
  • When active, each index will consume some disk space and memory. This is significant when tracked in capacity planning.
  • For a high read-to-write ratio collection, additional indexes improve performance and do not affect un-indexed read operations.

Limitations of Using Indexes

  • Adding an index has some negative performance impact for write operations especially for collections with the high write-to-read ratio. Indexes will be expensive in that each insert must also update any index.
  • MongoDB will not create, update an index or insert into an indexed collection if the index entry for an existing document exceeds the index key limit.
  • For existing sharded collections, chunk migration will fail if the chunk has a document that contains an indexed field that has an index entry that exceeds the index key limit.

Conclusion

There are so many ways of improving MongoDB performance, indexing being one of them. Indexing facilitates query operations by reducing latency over which data is retrieved by somehow minimizing the number of documents that need to be scanned. However, there are some considerations one needs to undertake before deciding to use a specific type of index. Collections with high read-to-write ratio tend to utilize indexes better than collections with high write-to-read operations.


Understanding the Effects of High Latency in High Availability MySQL and MariaDB Solutions

Image may be NSFW.
Clik here to view.

High availability is a high percentage of time that the system is working and responding according to the business needs. For production database systems it is typically the highest priority to keep it close to 100%. We build database clusters to eliminate all single point of failure. If an instance becomes unavailable, another node should be able to take the workload and carry on from there. In a perfect world, a database cluster would solve all of our system availability problems. Unfortunately, while all may look good on paper, the reality is often different. So where can it go wrong?

Transactional databases systems come with sophisticated storage engines. Keeping data consistent across multiple nodes makes this task way harder. Clustering introduces a number of new variables that highly depend on network and underlying infrastructure. It is not uncommon for a standalone database instance that was running fine on a single node suddenly performs poorly in a cluster environment.

Among the number of things that can affect cluster availability, latency issues play a crucial role. However, what is the latency? Is it only related to the network?

The term "latency" actually refers to several kinds of delays incurred in the processing of data. It’s how long it takes for a piece of information to move from stage to another.

In this blog post, we’ll look at the two main high availability solutions for MySQL and MariaDB, and how they can each be affected by latency issues.

At the end of the article, we take a look at modern load balancers and discuss how they can help you address some types of latency issues.

In a previous article, my colleague Krzysztof Książek wrote about "Dealing with Unreliable Networks When Crafting an HA Solution for MySQL or MariaDB". You will find tips which can help you to design your production ready HA architecture, and avoid some of the issues described here.

Master-Slave replication for High Availability.

MySQL master-slave replication is probably the most popular database cluster type on the planet. One of the main things you want to monitor while running your master-slave replication cluster is the slave lag. Depending on your application requirements and the way how you utilize your database, the replication latency (slave lag) may determine if the data can be read from the slave node or not. Data committed on master but not yet available on an asynchronous slave means that the slave has an older state. When it’s not ok to read from a slave, you would need to go to the master, and that can affect application performance. In the worst case scenario, your system will not be able to handle all the workload on a master.

Slave lag and stale data

To check the status of the master-slave replication, you should start with below command:

SHOW SLAVE STATUS\G
MariaDB [(none)]> show slave status\G
*************************** 1. row ***************************
               Slave_IO_State: Waiting for master to send event
                  Master_Host: 10.0.3.100
                  Master_User: rpl_user
                  Master_Port: 3306
                Connect_Retry: 10
              Master_Log_File: binlog.000021
          Read_Master_Log_Pos: 5101
               Relay_Log_File: relay-bin.000002
                Relay_Log_Pos: 809
        Relay_Master_Log_File: binlog.000021
             Slave_IO_Running: Yes
            Slave_SQL_Running: Yes
              Replicate_Do_DB: 
          Replicate_Ignore_DB: 
           Replicate_Do_Table: 
       Replicate_Ignore_Table: 
      Replicate_Wild_Do_Table: 
  Replicate_Wild_Ignore_Table: 
                   Last_Errno: 0
                   Last_Error: 
                 Skip_Counter: 0
          Exec_Master_Log_Pos: 5101
              Relay_Log_Space: 1101
              Until_Condition: None
               Until_Log_File: 
                Until_Log_Pos: 0
           Master_SSL_Allowed: No
           Master_SSL_CA_File: 
           Master_SSL_CA_Path: 
              Master_SSL_Cert: 
            Master_SSL_Cipher: 
               Master_SSL_Key: 
        Seconds_Behind_Master: 0
Master_SSL_Verify_Server_Cert: No
                Last_IO_Errno: 0
                Last_IO_Error: 
               Last_SQL_Errno: 0
               Last_SQL_Error: 
  Replicate_Ignore_Server_Ids: 
             Master_Server_Id: 3
               Master_SSL_Crl: 
           Master_SSL_Crlpath: 
                   Using_Gtid: Slave_Pos
                  Gtid_IO_Pos: 0-3-1179
      Replicate_Do_Domain_Ids: 
  Replicate_Ignore_Domain_Ids: 
                Parallel_Mode: conservative
1 row in set (0.01 sec)

Using the above information you can determine how good the overall replication latency is. The lower the value you see in "Seconds_Behind_Master", the better the data transfer speed for replication.

Image may be NSFW.
Clik here to view.
Another way to monitor slave lag is to use ClusterControl replication monitoring. In this screenshot we can see the replication status of asymchoronous Master-Slave (2x) Cluster with ProxySQL.

There are a number of things that can affect replication time. The most obvious is the network throughput and how much data you can transfer. MySQL comes with multiple configuration options to optimize replication process. The essential replication related parameters are:

  • Parallel apply
  • Logical clock algorithm
  • Compression
  • Selective master-slave replication
  • Replication mode

Parallel apply

It’s not uncommon to start replication tuning with enabling parallel process apply. The reason for that is by default, MySQL goes with sequential binary log apply, and a typical database server comes with several CPUs to use.

To get around sequential log apply, both MariaDB and MySQL offer parallel replication. The implementation may differ per vendor and version. E.g. MySQL 5.6 offers parallel replication as long as a schema separates the queries while MariaDB (starting version 10.0) and MySQL 5.7 both can handle parallel replication across schemas. Different vendors and versions come with their limitations and feature so always check the documentation.

Executing queries via parallel slave threads may speed up your replication stream if you are write heavy. However, if you aren’t, it would be best to stick to the traditional single-threaded replication. To enable parallel processing, change the slave_parallel_workers to the number of CPU threads you want to involve in the process. It is recommended to keep the value lower of the number of available CPU threads.

Parallel replication works best with the group commits. To check if you have group commits happening run following query.

show global status like 'binlog_%commits';

The bigger the ratio between these two values the better.

Logical clock

The slave_parallel_type=LOGICAL_CLOCK is an implementation of a Lamport clock algorithm. When using a multithreaded slave this variable specifies the method used to decide which transactions are allowed to execute in parallel on the slave. The variable has no effect on slaves for which multithreading is not enabled so make sure slave_parallel_workers is set higher than 0.

MariaDB users should also check optimistic mode introduced in version 10.1.3 as it also may give you better results.

GTID

MariaDB comes with its own implementation of GTID. MariaDB’s sequence consists of a domain, server, and transaction. Domains allow multi-source replication with distinct ID. Different domain ID’s can be used to replicate the portion of data out-of-order (in parallel). As long it’s okayish for your application this can reduce replication latency.

The similar technique applies to MySQL 5.7 which can also use the multisource master and independent replication channels.

Compression

CPU power is getting less expensive over time, so using it for binlog compression could be a good option for many database environments. The slave_compressed_protocol parameter tells MySQL to use compression if both master and slave support it. By default, this parameter is disabled.

Starting from MariaDB 10.2.3, selected events in the binary log can be optionally compressed, to save the network transfers.

Replication formats

MySQL offers several replication modes. Choosing the right replication format helps to minimize the time to pass data between the cluster nodes.

Multimaster Replication For High Availability

Some applications can not afford to operate on outdated data.

In such cases, you may want to enforce consistency across the nodes with synchronous replication. Keeping data synchronous requires an additional plugin, and for some, the best solution on the market for that is Galera Cluster.

Galera cluster comes with wsrep API which is responsible of transmitting transactions to all nodes and executing them according to a cluster-wide ordering. This will block the execution of subsequent queries until the node has applied all write-sets from its applier queue. While it’s a good solution for consistency, you may hit some architectural limitations. The common latency issues can be related to:

  • The slowest node in the cluster
  • Horizontal scaling and write operations
  • Geolocated clusters
  • High Ping
  • Transaction size

The slowest node in the cluster

By design, the write performance of the cluster cannot be higher than the performance of the slowest node in the cluster. Start your cluster review by checking the machine resources and verify the configuration files to make sure they all run on the same performance settings.

Parallelization

Parallel threads do not guarantee better performance, but it may speed up the synchronization of new nodes with the cluster. The status wsrep_cert_deps_distance tells us the possible degree of parallelization. It is the value of the average distance between the highest and lowest seqno values that can be possibly applied in parallel. You can use the wsrep_cert_deps_distance status variable to determine the maximum number of slave threads possible.

Horizontal scaling

By adding more nodes in the cluster, we have fewer points that could fail; however, the information needs to go across multi-instances until it’s committed, which multiplies the response times. If you need scalable writes, consider an architecture based on sharding. A good solution can be a Spider storage engine.

In some cases, to reduce information shared across the cluster nodes, you can consider having one writer at a time. It’s relatively easy to implement while using a load balancer. When you do this manually make sure you have a procedure to change DNS value when your writer node goes down.

Geolocated clusters

Although Galera Cluster is synchronous, it is possible to deploy a Galera Cluster across data centers. Synchronous replication like MySQL Cluster (NDB) implements a two-phase commit, where messages are sent to all nodes in a cluster in a 'prepare' phase, and another set of messages are sent in a 'commit' phase. This approach is usually not suitable for geographically disparate nodes, because of the latencies in sending messages between nodes.

High Ping

Galera Cluster with the default settings does not handle well high network latency. If you have a network with a node that shows a high ping time, consider changing evs.send_window and evs.user_send_window parameters. These variables define the maximum number of data packets in replication at a time. For WAN setups, the variable can be set to a considerably higher value than the default value of 2. It’s common to set it to 512. These parameters are part of wsrep_provider_options.

--wsrep_provider_options="evs.send_window=512;evs.user_send_window=512"

Transaction size

One of the things you need to consider while running Galera Cluster is the size of the transaction. Finding the balance between the transaction size, performance and Galera certification process is something you have to estimate in your application. You can find more information about that in the article How to Improve Performance of Galera Cluster for MySQL or MariaDB by Ashraf Sharif.

Load Balancer Causal Consistency Reads

Even with the minimized risk of data latency issues, standard MySQL asynchronous replication cannot guarantee consistency. It is still possible that the data is yet not replicated to slave while your application is reading it from there. Synchronous replication can solve this problem, but it has architecture limitations and may not fit your application requirements (e.g., intensive bulk writes). So how to overcome it?

The first step to avoid stale data reading is to make the application aware of replication delay. It is usually programmed in application code. Fortunately, there are modern database load balancers with the support of adaptive query routing based on GTID tracking. The most popular are ProxySQL and Maxscale.

ProxySQL 2.0

ProxySQL Binlog Reader allows ProxySQL to know in real time which GTID has been executed on every MySQL server, slaves and master itself. Thanks to this, when a client executes a reads that needs to provide causal consistency reads, ProxySQL immediately knows on which server the query can be executed. If for whatever reason the writes were not executed on any slave yet, ProxySQL will know that the writer was executed on master and send the read there.

Maxscale 2.3

MariaDB introduced casual reads in Maxscale 2.3.0. The way it works it’s similar to ProxySQL 2.0. Basically when causal_reads are enabled, any subsequent reads performed on slave servers will be done in a manner that prevents replication lag from affecting the results. If the slave has not caught up to the master within the configured time, the query will be retried on the master.

Understanding the Challenges with Databases and DevOps

Image may be NSFW.
Clik here to view.

DevOps has become one of the fastest growing terms in IT for the past five years, and this comes to no surprise. DevOps is a term that is a compound of the words development and operations, where it refers to the collaboration and communication between (software) developers and information technology operations professionals. It changes the way these two groups of people work in a cultural and environmental way.

This improves the building, testing and releasing of software and allows more reliable, frequent and rapid deployments.

Image may be NSFW.
Clik here to view.

In DevOps the traditional development process is changed to a continuous process of developing and releasing the product. This circular process is much more suitable for short development cycles, where the cycle iterates over code (plan), build (create), test (verify), package, release, configure and monitor.

As quick and continuous release cycles dictate frequent updates from development to production, how do databases fit in this picture?

Most RDBMS databases are mostly built around securing the integrity of the data. This means that certain trade-off s have been made on how the database copes with (schema) changes. In general any change to the structure of the data in an RDBMS will involve locking and take a painfully long to apply. To overcome this problem, many DevOps will rather favor schemaless datastores like MongoDB. Schemaless datastores have made the trade-off of flexibility over consistency.

Database Collaboration in DevOps

As the DevOps method requires more close collaboration, this shifts a lot in the roles of the people that are part of the team and some of them will now share parts of their roles. The developer not only develops the application, but also is part of the release process. The developer is more likely to know most about the application, so the developer should also know how to monitor the application best. Similarly, QA has to know what they are going to test, how it works and what environment it is being hosted in. The operations members will likely know more about the internals of the application they are hosting, saving valuable time when troubleshooting issues.

With the shift in roles, additional responsibilities will be inevitable. The developer can no longer hide behind the fact that “she is just the developer” when it comes to operational issues, similarly for the other roles. As the whole team now owns the application, the team members will also feel more connected to the product that they are responsible for. Naturally they will feel more responsible when an outage occurs.

So who will be responsible for the role of DBA in a DevOps environment? In most cases this will be a collaborative role between the developer and the ops roles. The developer will drive the initiative, changes and performance aspects while the ops will handle the consistency and security.

Severalnines
 
DevOps Guide to Database Management
Learn about what you need to know to automate and manage your open source databases

What Does This Mean for Databases?

As mentioned before relational databases are less flexible by nature, while DevOps actually requires more flexibility. It will be a continuous trade-off between Dev and Ops for the solution chosen. Regardless of the solution chosen, there are many challenges that need to be overcome.

The first challenge will be deployment automation. As continuous deployments will be part of the DevOps process, the entire environment needs to be fully automated, provisioned and primed with the necessary data.

The second challenge will be the incompatibility between relational databases and microservice architectures. Microservices have, by definition, a shared-nothing architecture. The reasoning behind this is to lift any dependencies on other microservices and to prevent the outage of one microservice to affect the other. This means that in its purest form a microservice will be nothing more than a single table in a single schema on a database cluster.

The third challenge is collaboration. Collaboration between the members of a DevOps team will be key to its success. Communication is the most important element in collaboration, so it is essential that every member of the team is up to date with the latest information. Communication channels, also known as ChatOps, will play a big role in this.

In this whitepaper we will touch upon each of these challenges one by one. We will also see how Severalnines ClusterControl can be used to address these challenges.

ClusterControl Tips & Tricks - Dealing with MySQL Long Running Queries

Image may be NSFW.
Clik here to view.

Long running queries/statements/transactions are sometimes inevitable in a MySQL environment. In some occasions, a long running query could be a catalyst to a disastrous event. If you care about your database, optimizing query performance and detecting long running queries must be performed regularly. Things do get harder though when multiple instances in a group or cluster are involved.

When dealing with multiple nodes, the repetitive tasks to check every single node is something that we have to avoid. ClusterControl monitors multiple aspects of your database server, including queries. ClusterControl aggregates all the query-related information from all nodes in the group or cluster to provide a centralized view of workload. Right there is a great way to understand your cluster as a whole with minimal effort.

In this blog post, we show you how to detect MySQL long running queries using ClusterControl.

Why a Query Takes Longer Time?

First of all, we have to know the nature of the query, whether it is expected to be a long running or a short running query. Some analytic and batch operations are supposed to be long running queries, so we can skip those for now. Also, depending on the table size, modifying table structure with ALTER command can be a long running operation.

For a short-span transaction, it should be executed as fast as possible, usually in a matter of subsecond. The shorter the better. This comes with a set of query best-practice rules that users have to follow, like use proper indexing in WHERE or JOIN statement, using the right storage engine, picking proper data types, scheduling the batch operation during off-peak hours, offloading analytical/reporting traffic to dedicated replicas, and so on.

There are a number of things that may cause a query to take longer time to execute:

  • Inefficient query - Use non-indexed columns while lookup or joining, thus MySQL takes longer time to match the condition.
  • Table lock - The table is locked, by global lock or explicit table lock when the query is trying to access it.
  • Deadlock - A query is waiting to access the same rows that are locked by another query.
  • Dataset does not fit into RAM - If your working set data fits into that cache, then SELECT queries will usually be relatively fast.
  • Suboptimal hardware resources - This could be slow disks, RAID rebuilding, saturated network etc.
  • Maintenance operation - Running mysqldump can bring huge amounts of otherwise unused data into the buffer pool, and at the same time the (potentially useful) data that is already there will be evicted and flushed to disk.

The above list emphasizes it is not only the query itself that causes all sorts of problems. There are plenty of reasons which require looking at different aspects of a MySQL server. In some worse-case scenario, a long running query could cause a total service disruption like server down, server crash and connections maxing out. If you see a query takes longer than usual to execute, do investigate it.

How to Check?

PROCESSLIST

MySQL provides a number of built-in tools to check the long running transaction. First of all, SHOW PROCESSLIST or SHOW FULL PROCESSLIST commands can expose the running queries in real-time. Here is a screenshot of ClusterControl Running Queries feature, similar to SHOW FULL PROCESSLIST command (but ClusterControl aggregates all the process into one view for all nodes in the cluster):

Image may be NSFW.
Clik here to view.

As you can see, we can immediately see the offensive query right away from the output. But how often do we stare at those processes? This is only useful if you are aware of the long running transaction. Otherwise, you wouldn't know until something happens - like connections are piling up, or the server is getting slower than usual.

Slow Query Log

Slow query log captures slow queries (SQL statements that take more than long_query_time seconds to execute), or queries that do not use indexes for lookups (log_queries_not_using_indexes). This feature is not enabled by default and to enable it simply set the following lines and restart the MySQL server:

[mysqld]
slow_query_log=1
long_query_time=0.1
log_queries_not_using_indexes=1

The slow query log can be used to find queries that take a long time to execute and are therefore candidates for optimization. However, examining a long slow query log can be a time-consuming task. There are tools to parse MySQL slow query log files and summarize their contents like mysqldumpslow, pt-query-digest or ClusterControl Top Queries.

ClusterControl Top Queries summarizes the slow query using two methods - MySQL slow query log or Performance Schema:

Image may be NSFW.
Clik here to view.

You can easily see a summary of the normalized statement digests, sorted based on a number of criteria:

  • Host
  • Occurrences
  • Total execution time
  • Maximum execution time
  • Average execution time
  • Standard deviation time

We have covered this feature in great detail in this blog post, How to use the ClusterControl Query Monitor for MySQL, MariaDB and Percona Server.

Performance Schema

Performance Schema is a great tool available for monitoring MySQL Server internals and execution details at a lower level. The following tables in Performance Schema can be used to find slow queries:

  • events_statements_current
  • events_statements_history
  • events_statements_history_long
  • events_statements_summary_by_digest
  • events_statements_summary_by_user_by_event_name
  • events_statements_summary_by_host_by_event_name

MySQL 5.7.7 and higher includes the sys schema, a set of objects that helps DBAs and developers interpret data collected by the Performance Schema into more easily understandable form. Sys schema objects can be used for typical tuning and diagnosis use cases.

ClusterControl provides advisors, which are mini-programs that you can write using ClusterControl DSL (similar to JavaScript) to extend the ClusterControl monitoring capabilities custom to your needs. There are a number of scripts included based on Performance Schema that you can use to monitor query performance like I/O wait, lock wait time and so on. For example under Manage -> Developer Studio, go to s9s -> mysql -> p_s -> top_tables_by_iowait.js and click "Compile and Run" button. You should see the output under Messages tab for top 10 tables sorted by I/O wait per server:

Image may be NSFW.
Clik here to view.

There are a number of scripts that you can use to understand low-level information where and why the slowness happens like top_tables_by_lockwait.js, top_accessed_db_files.js and so on.

ClusterControl - Detecting and alerting upon long running queries

With ClusterControl, you will get additional powerful features that you won't find in the standard MySQL installation. ClusterControl can be configured to proactively monitor the running processes, and raise an alarm and send notification to the user if long query threshold is exceeded. This can be configured by using the Runtime Configuration under Settings:

Image may be NSFW.
Clik here to view.

For pre1.7.1, the default value for query_monitor_alert_long_running_query is false. We encourage user to enable this by setting it to 1 (true). To make it persistent, add the following line into /etc/cmon.d/cmon_X.cnf:

query_monitor_alert_long_running_query=1
query_monitor_long_running_query_ms=30000

Any changes made in the Runtime Configuration is applied immediately and no restart required. You will see something like this under the Alarms section if a query exceeds 30000ms (30 seconds) thresholds:

Image may be NSFW.
Clik here to view.

If you configure the mail recipient settings as "Deliver" for the DbComponent plus CRITICAL severity category (as shown in the following screenshot):

Image may be NSFW.
Clik here to view.

You should get a copy of this alarm in your email. Otherwise, it can be forwarded manually by clicking on the "Send Email" button.

Furthermore, you can filter out any kind of processlist resources that match certain criteria with regular expression (regex). For example, if you want ClusterControl to detect long running query for three MySQL users called 'sbtest', 'myshop' and 'db_user1', the following should do:

Image may be NSFW.
Clik here to view.

Any changes made in the Runtime Configuration is applied immediately and no restart required.

Additionally, ClusterControl will list out all deadlock transactions together with the InnoDB status when it was happening under Performance -> Transaction Log:

Image may be NSFW.
Clik here to view.

This feature is not enabled by default, due to deadlock detection will affect CPU usage on database nodes. To enable it, simply tick the "Enable Transaction Log" checkbox and specify the interval that you want. To make it persistent, add variable with value in seconds inside /etc/cmon.d/cmon_X.cnf:

db_deadlock_check_interval=30

Similarly, if you want to check out the InnoDB status, simply go to Performance -> InnoDB Status, and choose the MySQL server from the dropdown. For example:

Image may be NSFW.
Clik here to view.

There we go - all the required information is easily retrievable in a couple of clicks.

Summary

Long running transactions could lead to performance degradation, server down, connections maxed out and deadlocks. With ClusterControl, you can detect long running queries directly from the UI, without the need to examine every single MySQL node in the cluster.

Deploying Secure Multicloud MySQL Replication on AWS and GCP with VPN

Image may be NSFW.
Clik here to view.

Why Choose MySQL Replication?

Some basics firast about the replication technology. MySQL Replication is not complicated! It is easy to implement, monitor, and tune as there are various resources you can leverage - google being one. MySQL Replication does not contain a lot of configuration variables to tune. SQL_THREAD and IO_THREAD's logical errors aren't that hard to understand and fix. MySQL Replication is very popular nowadays and offers a simple way of implementing database High Availability. Powerful features such as GTID (Global Transaction Identifier) instead of the old-fashioned binary log position, or lossless Semi-Synchronous Replication make it more robust.

As we saw in an earlier post, network latency is a big challenge when selecting a high availability solution. Using MySQL Replication offers the advantage of not being as sensitive to latency. It does not implement any certification-based replication, unlike Galera Cluster uses group communication and transaction ordering techniques to achieve synchronous replication. Thus, it has no requirement that all of the nodes have to certify a writeset, and no need to wait before a commit on the other slave or replica.

Choosing the traditional MySQL Replication with asynchronous Primary-Secondary approach provides you speed when it comes to handling transactions from within your master; it does not need to wait for the slaves to sync or commit transactions. The setup typically has a primary (master) and one or more secondaries (slaves). Hence, it is a shared-nothing system, where all servers have a full copy of the data by default. Of course there are drawbacks. Data integrity can be an issue if your slaves failed to replicate due to SQL and I/O thread errors, or crashes. Alternatively, to address issues of data integrity, you can choose to implement MySQL Replication being semi-synchronous (or called lossless semi-sync replication in MySQL 5.7). How this works is that, the master has to wait until a replica acknowledges all events of the transaction. This means that it has to finish its writes to a relay log and flush to disk before it sends back to the master with an ACK response. With semi-synchronous replication enabled, threads or sessions in the master has to wait for acknowledgement from a replica. Once it gets an ACK response from the replica, it can then commit the transaction. The illustration below shows how MySQL handles semi-synchronous replication.

Image may be NSFW.
Clik here to view.
Image Courtesy of MySQL Documentation

With this implementation, all committed transaction are already replicated to at least one slave in case of a master crash. Although semi-synchronous does not represent by itself a high-availability solution, but it's a component for your solution. It's best that you should know your needs and tune your semi-sync implementation accordingly. Hence, if some data loss is acceptable, then you can instead use the traditional asynchronous replication.

GTID-based replication is helpful to the DBA as it simplifies the task to do a failover, especially when a slave is pointed to another master or new master. This means that with a simple MASTER_AUTO_POSITION=1 after setting the correct host and replication credentials, it will start replicating from the master without the need to find and specify the correct binary log x & y positions. Adding support of parallel replication also boosts the replication threads as it adds speed to process the events from the relay log.

Thus, MySQL Replication is a great choice component over other HA solutions if it suits your needs.

Topologies for MySQL Replication

Deploying MySQL Replication in a multicloud environment with GCP (Google Cloud Platform) and AWS is still the same approach if you have to replicate on-prem.

There are various topologies you can setup and implement.

Master with Slave Replication (Single Replication)

Image may be NSFW.
Clik here to view.

This the most straightforward MySQL replication topology. One master receives writes, one or more slaves replicate from the same master via asynchronous or semi- synchronous replication. If the designated master goes down, the most up-to-date slave must be promoted as new master. The remaining slaves resume the replication from the new master.

Master with Relay Slaves (Chain Replication)

Image may be NSFW.
Clik here to view.

This setup use an intermediate master to act as a relay to the other slaves in the replication chain. When there are many slaves connected to a master, the network interface of the master can get overloaded. This topology allows the read replicas to pull the replication stream from the relay server to offload the master server. On the slave relay server, binary logging and log_slave_updates must be enabled, whereby updates received by the slave server from the master server are logged to the slave’s own binary log.

Using slave relay has its problems:

  • log_slave_updates has some performance penalty.
  • Replication lag on the slave relay server will generate delay on all of its slaves.
  • Rogue transactions on the slave relay server will infect of all its slaves.
  • If a slave relay server fails and you are not using GTID, all of its slaves stop replicating and they need to be reinitialized.

Master with Active Master (Circular Replication)

Image may be NSFW.
Clik here to view.

Also known as ring topology, this setup requires two or more MySQL servers which act as master. All masters receive writes and generate binlogs with a few caveats:

  • You need to set auto-increment offset on each server to avoid primary key collisions.
  • There is no conflict resolution.
  • MySQL Replication currently does not support any locking protocol between master and slave to guarantee the atomicity of a distributed update across two different servers.
  • Common practice is to only write to one master and the other master acts as a hot-standby node. Still, if you have slaves below that tier, you have to switch to the new master manually if the designated master fails.
  • ClusterControl does support this topology (we do not recommend multiple writers in a replication setup). See this previous blog on how to deploy with ClusterControl.

Master with Backup Master (Multiple Replication)

Image may be NSFW.
Clik here to view.

The master pushes changes to a backup master and to one or more slaves. Semi-synchronous replication is used between master and backup master. Master sends update to backup master and waits with transaction commit. Backup master gets updates, writes to its relay log and flushes to disk. Backup master then acknowledges receipt of the transaction to the master, and proceeds with transaction commit. Semi- sync replication has a performance impact, but the risk for data loss is minimized.

This topology works well when performing master failover in case the master goes down. The backup master acts as a warm-standby server as it has the highest probability of having up-to-date data when compared to other slaves.

Multiple Masters to Single Slave (Multi-Source Replication)

Image may be NSFW.
Clik here to view.

Multi-Source Replication enables a replication slave to receive transactions from multiple sources simultaneously. Multi-source replication can be used to backup multiple servers to a single server, to merge table shards, and consolidate data from multiple servers to a single server.

MySQL and MariaDB have different implementations of multi-source replication, where MariaDB must have GTID with gtid-domain-id configured to distinguish the originating transactions while MySQL uses a separate replication channel for each master the slave replicates from. In MySQL, masters in a multi-source replication topology can be configured to use either global transaction identifier (GTID) based replication, or binary log position-based replication.

More on MariaDB multi source replication can be found in this blog post. For MySQL, please refer to the MySQL documentation.

Galera with Replication Slave (Hybrid Replication)

Image may be NSFW.
Clik here to view.

Hybrid replication is a combination of MySQL asynchronous replication and virtually synchronous replication provided by Galera. The deployment is now simplified with the implementation of GTID in MySQL replication, where setting up and performing master failover has become a straightforward process on the slave side.

Galera cluster performance is as fast as the slowest node. Having an asynchronous replication slave can minimize the impact on the cluster if you send long-running reporting/OLAP type queries to the slave, or if you perform heavy jobs that require locks like mysqldump. The slave can also serve as a live backup for onsite and offsite disaster recovery.

Hybrid replication is supported by ClusterControl and you can deploy it directly from the ClusterControl UI. For more information on how to do this, please read the blog posts - Hybrid replication with MySQL 5.6 and Hybrid replication with MariaDB 10.x.

ClusterControl
Single Console for Your Entire Database Infrastructure
Find out what else is new in ClusterControl

Preparing GCP and AWS Platforms

The "real-world" Problem

In this blog, we will demonstrate and use the "Multiple Replication" topology in which instances on two different public cloud platforms will communicate using MySQL Replication on different regions and on different availability zones. This scenario is based on a real-world problem where an organization wants to architect their infrastructure on multiple cloud platforms for scalability, redundancy, resiliency/fault-tolerance. Similar concepts would apply for MongoDB or PostgreSQL.

Let's consider a US organization, with an overseas branch in south east Asia. Our traffic is high within the Asian-based region. Latency must be low when catering for writes and reads, but at the same time the US-based region can also pull-up records coming from the Asian-based traffic.

The Cloud Architecture Flow

In this section, I will discuss the architectural design. First, we want to offer a highly-secure layer for which our Google Compute and AWS EC2 nodes can communicate, update or install packages from the internet, secure, highly-available in case an AZ (Availability Zone) goes down, can replicate and communicate to another cloud platform over a secured layer. See the image below for illustration:

Image may be NSFW.
Clik here to view.

Based on the illustration above, under the AWS platform, all nodes are running on different availability zones. It has a private and public subnet for which all the compute nodes are on a private subnet. Hence, it can go outside the internet to pull and update its system packages when needed. It has a VPN gateway for which it has to interact with GCP in that channel, bypassing the Internet but through a secure and private channel. Same as GCP, all compute nodes are on different availability zones, use NAT Gateway to update system packages when needed and use VPN connection to interact with the AWS nodes which are hosted on a different region, i.e. Asia Pacific (Singapore). On the other hand, the US-based region is hosted under us-east1. In order to access the nodes, one node in the architecture serves as the bastion-node for which we will use it as the jump host and install ClusterControl. This will be tackled later in this blog.

Setting up GCP and AWS Environments

When registering your first GCP account, Google provides a default VPC (Virtual Private Cloud) account. Hence, it's best to create a separate VPC than the default and customize it according to your needs.

Our goal here is to place the compute nodes in private subnets or nodes will not be setup with public IPv4. Hence, both public clouds must be able to talk to each other. The AWS and GCP compute nodes operate with different CIDRs as previously mentioned. Hence, here are the following CIDR:

AWS Compute Nodes: 172.21.0.0/16
GCP Compute Nodes: 10.142.0.0/20

In this AWS setup, we allocated three subnets which has no Internet Gateway but NAT Gateway; and one subnet which has an Internet Gateway. Each of these subnets are hosted individually in different Availability Zones (AZ).

ap-southeast-1a = 172.21.1.0/24
ap-southeast-1b = 172.21.8.0/24
ap-southeast-1c = 172.21.24.0/24

While in GCP, the default subnet created in a VPC under us-east1 which is 10.142.0.0/20 CIDR is used. Hence, these are the steps you can follow to setup your multi-public cloud platform.

  • For this exercise, I created a VPC in us-east1 region with the following subnet of 10.142.0.0/20. See below:

    Image may be NSFW.
    Clik here to view.
  • Reserve a Static IP. This is the IP that we will be setting up as a Customer Gateway in AWS

    Image may be NSFW.
    Clik here to view.
  • Since we have subnets in place (provisioned as subnet-us-east1), go to GCP -> VPC Network -> VPC Networks and select the VPC you created and go to the Firewall Rules. In this section, add the rules by specifying your ingress and egress. Basically, these are the inbound/outbound rules in AWS or your firewall for incoming and outgoing connections. In this setup, I opened all TCP protocols from the CIDR range set in my AWS and GCP VPC to make it simpler for the purpose of this blog. Hence, this is not the optimal way for security. See image below:

    Image may be NSFW.
    Clik here to view.

    The firewall-ssh here will be used to allow ssh, HTTP and HTTPS incoming connections.

  • Now switch to AWS and create a VPC. For this blog, I used CIDR (Classless Inter-Domain Routing) 172.21.0.0/16

  • Create the subnets for which you have to assign them in each AZ (Availability Zone); and at least reserve one subnet for a public subnet which will handle the NAT Gateway, and the rest are for EC2 nodes.

    Image may be NSFW.
    Clik here to view.
  • Next, create your Route Table and ensure that the "Destination" and "Targets" are set correctly. For this blog, I created 2 route tables. One which will handle the 3 AZ which my compute nodes will be assigned individually and will be assigned without an Internet Gateway as it will have no public IP. Then the other one will handle the NAT Gateway and will have an Internet Gateway which will be in the public subnet. See image below:

    Image may be NSFW.
    Clik here to view.

    and as mentioned, my example destination for private route that handles 3 subnets shows to have a NAT Gateway target plus a Virtual Gateway target which I will mention later in the incoming steps.

    Image may be NSFW.
    Clik here to view.
  • Next, create an "Internet Gateway" and assign it to the VPC that was previously created in the AWS VPC section. This Internet Gateway shall only be set as destination to the public subnet as it will be the service that has to connect to the internet. Obviously, the name stands for as an internet gateway service.

  • Next, create a "NAT Gateway". When creating a "NAT Gateway", ensure that you have assigned your NAT to a public-facing subnet. The NAT Gateway is your channel to access the internet from your private subnet or EC2 nodes that have no public IPv4 assigned. Then create or assign an EIP (Elastic IP) since, in AWS, only compute nodes that have public IPv4 assigned can connect to the internet directly.

  • Now, under VPC -> Security -> Security Groups (SG), your created VPC will have a default SG. For this setup, I created "Inbound Rules" with sources assigned for each CIDR i.e. 10.142.0.0/20 in GCP and 172.21.0.0/16 in AWS. See below:

    Image may be NSFW.
    Clik here to view.

    For "Outbound Rules", you can leave that as is since assigning rules to "Inbound Rules" is bilateral, which means it'll open as well for "Outbound Rules". Take note that this is not the optimal way for setting your Security Group; but to make it easier for this setup, I have made a wider scope of port range and source as well. Also that the protocol are specific for TCP connections only since we'll not be dealing with UDP for this blog.
    Additionally, you can leave your VPC -> Security -> Network ACLs untouched as long as it does not DENY any tcp connections from the CIDR stated in your source.

  • Next, we'll setup the VPN configuration which will be hosted under AWS platform. Under the VPC -> Customer Gateways, create the gateway using the static IP address that were created earlier in the previous step. Take a look at the image below:

    Image may be NSFW.
    Clik here to view.
  • Next, create a Virtual Private Gateway and attach this to the current VPC that we created previously in the previous step. See image below:

    Image may be NSFW.
    Clik here to view.
  • Now, create a VPN connection which will be used for the site-to-site connection between AWS and GCP. When creating a VPN connection, make sure that you have selected the correct Virtual Private Gateway and the Customer Gateway that we created in the previous steps. See image below:

    Image may be NSFW.
    Clik here to view.

    This might take some time while AWS is creating your VPN connection. When your VPN connection is then provisioned, you might wonder why under the Tunnel tab (after you select your VPN connection), it will show that the Outside IP Address is down. This is normal as there's no connection that has been established yet from the client. Take a look at the example image below:

    Image may be NSFW.
    Clik here to view.

    Once the VPN connection is ready, select your VPN connection created and download the configuration. It contains your credentials needed for the following steps to create a site-to-site VPN connection with the client.

    Note: In case you have setup your VPN where IPSEC IS UP but Status is DOWN just like the image below

    Image may be NSFW.
    Clik here to view.

    this is likely due to wrong values set to the specific parameters while setting up your BGP session or cloud router. Check it out here for troubleshooting your VPN.

  • Since we have a VPN connection ready hosted in AWS, let's create a VPN connection in GCP. Now, let's go back to GCP and setup the client connection there. In GCP, go to GCP -> Hybrid Connectivity -> VPN. Make sure that you are choosing the correct region, which is on this blog, we're using us-east1. Then select the static IP address created in the previous steps. See image below:

    Image may be NSFW.
    Clik here to view.

    Then in the Tunnels section, this is where you'll have to setup based on the downloaded credentials from the AWS VPN connection you created previously. I suggest to check out this helpful guide from Google. For example, one of the tunnels being setup is shown in the image below:

    Image may be NSFW.
    Clik here to view.

    Basically, the most important things here are the following:

    • Remote Peer Gateway: IP Address - This is the IP of the VPN server stated under the Tunnel Details -> Outside IP Address. This is not to be confused of the static IP we created under GCP. That is the Cloud VPN gateway -> IP address though.
    • Cloud router ASN - By default, AWS uses 65000. But likely, you'll get this information from the downloaded configuration file.
    • Peer router ASN - This is the Virtual Private Gateway ASN which is found in the downloaded configuration file.
    • Cloud Router BGP IP address - This is the Customer Gateway found in the downloaded configuration file.
    • BGP peer IP address - This is the Virtual Private Gateway found in the downloaded configuration file.
  • Take a look at the example configuration file I have below:

    Image may be NSFW.
    Clik here to view.

    for which you have to match this during adding your Tunnel under the GCP -> Hybrid Connectivity -> VPN connectivity setup. See the image below for which I created a cloud router and a BGP session during creating a sample tunnel:

    Image may be NSFW.
    Clik here to view.

    Then BGP session as,

    Image may be NSFW.
    Clik here to view.
    Image may be NSFW.
    Clik here to view.

    Note: The downloaded configuration file contains IPSec configuration tunnel for which AWS as well contains two (2) VPN servers ready for your connection. You must have to setup both of them so that you'll have a high available setup. Once its setup for both tunnels correctly, the AWS VPN connection under the Tunnels tab will show that both Outside IP Address are up. See image below:

    Image may be NSFW.
    Clik here to view.
  • Lastly, since we have created an Internet Gateway and NAT Gateway, populate the public and private subnets correctly with correct Destination and Target as noticed in the screenshot from previous steps. This can be setup by going to Services -> Networking & Content Delivery -> VPC -> Route Tables and select the created route tables mentioned from the previous steps. See the image below:

    Image may be NSFW.
    Clik here to view.
    Image may be NSFW.
    Clik here to view.

    As you noticed, the igw-01faa6d83da5df964 is the Internet Gateway that we created and is used by the public route. Whilst, the private route table has destination and target set to nat-07eb7a54e90dab61f and both of these have Destination set to 0.0.0.0/0 since it'll allow from different IPv4 connections. Also do not forget to set the Route Propagation correctly for the Virtual Gateway as seen in the screenshot which has a target vgw-0238040a5fd061515. Just click Route Propagation and set it to Yes just like in the screenshot below:

    Image may be NSFW.
    Clik here to view.

    This is very important so that the connection from the external GCP connections will route to the route tables in AWS and no further manual work needed. Otherwise, your GCP cannot establish connection to AWS.

Now that our VPN is up, we'll continue setting up our private nodes including the bastion host.

Setting up the Compute Engine Nodes

Setting up the Compute Engine/EC2 nodes will be fast and easy since we have all setup in place. I'll not go into that details but checkout the screenshots below as it explains the setup.

AWS EC2 Nodes:

Image may be NSFW.
Clik here to view.

GCP Compute Nodes:

Image may be NSFW.
Clik here to view.

Basically, on this setup. The host clustercontrol will be the bastion or jump host and for which the ClusterControl will be installed. Obviously, all the nodes here are not internet accessible. They have no External IPv4 assigned and nodes are communicating through a very secure channel using VPN.

Lastly, all these nodes from AWS to GCP are setup with one uniform system user with sudo access, which is needed in our next section. See how ClusterControl can make your life easier when in multicloud and multi-region.

ClusterControl To The Rescue!!!

Handling multiple nodes and on different public cloud platforms, plus on a different "Region" can be a "truly-painful-and-daunting" task. How do you monitor that effectively? ClusterControl acts not only as your swiss-knife, but also as your Virtual DBA. Now, let’s see how ClusterControl can make your life easier.

Creating a Multiple-Replication Cluster using ClusterControl

Now let's try to create a MariaDB master-slave replication cluster following the "Multiple Replication" topology.

Image may be NSFW.
Clik here to view.
ClusterControl Deploy Wizard

Hitting Deploy button will install packages and setup the nodes accordingly. Hence, a logical view of how the topology would look like:

Image may be NSFW.
Clik here to view.
ClusterControl - Topology View

The nodes 172.21.0.0/16 range IP's are replicating from it's master running on GCP.

Now, how about we try to load some writes on the master? Any issues with connectivity or latency might generate slave lag, you will be able to spot this with ClusterControl. See the screenshot below:

Image may be NSFW.
Clik here to view.

and as you see in the top-right corner of the screenshot, it turns red as it indicates issues were detected. Hence, an alarm was being sent while this issue has been detected. See below:

Image may be NSFW.
Clik here to view.

We need to dig into this. For fine-grained monitoring, we have enabled agents on the database instances. Let’s have a look at the Dashboard.

Image may be NSFW.
Clik here to view.
Image may be NSFW.
Clik here to view.

It offers a super smooth experience in terms of monitoring your nodes.

Image may be NSFW.
Clik here to view.

It tells us that utilization is high or host is not responding. Although this was just a ping response failure, you can ignore the alert to stop you from bombarding it. Hence, you can ‘un-ignore’ it if needed by going to Cluster -> Alarms in the Clustercontrol. See below:

Image may be NSFW.
Clik here to view.

Managing Failures and Performing Failover

Let's say that the us-east1 master node failed, or requires a major overhaul because of system or hardware upgrade. Let's say this is the topology right now (see image below):

Image may be NSFW.
Clik here to view.

Let's try to shutdown host 10.142.0.7 which is the master under the region us-east1. See the screenshots below how ClusterControl reacts to this:

Image may be NSFW.
Clik here to view.

ClusterControl sends alarms once it detects anomalies in the cluster. Then it tries to do a failover to a new master by choosing the right candidate (see image below):

Image may be NSFW.
Clik here to view.

Then, it set aside the failed master which has been already taken out from the cluster (see image below):

Image may be NSFW.
Clik here to view.

This is just a glimpse of what ClusterControl can do, there are other great features such as backups, query monitoring, deploying/managing load balancers, and many more!

Conclusion

Managing your MySQL Replication setup in a multicloud can be tricky. Much care must be taken to secure our setup, so hopefully this blog gives an idea on how to define subnets and protect the database nodes. After security, there are a number of things to manage and this is where ClusterControl can be very helpful.

Try it now and do let us know how it goes. You can contact us here anytime.

How to Deploy Highly Available PostgreSQL with Single Endpoint for WordPress

Image may be NSFW.
Clik here to view.

WordPress is an open source software you can use to create your website, blog, or application. There are many designs and features/plugins to add to your WordPress installation. WordPress is a free software, however, there are many commercial plugins to improve it depending on your requirements.

WordPress makes it easy for you to manage your content and it’s really flexible. Create drafts, schedule publication, and look at your post revisions. Make your content public or private, and secure posts and pages with a password.

To run WordPress you should have at least PHP version 5.2.4+, MySQL version 5.0+ (or MariaDB), and Apache or Nginx. Some of these versions have reached EOL and you may expose your site to security vulnerabilities, so you should install the latest version available according to your environment.

As we could see, currently, WordPress only supports the MySQL and MariaDB database engines. WPPG is a plugin based on PG4WP plugin, that gives you the possibility to install and use WordPress with a PostgreSQL database as a backend. It works by replacing calls to MySQL specific functions with generic calls that map them to other database functions and rewriting SQL queries on the fly when needed.

For this blog, we’ll install 1 Application Server with WordPress 5.1.1 and HAProxy, 1.5.18 in the same server, and 2 PostgreSQL 11 database nodes (Master-Standby). All the operating system will be CentOS 7. For the databases and load balancer deploy we’ll use the ClusterControl system.

Image may be NSFW.
Clik here to view.

This is a basic environment. You can improve it by adding more high availability features as you can see here. So, let’s start.

Database Deployment

First, we need to install our PostgreSQL database. For this, we’ll assume you have ClusterControl installed.

To perform a deployment from ClusterControl, simply select the option “Deploy” and follow the instructions that appear.

Image may be NSFW.
Clik here to view.

When selecting PostgreSQL, we must specify User, Key or Password and port to connect by SSH to our servers. We also need a name for our new cluster and if we want ClusterControl to install the corresponding software and configurations for us.

Image may be NSFW.
Clik here to view.

After setting up the SSH access information, we must define the database user, version and datadir (optional). We can also specify which repository to use.

In the next step, we need to add our servers to the cluster that we are going to create.

Image may be NSFW.
Clik here to view.

When adding our servers, we can enter IP or hostname.

In the last step, we can choose if our replication will be Synchronous or Asynchronous.

Image may be NSFW.
Clik here to view.

We can monitor the status of the creation of our new cluster from the ClusterControl activity monitor.

Image may be NSFW.
Clik here to view.

Once the task is finished, we can see our cluster in the main ClusterControl screen.

Image may be NSFW.
Clik here to view.

Once we have our cluster created, we can perform several tasks on it, like adding a load balancer (HAProxy) or a new replica.

ClusterControl
Single Console for Your Entire Database Infrastructure
Find out what else is new in ClusterControl

Load Balancer Deployment

To perform a load balancer deployment, in this case, HAProxy, select the option “Add Load Balancer” in the cluster actions and fill the asked information.

Image may be NSFW.
Clik here to view.

We only need to add IP/Name, port, policy and the nodes we are going to use. By default, HAProxy is configured by ClusterControl with two different ports, one read-write and one read-only. In the read-write port, only the master is UP. In case of failure, ClusterControl will promote the most advanced slave and it’ll change the HAProxy configuration to enable the new master and disable the old one. In this way, we’ll have automatic failover in case of failure.

Image may be NSFW.
Clik here to view.

If we followed the previous steps, we should have the following topology:

Image may be NSFW.
Clik here to view.

So, we have a single endpoint created in the Application Server with HAProxy. Now, we can use this endpoint in the application as a localhost connection.

WordPress Installation

Let’s install WordPress on our Application Server and configure it to connect to the PostgreSQL database by using the local HAProxy port 3307.

First, install the packages required on the Application Server.

$ yum install httpd php php-mysql php-pgsql postgresql
$ systemctl start httpd && systemctl enable httpd

Download the latest WordPress version and move it to the apache document root.

$ wget https://wordpress.org/latest.tar.gz
$ tar zxf latest.tar.gz
$ mv wordpress /var/www/html/

Download the WPPG plugin and move it into the wordpress plugins directory.

$ wget https://downloads.wordpress.org/plugin/wppg.1.0.1.zip
$ unzip wppg.1.0.1.zip
$ mv wppg /var/www/html/wordpress/wp-content/plugins/

Copy the db.php file to the wp-content directory. Then, edit it and change the 'PG4WP_ROOT' path:

$ cp /var/www/html/wordpress/wp-content/plugins/wppg/pg4wp/db.php /var/www/html/wordpress/wp-content/
$ vi /var/www/html/wordpress/wp-content/db.php
define( 'PG4WP_ROOT', ABSPATH.'wp-content/plugins/wppg/pg4wp');

Rename the wp-config.php and change the database information:

$ mv /var/www/html/wordpress/wp-config-sample.php /var/www/html/wordpress/wp-config.php
$ vi /var/www/html/wordpress/wp-config.php
define( 'DB_NAME', 'wordpressdb' );
define( 'DB_USER', 'wordpress' );
define( 'DB_PASSWORD', 'wpPassword' );
define( 'DB_HOST', 'localhost:3307' );

Then, we need to create the database and the application user in the PostgreSQL database. On the master node:

$ postgres=# CREATE DATABASE wordpressdb;
CREATE DATABASE
$ postgres=# CREATE USER wordpress WITH PASSWORD 'wpPassword';
CREATE ROLE
$ postgres=# GRANT ALL PRIVILEGES ON DATABASE wordpressdb TO wordpress;
GRANT

And edit the pg_hba.conf file to allow the connection from the Application Server.

$ Vi /var/lib/pgsql/11/data/pg_hba.conf
host  all  all  192.168.100.153/24  md5
$ systemctl reload postgresql-11

Make sure you can access it from the Application Server:

$ psql -hlocalhost -p3307 -Uwordpress wordpressdb
Password for user wordpress:
psql (9.2.24, server 11.2)
WARNING: psql version 9.2, server version 11.0.
         Some psql features might not work.
Type "help" for help.
wordpressdb=>

Now, go to the install.php in the web browser, in our case, the IP Address for the Application Server is 192.168.100.153, so, we go to:

http://192.168.100.153/wordpress/wp-admin/install.php

Image may be NSFW.
Clik here to view.

Add the Site Title, Username and Password to access the admin section, and your email address.

Image may be NSFW.
Clik here to view.

Finally, go to Plugins -> Installed Plugins and activate the WPPG plugin.

Conclusion

Now, we have WordPress running with PostgreSQL by using a single endpoint. We can monitor our cluster activity on ClusterControl checking the different metrics, dashboards or many performance and management features.

There are different ways to implement WordPress with PostgreSQL. It could be by using a different plugin, or by installing WordPress as usual and adding the plugin later, but in any case, as we mentioned, PostgreSQL is not officially supported by WordPress, so we must perform an exhaustive testing process if we want to use this topology in production.

An Introduction to Time Series Databases

Image may be NSFW.
Clik here to view.

Long gone are the times where “the” database was single Relational Database Management System installed typically on the most powerful server in the datacenter. Such database served all kinds of requests - OLTP, OLAP, anything business required. Nowadays databases run on commodity hardware, they are also more sophisticated in terms of the high availability and specialized to handle particular type of traffic. Specialization allows them to achieve much better performance - everything is optimized to deal with a particular kind of data: optimizer, storage engine, even language doesn’t have to be SQL, like it used to be in the past. It can be SQL-based with some extensions allowing for more efficient data manipulation, or it can be as well something totally new, created from scratch.

Today we have analytical, columnar databases like ClickHouse or MariaDB AX, we have big data platforms like Hadoop, NoSQL solutions like MongoDB or Cassandra, key-value datastores like Redis. We also have Time-Series databases like Prometheus or TimeScaleDB. This is what we will focus on in this blog post. Time-Series databases - what are they and why you would want to use yet another datastore in your environment.

What Time-Series Databases Are For?

As the name suggests, time-series databases are designed to store data that changes with time. This can be any kind of data which was collected over time. It might be metrics collected from some systems - all trending systems are examples of the time-series data.

Image may be NSFW.
Clik here to view.

Whenever you look at the dashboards in ClusterControl, you’re actually looking at the visual representation of the time-series data stored in Prometheus, a time-series database.

Time-series data is not limited to database metrics. Everything can be a metric. How the flow of people entering a mall changes over time? How traffic changes in a city? How the usage of the public transport changes during the day? Water flow in a stream or a river. Amount of energy generated by a water plant. All of this and everything else which can be measured in time is an example of the time-series data. Such data you can query, plot, analyze in order to find correlations between different metrics.

How Data is Structured in a Time-Series Database?

As you can imagine, the most important piece of data in the time-series database is time. There are two main ways of storing data. One, something that resembles key-value storage may look like this:

TimestampMetric 1
2019-03-28 00:00:012356
2019-03-28 00:00:026874
2019-03-28 00:00:033245
2019-03-28 00:00:042340

In short, for every timestamp we has some value for our metric.

Another example will involve more metrics. Instead of storing each metric in a separate table or collection, it is possible to store multiple metrics alongside.

TimestampMetric 1Metric 2Metric 3Metric 4Metric 5
2019-03-28 00:00:01765873124980
2019-03-28 00:00:0258767658727864634
2019-03-28 00:00:032347679986534
2019-03-28 00:00:04345359807345

This data structure helps to query the data more efficiently when the metrics are related. Instead of reading multiple tables and joining them to get all the metrics together, it is enough to read one single table and all the data is ready to be processed and presented.

You may wonder - what is really new here? How does this differ from a regular table in MySQL or other relational database? Well, the table design is quite similar but there are significant differences in the workload which, when a datastore is designed to exploit them, may significantly improve performance.

Time-series data typically is only appended - it is quite unlikely that you will be updating old data. You typically do not delete particular rows, on the other hand you may want some sort of the aggregation of the data over time. This, when taken into account when designing the database internals, will make a significant difference over “standard” relational (and not relational also) databases intended to serve Online Transaction Processing type of traffic: what is the most important is the ability to consistently store (jngest) large amounts of data that is coming in with time.

It is possible to use an RDBMS to store time-series data, but the RDBMS is not optimized for it. Data and indexes generated on the back of it can get very large, and slow to query. Storage engines used in RDBMS are designed to store a variety of different data types. They are typically optimized for Online Transaction Processing workload which includes frequent data modification and deletion. Relational databases also tend to lack specialized functions and features related to processing time-series data. We mentioned that you probably want to aggregate data that is older than a certain period of time. You may also want to be able to easily run some statistical functions on your time-series data to smooth it up, determine and compare trends, interpolate data and many more. For example, here you can find some of the functions Prometheus makes available to the users.

ClusterControl
Single Console for Your Entire Database Infrastructure
Find out what else is new in ClusterControl

Examples of Time-series Databases

There are multiple existing time-series databases on the market so it is not possible to cover all of them. We would still like to give some examples of the time-series databases which you may know or maybe even used (knowingly or not).

InfluxDB

InfluxDB has been created by InfluxData. It is an open-source time-series database written in Go. The datastore provides SQL-like language to query the data, which makes it easy for the developers to integrate into their applications. InfluxDB works also as part of a commercial offering, which covers the whole stack designed to provide a full-featured, highly available environment for processing time-series data.

Prometheus

Prometheus is another open source project that is also written in Go. It is commonly used as a backend for different open source tools and projects, for example Percona Monitoring and Management. Prometheus is also been a time-series database of choice for ClusterControl.

Image may be NSFW.
Clik here to view.

Prometheus can be deployed from ClusterControl to be used to store the time-series data collected on the database servers monitored and managed by ClusterControl:

Image may be NSFW.
Clik here to view.

Being used widely in the open source world, Prometheus is quite easy to integrate into your existing environment using multiple exporters.

RRDtool

This might be an example of time-series database which many people use without knowing they do that. RRDtool is a very popular open source project for storing and visualising time-series data. If you ever used Cacti, it was based on RRDtool. If you designed your own solution, it is quite likely that you also used RRDtool as the backend to store your data. Nowadays it is not as popular as it used to be but back in 2000 - 2010 this was the most common way of storing the time-series data. Fun fact - early versions of ClusterControl made use of it.

TimeScale

TimeScale is a time-series database developed on top of the PostgreSQL. It is an extension on PostgreSQL, which rely on the underlying datastore for providing access to data, which means it accepts all the SQL you may want to use. Being an extension, it utilizes all the other features and extensions of PostgreSQL. You can mix time-series and other type of data, for example to join time-series and metadata, enriching the output. You can also do more advanced filtering utilizing JOINs and non-time-series tables. Leveraging GIS support in PostgreSQL TimeScale can easily used in tracking geographical locations over time. It can also leverage all the scaling possibilities that PostgreSQL offers, including replication.

Timestream

Amazon Web Services also has an offering for time-series databases. Timestream has been announced quite recently, in November, 2018. It adds another datastore to the AWS portfolio, this time helping users to handle time-series data coming from sources like Internet of Things appliances or monitored services. It also can be used to store metrics derived from logs created by multiple services, allowing users to run analytical queries on them, helping to understand patterns and conditions under which services work.

Timestream, as most AWS services, provides an easy way of scaling should the need for storing and analyzing the data grow in time.

As you can see, there are numerous options on the market and this is not surprising. Time-series data analysis is getting more and more traction recently, it becomes more and more critical for business operations. Luckily, given the large number of offerings, both open source and commercial, it is quite likely that you can find a tool which will suit your needs.

Powering Global eCommerce with ClusterControl

Image may be NSFW.
Clik here to view.

In this blog we want to highlight three global eCommerce companies who have leveraged ClusterControl to manage and monitor the databases behind their powerful and innovative applications.

Each eCommerce platform & application has unique needs when it comes to database management. For some applications the need to protect their users data is paramount, for others speed and performance is the key requirement. Because of this uniqueness it is important to choose the right technology from the start as well as develop strategies to ensure that the databases consistently perform at optimal levels.

Below we will highlight three ClusterControl eCommerce users and what challenges they faced in building a highly-available, eCommerce database infrastructure. If you want to learn more, you can read their individual case studies which goes into greater detail.

Instant Gaming

Image may be NSFW.
Clik here to view.

The migration from physical game boxes and discs has been rapidly moving online with platforms like Steam, uPlay, Xbox & PlayStation Network growing in popularity. This trend, being fueled by the rapid increase in internet bandwidth, lets users buy and immediately download the games.

Instant-Gaming.com has positioned themselves as a leader in this space selling games that can be installed on a variety of platforms.

Due to rapid growth it was not uncommon for the company to have surges of activity that resulted in a strain on their infrastructure. The downtime from these performance issues caused an impact to their business and revenue. As they put it: “Downtime is critical for e-commerce as your revenue stream depends on your uptime.”

Built using a custom-made eCommerce framework, Instant Gaming’s front-end applications used a MySQL database deployed in Master - Slave mode, with manual failover. The same database was used for back office applications like order management, billing, inventory and customer data. The applications ran in a Docker environment, while the database itself ran on barebone hardware.

The team began using ClusterControl and its pre-configured MySQL HA deployment features and the automatic failover function. This resulted in improved reliability and stability for their platform.

You can read more about Instant Gaming here.

OxyShop

Image may be NSFW.
Clik here to view.

In the Czech Republic, there aren’t many companies who understand the challenges of eCommerce like OxyShop. They design custom eCommerce solutions for a variety of regional customers using a high-quality, custom-built web platform.

OxyShop also offers their clients managed options as well. In these scenarios they are not only responsible for designing and developing the application but also for providing SLAs of performance of the site.

When a particularly demanding customer approached them about building a new site, one that was predicted to have a large amount of traffic, they knew they needed a better way of handling the database traffic in order to guarantee uptime.

The OxyShop team decided that it was neither cost effective nor would it fit their aggressive project schedule to build a custom solution. ClusterControl, however, allowed them to manage a highly available PostgreSQL setup. It would detect any primary node failures, promote a secondary node with the most recent data and failover to it.

You can read more about OxyShop here.

ClusterControl
Single Console for Your Entire Database Infrastructure
Find out what else is new in ClusterControl

SportPesa

Image may be NSFW.
Clik here to view.

Online gambling and offshore betting are booming businesses. Based in Kenya, SportPesa is Africa’s largest betting platform.

The system behind SportPesa handles an enormous amount of traffic. From tracking bets to collecting money, making payments to mobile transactions, or simply keeping up with the latest betting statistics, data is at the core of the online gambling business. Distributed, in-memory clusters are employed to handle this massive amount of traffic, but the explosive growth and high traffic during peak times was a cause of concern as it was a source of instability.

The company, while searching for solutions to configuration and performance challenges, decided to give ClusterControl a shot. Impressed by the knowledge of MySQL Cluster, the SportPesa team then decided to download and give ClusterControl a try.

What did they find? With ClusterControl’s automation, advanced monitoring and performance management capabilities they had this to say… “Severalnines has deep database competence, and can be a trusted partner when building high performance, distributed database systems.”

You can read more about SportPesa here.

Conclusion

If you have an eCommerce application that needs highly-available, high-performance databases that can automatically recover when disaster strikes, then why not give ClusterControl a try?


MySQL Replication for High Availability - New Whitepaper

Image may be NSFW.
Clik here to view.

We’re happy to announce that our newly updated whitepaper MySQL Replication for High Availability is now available to download for free!

MySQL Replication enables data from one MySQL database server to be copied automatically to one or more MySQL database servers.

Unfortunately database downtime is often caused by sub-optimal HA setups, manual/prolonged failover times, and manual failover of applications. This technology is common knowledge for DBAs worldwide, but maintaining those high availability setups can sometimes be a challenge.

In this whitepaper, we discuss the latest features in MySQL 5.6, 5.7 & 8.0 as well as show you how to deploy and manage a replication setup. We also show how ClusterControl gives you all the tools you need to ensure your database infrastructure performs at peak proficiency.

Topics included in this whitepaper are …

  • What is MySQL Replication?
    • Replication Scheme
      • Asynchronous Replication
      • Semi-Synchronous Replication
    • Global Transaction Identifier (GTID)
      • Replication in MySQL 5.5 and Earlier
      • How GTID Solves the Problem
      • MariaDB GTID vs MySQL GTID
    • Multi-Threaded Slave
    • Crash-Safe Slave
    • Group Commit
  • Topology for MySQL Replication
    • Master with Slaves (Single Replication)
    • Master with Relay Slaves (Chain Replication)
    • Master with Active Master (Circular Replication)
    • Master with Backup Master (Multiple Replication)
    • Multiple Masters to Single Slave (Multi-Source Replication)
    • Galera with Replication Slave (Hybrid Replication)
  • Deploying a MySQL Replication Setup
    • General and SSH Settings
    • Define the MySQL Servers
    • Define Topology
    • Scaling Out
  • Connecting Application to the Replication Setup
    • Application Connector
    • Fabric-Aware Connector
    • Reverse Proxy/Load Balancer
      • MariaDB MaxScale
      • ProxySQL
      • HAProxy (Master-Slave Replication)
  • Failover with ClusterControl
    • Automatic Failover of Master
      • Whitelists and Blacklists
    • Manual Failover of Master
    • Failure of a Slave
    • Pre and Post-Failover Scripts
      • When Hooks Can Be Useful?
        • Service Discovery
        • Proxy Reconfiguration
        • Additional Logging
  • Operations - Managing Your MySQL Replication Setup
    • Show Replication Status
    • Start/Stop Replication
    • Promote Slave
    • Rebuild Replication Slave
    • Backup
    • Restore
    • Software Upgrade
    • Configuration Changes
    • Schema Changes
    • Topology Changes
  • Issues and Troubleshooting
    • Replication Status
    • Replication Lag
    • Data Drifting
    • Errant Transaction
    • Corrupted Slave
    • Recommendations

Download the whitepaper today!

ClusterControl
Single Console for Your Entire Database Infrastructure
Find out what else is new in ClusterControl

About ClusterControl

ClusterControl is the all-inclusive open source database management system for users with mixed environments that removes the need for multiple management tools. ClusterControl provides advanced deployment, management, monitoring, and scaling functionality to get your MySQL, MongoDB, and PostgreSQL databases up-and-running using proven methodologies that you can depend on to work. At the core of ClusterControl is it’s automation functionality that lets you automate many of the database tasks you have to perform regularly like deploying new databases, adding and scaling new nodes, running backups and upgrades, and more.

To learn more about ClusterControl click here.

About Severalnines

Severalnines provides automation and management software for database clusters. We help companies deploy their databases in any environment, and manage all operational aspects to achieve high-scale availability.

Severalnines' products are used by developers and administrators of all skills levels to provide the full 'deploy, manage, monitor, scale' database cycle, thus freeing them from the complexity and learning curves that are typically associated with highly available database clusters. Severalnines is often called the “anti-startup” as it is entirely self-funded by its founders. The company has enabled over 32,000 deployments to date via its popular product ClusterControl. Currently counting BT, Orange, Cisco, CNRS, Technicolor, AVG, Ping Identity and Paytrail as customers. Severalnines is a private company headquartered in Stockholm, Sweden with offices in Singapore, Japan and the United States. To see who is using Severalnines today visit, https://www.severalnines.com/company.

Database High Availability for Camunda BPM using MySQL or MariaDB Galera Cluster

Image may be NSFW.
Clik here to view.

Camunda BPM is an open-source workflow and decision automation platform. Camunda BPM ships with tools for creating workflow and decision models, operating deployed models in production, and allowing users to execute workflow tasks assigned to them.

By default, Camunda comes with an embedded database called H2, which works pretty decently within a Java environment with relatively small memory footprint. However, when it comes to scaling and high availability, there are other database backends that might be more appropriate.

In this blog post, we are going to deploy Camunda BPM 7.10 Community Edition on Linux, with a focus on achieving database high availability. Camunda supports major databases through JDBC drivers, namely Oracle, DB2, MySQL, MariaDB and PostgreSQL. This blog only focuses on MySQL and MariaDB Galera Cluster, with different implementation on each - one with ProxySQL as database load balancer, and the other using the JDBC driver to connect to multiple database instances. Take note that this article does not cover on high availability for the Camunda application itself.

Prerequisite

Camunda BPM runs on Java. In our CentOS 7 box, we have to install JDK and the best option is to use the one from Oracle, and skip using the OpenJDK packages provided in the repository. On the application server where Camunda should run, download the latest Java SE Development Kit (JDK) from Oracle by sending the acceptance cookie:

$ wget --header "Cookie: oraclelicense=accept-securebackup-cookie" https://download.oracle.com/otn-pub/java/jdk/12+33/312335d836a34c7c8bba9d963e26dc23/jdk-12_linux-x64_bin.rpm

Install it on the host:

$ yum localinstall jdk-12_linux-x64_bin.rpm

Verify with:

$ java --version
java 12 2019-03-19
Java(TM) SE Runtime Environment (build 12+33)
Java HotSpot(TM) 64-Bit Server VM (build 12+33, mixed mode, sharing)

Create a new directory and download Camunda Community for Apache Tomcat from the official download page:

$ mkdir ~/camunda
$ cd ~/camunda
$ wget --content-disposition 'https://camunda.org/release/camunda-bpm/tomcat/7.10/camunda-bpm-tomcat-7.10.0.tar.gz'

Extract it:

$ tar -xzf camunda-bpm-tomcat-7.10.0.tar.gz

There are a number of dependencies we have to configure before starting up Camunda web application. This depends on the chosen database platform like datastore configuration, database connector and CLASSPATH environment. The next sections explain the required steps for MySQL Galera (using Percona XtraDB Cluster) and MariaDB Galera Cluster.

Note that the configurations shown in this blog are based on Apache Tomcat environment. If you are using JBOSS or Wildfly, the datastore configuration will be a bit different. Refer to Camunda documentation for details.

MySQL Galera Cluster (with ProxySQL and Keepalived)

We will use ClusterControl to deploy MySQL-based Galera cluster with Percona XtraDB Cluster. There are some Galera-related limitations mentioned in the Camunda docs surrounding Galera multi-writer conflicts handling and InnoDB isolation level. In case you are affected by these, the safest way is to use the single-writer approach, which is achievable with ProxySQL hostgroup configuration. To provide no single-point of failure, we will deploy two ProxySQL instances and tie them with a virtual IP address by Keepalived.

The following diagram illustrates our final architecture:

Image may be NSFW.
Clik here to view.

First, deploy a three-node Percona XtraDB Cluster 5.7. Install ClusterControl, generate a SSH key and setup passwordless SSH from ClusterControl host to all nodes (including ProxySQL). On ClusterControl node, do:

$ whoami
root
$ ssh-keygen -t rsa
$ for i in 192.168.0.21 192.168.0.22 192.168.0.23 192.168.0.11 192.168.0.12; do ssh-copy-id $i; done

Before we deploy our cluster, we have to modify the MySQL configuration template file that ClusterControl will use when installing MySQL servers. The template file name is my57.cnf.galera and located under /usr/share/cmon/templates/ on the ClusterControl host. Make sure the following lines exist under [mysqld] section:

[mysqld]
...
transaction-isolation=READ-COMMITTED
wsrep_sync_wait=7
...

Save the file and we are good to go. The above are the requirements as stated in Camunda docs, especially on the supported transaction isolation for Galera. Variable wsrep_sync_wait is set to 7 to perform cluster-wide causality checks for READ (including SELECT, SHOW, and BEGIN or START TRANSACTION), UPDATE, DELETE, INSERT, and REPLACE statements, ensuring that the statement is executed on a fully synced node. Keep in mind that value other than 0 can result in increased latency.

Go to ClusterControl -> Deploy -> MySQL Galera and specify the following details (if not mentioned, use the default value):

  • SSH User: root
  • SSH Key Path: /root/.ssh/id_rsa
  • Cluster Name: Percona XtraDB Cluster 5.7
  • Vendor: Percona
  • Version: 5.7
  • Admin/Root Password: {specify a password}
  • Add Node: 192.168.0.21 (press Enter), 192.168.0.22 (press Enter), 192.168.0.23 (press Enter)

Make sure you got all the green ticks, indicating ClusterControl is able to connect to the node passwordlessly. Click "Deploy" to start the deployment.

Create the database, MySQL user and password on one of the database nodes:

mysql> CREATE DATABASE camunda;
mysql> CREATE USER camunda@'%' IDENTIFIED BY 'passw0rd';
mysql> GRANT ALL PRIVILEGES ON camunda.* TO camunda@'%';

Or from the ClusterControl interface, you can use Manage -> Schema and Users instead:

Image may be NSFW.
Clik here to view.

Once cluster is deployed, install ProxySQL by going to ClusterControl -> Manage -> Load Balancer -> ProxySQL -> Deploy ProxySQL and enter the following details:

  • Server Address: 192.168.0.11
  • Administration Password:
  • Monitor Password:
  • DB User: camunda
  • DB Password: passw0rd
  • Are you using implicit transactions?: Yes

Repeat the ProxySQL deployment step for the second ProxySQL instance, by changing the Server Address value to 192.168.0.12. The virtual IP address provided by Keepalived requires at least two ProxySQL instances deployed and running. Finally, deploy virtual IP address by going to ClusterControl -> Manage -> Load Balancer -> Keepalived and pick both ProxySQL nodes and specify the virtual IP address and network interface for the VIP to listen:

Image may be NSFW.
Clik here to view.

Our database backend is now complete. Next, import the SQL files into the Galera Cluster as the created MySQL user. On the application server, go to the "sql" directory and import them into one of the Galera nodes (we pick 192.168.0.21):

$ cd ~/camunda/sql/create
$ yum install mysql #install mysql client
$ mysql -ucamunda -p -h192.168.0.21 camunda < mysql_engine_7.10.0.sql
$ mysql -ucamunda -p -h192.168.0.21 camunda < mysql_identity_7.10.0.sql

Camunda does not provide MySQL connector for Java since its default database is H2. On the application server, download MySQL Connector/J from MySQL download page and copy the JAR file into Apache Tomcat bin directory:

$ wget https://dev.mysql.com/get/Downloads/Connector-J/mysql-connector-java-8.0.15.tar.gz
$ tar -xzf mysql-connector-java-8.0.15.tar.gz
$ cd mysql-connector-java-8.0.15
$ cp mysql-connector-java-8.0.15.jar ~/camunda/server/apache-tomcat-9.0.12/bin/

Then, set the CLASSPATH environment variable to include the database connector. Open setenv.sh using text editor:

$ vim ~/camunda/server/apache-tomcat-9.0.12/bin/setenv.sh

And add the following line:

export CLASSPATH=$CLASSPATH:$CATALINA_HOME/bin/mysql-connector-java-8.0.15.jar

Open ~/camunda/server/apache-tomcat-9.0.12/conf/server.xml and change the lines related to datastore. Specify the virtual IP address as the MySQL host in the connection string, with ProxySQL port 6033:

<Resource name="jdbc/ProcessEngine"
              ...
              driverClassName="com.mysql.jdbc.Driver" 
              defaultTransactionIsolation="READ_COMMITTED"
              url="jdbc:mysql://192.168.0.10:6033/camunda"
              username="camunda"  
              password="passw0rd"
              ...
/>

Finally, we can start the Camunda service by executing start-camunda.sh script:

$ cd ~/camunda
$ ./start-camunda.sh
starting camunda BPM platform on Tomcat Application Server
Using CATALINA_BASE:   ./server/apache-tomcat-9.0.12
Using CATALINA_HOME:   ./server/apache-tomcat-9.0.12
Using CATALINA_TMPDIR: ./server/apache-tomcat-9.0.12/temp
Using JRE_HOME:        /
Using CLASSPATH:       :./server/apache-tomcat-9.0.12/bin/mysql-connector-java-8.0.15.jar:./server/apache-tomcat-9.0.12/bin/bootstrap.jar:./server/apache-tomcat-9.0.12/bin/tomcat-juli.jar
Tomcat started.

Make sure the CLASSPATH shown in the output includes the path to the MySQL Connector/J JAR file. After the initialization completes, you can then access Camunda webapps on port 8080 at http://192.168.0.8:8080/camunda/. The default username is demo with password 'demo':

Image may be NSFW.
Clik here to view.

You can then see the digested capture queries from Nodes -> ProxySQL -> Top Queries, indicating the application is interacting correctly with the Galera Cluster:

Image may be NSFW.
Clik here to view.

There is no read-write splitting configured for ProxySQL. Camunda uses "SET autocommit=0" on every SQL statement to initialize transaction and the best way for ProxySQL to handle this by sending all the queries to the same backend servers of the target hostgroup. This is the safest method alongside better availability. However, all connections might end up reaching a single server, so there is no load balancing.

MariaDB Galera

MariaDB Connector/J is able to handle a variety of connection modes - failover, sequential, replication and aurora - but Camunda only supports failover and sequential. Taken from MariaDB Connector/J documentation:

ModeDescription
sequential
(available since 1.3.0)
This mode supports connection failover in a multi-master environment, such as MariaDB Galera Cluster. This mode does not support load-balancing reads on slaves. The connector will try to connect to hosts in the order in which they were declared in the connection URL, so the first available host is used for all queries. For example, let's say that the connection URL is the following:
jdbc:mariadb:sequential:host1,host2,host3/testdb
When the connector tries to connect, it will always try host1 first. If that host is not available, then it will try host2. etc. When a host fails, the connector will try to reconnect to hosts in the same order.
failover
(available since 1.2.0)
This mode supports connection failover in a multi-master environment, such as MariaDB Galera Cluster. This mode does not support load-balancing reads on slaves. The connector performs load-balancing for all queries by randomly picking a host from the connection URL for each connection, so queries will be load-balanced as a result of the connections getting randomly distributed across all hosts.

Using "failover" mode poses a higher potential risk of deadlock, since writes will be distributed to all backend servers almost equally. Single-writer approach is a safe way to run, which means using sequential mode should do the job pretty well. You also can skip the load-balancer tier in the architecture. Hence with MariaDB Java connector, we can deploy our architecture as simple as below:

Image may be NSFW.
Clik here to view.

Before we deploy our cluster, modify the MariaDB configuration template file that ClusterControl will use when installing MariaDB servers. The template file name is my.cnf.galera and located under /usr/share/cmon/templates/ on ClusterControl host. Make sure the following lines exist under [mysqld] section:

[mysqld]
...
transaction-isolation=READ-COMMITTED
wsrep_sync_wait=7
performance_schema = ON
...

Save the file and we are good to go. A bit of explanation, the above list are the requirements as stated in Camunda docs, especially on the supported transaction isolation for Galera. Variable wsrep_sync_wait is set to 7 to perform cluster-wide causality checks for READ (including SELECT, SHOW, and BEGIN or START TRANSACTION), UPDATE, DELETE, INSERT, and REPLACE statements, ensuring that the statement is executed on a fully synced node. Keep in mind that value other than 0 can result in increased latency. Enabling Performance Schema is optional for ClusterControl query monitoring feature.

Now we can start the cluster deployment process. Install ClusterControl, generate a SSH key and setup passwordless SSH from ClusterControl host to all Galera nodes. On ClusterControl node, do:

$ whoami
root
$ ssh-keygen -t rsa
$ for i in 192.168.0.41 192.168.0.42 192.168.0.43; do ssh-copy-id $i; done

Go to ClusterControl -> Deploy -> MySQL Galera and specify the following details (if not mentioned, use the default value):

  • SSH User: root
  • SSH Key Path: /root/.ssh/id_rsa
  • Cluster Name: MariaDB Galera 10.3
  • Vendor: MariaDB
  • Version: 10.3
  • Admin/Root Password: {specify a password}
  • Add Node: 192.168.0.41 (press Enter), 192.168.0.42 (press Enter), 192.168.0.43 (press Enter)

Make sure you got all the green ticks when adding nodes, indicating ClusterControl is able to connect to the node passwordlessly. Click "Deploy" to start the deployment.

Create the database, MariaDB user and password on one of the Galera nodes:

mysql> CREATE DATABASE camunda;
mysql> CREATE USER camunda@'%' IDENTIFIED BY 'passw0rd';
mysql> GRANT ALL PRIVILEGES ON camunda.* TO camunda@'%';

For ClusterControl user, you can use ClusterControl -> Manage -> Schema and Users instead:

Image may be NSFW.
Clik here to view.

Our database cluster deployment is now complete. Next, import the SQL files into the MariaDB cluster. On the application server, go to the "sql" directory and import them into one of the MariaDB nodes (we chose 192.168.0.41):

$ cd ~/camunda/sql/create
$ yum install mysql #install mariadb client
$ mysql -ucamunda -p -h192.168.0.41 camunda < mariadb_engine_7.10.0.sql
$ mysql -ucamunda -p -h192.168.0.41 camunda < mariadb_identity_7.10.0.sql

Camunda does not provide MariaDB connector for Java since its default database is H2. On the application server, download MariaDB Connector/J from MariaDB download page and copy the JAR file into Apache Tomcat bin directory:

$ wget https://downloads.mariadb.com/Connectors/java/connector-java-2.4.1/mariadb-java-client-2.4.1.jar
$ cp mariadb-java-client-2.4.1.jar ~/camunda/server/apache-tomcat-9.0.12/bin/

Then, set the CLASSPATH environment variable to include the database connector. Open setenv.sh via text editor:

$ vim ~/camunda/server/apache-tomcat-9.0.12/bin/setenv.sh

And add the following line:

export CLASSPATH=$CLASSPATH:$CATALINA_HOME/bin/mariadb-java-client-2.4.1.jar

Open ~/camunda/server/apache-tomcat-9.0.12/conf/server.xml and change the lines related to datastore. Use the sequential connection protocol and list out all the Galera nodes separated by comma in the connection string:

<Resource name="jdbc/ProcessEngine"
              ...
              driverClassName="org.mariadb.jdbc.Driver" 
              defaultTransactionIsolation="READ_COMMITTED"
              url="jdbc:mariadb:sequential://192.168.0.41:3306,192.168.0.42:3306,192.168.0.43:3306/camunda"
              username="camunda"  
              password="passw0rd"
              ...
/>

Finally, we can start the Camunda service by executing start-camunda.sh script:

$ cd ~/camunda
$ ./start-camunda.sh
starting camunda BPM platform on Tomcat Application Server
Using CATALINA_BASE:   ./server/apache-tomcat-9.0.12
Using CATALINA_HOME:   ./server/apache-tomcat-9.0.12
Using CATALINA_TMPDIR: ./server/apache-tomcat-9.0.12/temp
Using JRE_HOME:        /
Using CLASSPATH:       :./server/apache-tomcat-9.0.12/bin/mariadb-java-client-2.4.1.jar:./server/apache-tomcat-9.0.12/bin/bootstrap.jar:./server/apache-tomcat-9.0.12/bin/tomcat-juli.jar
Tomcat started.

Make sure the CLASSPATH shown in the output includes the path to the MariaDB Java client JAR file. After the initialization completes, you can then access Camunda webapps on port 8080 at http://192.168.0.8:8080/camunda/. The default username is demo with password 'demo':

Image may be NSFW.
Clik here to view.

You can see the digested capture queries from ClusterControl -> Query Monitor -> Top Queries, indicating the application is interacting correctly with the MariaDB Cluster:

Image may be NSFW.
Clik here to view.

With MariaDB Connector/J, we do not need load balancer tier which simplifies our overall architecture. The sequential connection mode should do the trick to avoid multi-writer deadlocks - which can happen in Galera. This setup provides high availability with each Camunda instance configured with JDBC to access the cluster of MySQL or MariaDB nodes. Galera takes care of synchronizing the data between the database instances in real time.

MongoDB Schema Planning Tips

Image may be NSFW.
Clik here to view.

One of the most advertised features of MongoDB is its ability to be “schemaless”. This means that MongoDB does not impose any schema on any documents stored inside a collection. Normally, MongoDB stores documents in a JSON format so each document can store various kinds of schema/structure. This is beneficial for the initial stages of development but in the later stages, you may want to enforce some schema validation while inserting new documents for better performance and scalability. In short, “Schemaless” doesn’t mean you don’t need to design your schema. In this article, I will discuss some general tips for planning your MongoDB schema.

Figuring out the best schema design which suits your application may become tedious sometimes. Here are some points which you can consider while designing your schema.

Avoid Growing Documents

If your schema allows creating documents which grow in size continuously then you should take steps to avoid this because it can lead to degradation of DB and disk IO performance. By default, MongoDB allows 16MB size per document. If your document size increases more than 16 MB over a period of time then, it is a sign of bad schema design. It can lead to failure of queries sometimes. You can use document buckets or document pre-allocation techniques to avoid this situation. In case, your application needs to store documents of size more than 16 MB then you can consider using MongoDB GridFS API.

Avoid Updating Whole Documents

If you try to update the whole document, MongoDB will rewrite the whole document elsewhere in the memory. This can drastically degrade the write performance of your database. Instead of updating the whole document, you can use field modifiers to update only specific fields in the documents. This will trigger an in-place update in memory, hence improved performance.

Try to Avoid Application-Level Joins

As we all know, MongoDB doesn’t support server level joins. Therefore, we have to get all the data from DB and then perform join at the application level. If you are retrieving data from multiple collections and joining a large amount of data, you have to call DB several times to get all the necessary data. This will obviously require more time as it involves the network. As a solution for this scenario, if your application heavily relies on joins then denormalizing schema makes more sense. You can use embedded documents to get all the required data in a single query call.

Use Proper Indexing

While doing searching or aggregations, one often sorts data. Even though you apply to sort in the last stage of a pipeline, you still need an index to cover the sort. If the index on sorting field is not available, MongoDB is forced to sort without an index. There is a memory limit of 32MB of the total size of all documents which are involved in the sort operation. If MongoDB hits that limit then it may either produce an error or return an empty set.

Having discussed adding indexes, it is also important not to add unnecessary indexes. Each index you add in the database, you have to update all these indexes while updating documents in the collection. This can degrade database performance. Also, each index will occupy some space and memory as well so, number of indexes can lead to storage-related problems.

One more way to optimize the use of an index is overriding the default _id field. The only purpose of this field is keeping one unique field per document. If your data contains a timestamp or any id field then you can override _id field and save one extra index.

Severalnines
 
Become a MongoDB DBA - Bringing MongoDB to Production
Learn about what you need to know to deploy, monitor, manage and scale MongoDB

Read v/s Write Ratio

Designing schema for any application hugely depends on whether an application is read heavy or write heavy. For example, if you are building a dashboard to display time series data then you should design your schema in such a way that maximizes the write throughput. If your application is E-commerce based then, most of the operations will be read operations as most users will be going through all the products and browsing various catalogs. In such cases, you should use denormalized schema to reduce the number of calls to DB for getting relevant data.

BSON Data Types

Make sure that you define BSON data types for all fields properly while designing schema. Because when you change the data type of any field, MongoDB will rewrite the whole document in a new memory space. For example, if you try to store (int)0 in place of (float)0.0 field, MongoDB rewrites the whole document at a new address due to change in BSON data type.

Conclusion

In a nutshell, it is wise to design schema for your Mongo Database as it will only improve the performance of your application. Starting from version 3.2, MongoDB started supporting document validation where you can define which fields are required to insert a new document. From version 3.6, MongoDB introduced a more elegant way of enforcing schema validation using JSON Schema Validation. Using this validation method, you can enforce data type checking along with required field checking. You can use the above approaches to check whether all documents are using the same type of schema or not.

High-Performance Telecommunication Projects Driven by ClusterControl

Image may be NSFW.
Clik here to view.

In this blog we wanted to highlight three telecommunications providers who have used ClusterControl to power their database management.

As technology gets smaller, easier and more powerful, existing Telecommunications providers must continue to innovate to stay relevant while newcomers to the block must come out strong and stable to earn a spot in the crowded marketplace.

When it comes to databases, however, telecommunications challenges are BIG. Large amount of data both pass through and are created by their systems & applications. As the growth of data continues to skyrocket, having systems in place to handle that growth (and ensure performance) is even more important than before.

In the sections below we highlight three ClusterControl Telecom users, what challenges they faced in building highly-available, dependable and secure database environments. Two of these companies leveraged ClusterControl to fix issues and one from the start. If you want to learn more, you can read their individual case studies which go into greater detail.

CAN’L

Image may be NSFW.
Clik here to view.

Running lean-and-mean is a requirement in the Telecommunications industry if you want to show a good profit in spite of being in a commodity industry.

Can’l, an internet service provider located in New Caledonia, struggled with managing their databases. Their single DBA was overworked but the requirements on the database were still increasing. The decision needed to be made… hire more people or find a more efficient way.

In the end the Can’l team began leveraging ClusterControl to allow them to re-build their MySQL NDB Cluster database setup. So how have things been going since they implemented? Just ask CTO Cocconi Alain who said “We will renew as long as possible with Severalnines: great experience with three years without issues in production. It gives us the assurance of security and quality.”

You can read more about Can’l here.

Net-SOL

Image may be NSFW.
Clik here to view.

If you live in Austria and are in need of an advanced VOIP phone system then Net-Sol is the company to call.

Behind the curtains, however, the company was experiencing database performance issues caused by frequent node outages requiring failover; each time resulting in slow downs. They were barely able to keep everything running smoothly and needed a better way to monitor and manage the performance of their MySQL Galera Cluster database clusters.

The Net-Sol team turned to ClusterControl and, remarkably, in two days had their existing infrastructure imported, reconfigured, and a load balancer added (HAProxy). From there it was as simple as setting up monitoring, system alerts, and enabling ClusterControl’s auto-repair and recovery features.

You can read more about Net-Sol here.

ClusterControl
Single Console for Your Entire Database Infrastructure
Find out what else is new in ClusterControl

Sielte

Image may be NSFW.
Clik here to view.

Innovation in the telecommunications space is no more apparent than when talking about digital identity systems. These systems allow for an individual to take their government sponsored digital identification securely throughout the web.

Sielte, a premier telecommunications provider in Italy, has been developing SielteID in conjunction with SPID, Italy’s digital identity. public system.

Unlike the other two companies listed above, Sielte started off trying to find a way to achieve high-availability and performance. After evaluating several vendors and some free open-source tools then decided to use ClusterControl to build their database infrastructure.

Sielte quickly deployed a MySQL-based database cluster with automatic failover & recovery to ensure their application met uptime SLAs for their demanding clientele.

You can read more about Sielte & SielteID here.

Conclusion

If you have a Telecommunications application that needs highly-available, high-performance databases that can automatically recover when disaster strikes, then why not give ClusterControl a try?

Master High Availability Manager (MHA) Has Crashed! What Do I Do Now?

Image may be NSFW.
Clik here to view.

MySQL Replication is very popular way of building highly available database layers. It is very well known, tested and robust. It is not without limitations, though. One of them, definitely, is the fact that it utilizes only one “entry point” - you have a dedicated server in the topology, the master, and it is the only node in the cluster to which you can issue writes. This leads to severe consequences - the master is the single point of failure and, should it fail, no write can be executed by the application. It is not a surprise that much work has been put in developing tools, which would reduce the impact of a master loss. Sure, there are discussions how to approach the topic, is the automated failover better than the manual one or not. Eventually, this is a business decision to take but should you decide to follow the automation path, you will be looking for the tools to help you achieve that. One of the tools, which is still very popular, is MHA (Master High Availability). While maybe it is not actively maintained anymore, it is still in a stable shape and its huge popularity still makes it backbone of the high available MySQL replication setups. What would happen, though, if the MHA itself became unavailable? Can it become a single point of failure? Is there a way to prevent it from happening? In this blog post we will take a look at some of the scenarios.

First things first, if you plan to use MHA, make sure you use the latest version from the repo. Do not use binary releases as they do not contain all the fixes. The installation is fairly simple. MHA consists of two parts, manager and node. Node is to be deployed on your database servers. Manager will be deployed on a separate host, along with node. So, database servers: node, management host: manager and node.

It is quite easy to compile MHA. Go to the GitHub and clone repositories.

https://github.com/yoshinorim/mha4mysql-manager

https://github.com/yoshinorim/mha4mysql-node

Then it’s all about:

perl Makefile.PL
make
make install

You may have to install some perl dependences if you don’t have all of the required packages already installed. In our case, on Ubuntu 16.04, we had to install following:

perl -MCPAN -e "install Config::Tiny"
perl -MCPAN -e "install Log::Dispatch"
perl -MCPAN -e "install Parallel::ForkManager"
perl -MCPAN -e "install Module::Install"

Once you have MHA installed, you need to configure it. We will not go into any details here, there are many resources on the internet which cover this part. A sample config (definitely non-production one) may look like this:

root@mha-manager:~# cat /etc/app1.cnf
[server default]
user=cmon
password=pass
ssh_user=root
# working directory on the manager
manager_workdir=/var/log/masterha/app1
# working directory on MySQL servers
remote_workdir=/var/log/masterha/app1
[server1]
hostname=node1
candidate_master=1
[server2]
hostname=node2
candidate_master=1
[server3]
hostname=node3
no_master=1

Next step will be to see if everything works and how MHA sees the replication:

root@mha-manager:~# masterha_check_repl --conf=/etc/app1.cnf
Tue Apr  9 08:17:04 2019 - [warning] Global configuration file /etc/masterha_default.cnf not found. Skipping.
Tue Apr  9 08:17:04 2019 - [info] Reading application default configuration from /etc/app1.cnf..
Tue Apr  9 08:17:04 2019 - [info] Reading server configuration from /etc/app1.cnf..
Tue Apr  9 08:17:04 2019 - [info] MHA::MasterMonitor version 0.58.
Tue Apr  9 08:17:05 2019 - [error][/usr/local/share/perl/5.22.1/MHA/MasterMonitor.pm, ln427] Error happened on checking configurations. Redundant argument in sprintf at /usr/local/share/perl/5.22.1/MHA/NodeUtil.pm line 195.
Tue Apr  9 08:17:05 2019 - [error][/usr/local/share/perl/5.22.1/MHA/MasterMonitor.pm, ln525] Error happened on monitoring servers.
Tue Apr  9 08:17:05 2019 - [info] Got exit code 1 (Not master dead).

Well, it crashed. This is because MHA attempts to parse MySQL version and it does not expect hyphens in it. Luckily, the fix is easy to find: https://github.com/yoshinorim/mha4mysql-manager/issues/116.

Now, we have MHA ready for work.

root@mha-manager:~# masterha_manager --conf=/etc/app1.cnf
Tue Apr  9 13:00:00 2019 - [warning] Global configuration file /etc/masterha_default.cnf not found. Skipping.
Tue Apr  9 13:00:00 2019 - [info] Reading application default configuration from /etc/app1.cnf..
Tue Apr  9 13:00:00 2019 - [info] Reading server configuration from /etc/app1.cnf..
Tue Apr  9 13:00:00 2019 - [info] MHA::MasterMonitor version 0.58.
Tue Apr  9 13:00:01 2019 - [info] GTID failover mode = 1
Tue Apr  9 13:00:01 2019 - [info] Dead Servers:
Tue Apr  9 13:00:01 2019 - [info] Alive Servers:
Tue Apr  9 13:00:01 2019 - [info]   node1(10.0.0.141:3306)
Tue Apr  9 13:00:01 2019 - [info]   node2(10.0.0.142:3306)
Tue Apr  9 13:00:01 2019 - [info]   node3(10.0.0.143:3306)
Tue Apr  9 13:00:01 2019 - [info] Alive Slaves:
Tue Apr  9 13:00:01 2019 - [info]   node2(10.0.0.142:3306)  Version=5.7.25-28-log (oldest major version between slaves) log-bin:enabled
Tue Apr  9 13:00:01 2019 - [info]     GTID ON
Tue Apr  9 13:00:01 2019 - [info]     Replicating from 10.0.0.141(10.0.0.141:3306)
Tue Apr  9 13:00:01 2019 - [info]     Primary candidate for the new Master (candidate_master is set)
Tue Apr  9 13:00:01 2019 - [info]   node3(10.0.0.143:3306)  Version=5.7.25-28-log (oldest major version between slaves) log-bin:enabled
Tue Apr  9 13:00:01 2019 - [info]     GTID ON
Tue Apr  9 13:00:01 2019 - [info]     Replicating from 10.0.0.141(10.0.0.141:3306)
Tue Apr  9 13:00:01 2019 - [info]     Not candidate for the new Master (no_master is set)
Tue Apr  9 13:00:01 2019 - [info] Current Alive Master: node1(10.0.0.141:3306)
Tue Apr  9 13:00:01 2019 - [info] Checking slave configurations..
Tue Apr  9 13:00:01 2019 - [info] Checking replication filtering settings..
Tue Apr  9 13:00:01 2019 - [info]  binlog_do_db= , binlog_ignore_db=
Tue Apr  9 13:00:01 2019 - [info]  Replication filtering check ok.
Tue Apr  9 13:00:01 2019 - [info] GTID (with auto-pos) is supported. Skipping all SSH and Node package checking.
Tue Apr  9 13:00:01 2019 - [info] Checking SSH publickey authentication settings on the current master..
Tue Apr  9 13:00:02 2019 - [info] HealthCheck: SSH to node1 is reachable.
Tue Apr  9 13:00:02 2019 - [info]
node1(10.0.0.141:3306) (current master)
 +--node2(10.0.0.142:3306)
 +--node3(10.0.0.143:3306)

Tue Apr  9 13:00:02 2019 - [warning] master_ip_failover_script is not defined.
Tue Apr  9 13:00:02 2019 - [warning] shutdown_script is not defined.
Tue Apr  9 13:00:02 2019 - [info] Set master ping interval 3 seconds.
Tue Apr  9 13:00:02 2019 - [warning] secondary_check_script is not defined. It is highly recommended setting it to check master reachability from two or more routes.
Tue Apr  9 13:00:02 2019 - [info] Starting ping health check on node1(10.0.0.141:3306)..
Tue Apr  9 13:00:02 2019 - [info] Ping(SELECT) succeeded, waiting until MySQL doesn't respond..

As you can see, MHA is monitoring our replication topology, checking if the master node is available or not. Let’s consider a couple of scenarios.

Scenario 1 - MHA Crashed

Let’s assume MHA is not available. How does this affect the environment? Obviously, as MHA is responsible for monitoring the master’s health and trigger failover, this will not happen when MHA is down. Master crash will not be detected, failover will not happen. The problem is, you cannot really run multiple MHA instances at the same time. Technically, you can do it although MHA will complain about lock file:

root@mha-manager:~# masterha_manager --conf=/etc/app1.cnf
Tue Apr  9 13:05:38 2019 - [warning] Global configuration file /etc/masterha_default.cnf not found. Skipping.
Tue Apr  9 13:05:38 2019 - [info] Reading application default configuration from /etc/app1.cnf..
Tue Apr  9 13:05:38 2019 - [info] Reading server configuration from /etc/app1.cnf..
Tue Apr  9 13:05:38 2019 - [info] MHA::MasterMonitor version 0.58.
Tue Apr  9 13:05:38 2019 - [warning] /var/log/masterha/app1/app1.master_status.health already exists. You might have killed manager with SIGKILL(-9), may run two or more monitoring process for the same application, or use the same working directory. Check for details, and consider setting --workdir separately.

It will start, though, and it will attempt to monitor the environment. The problem is when both of them starts to execute actions on the cluster. Worse case would be if they decide to use different slaves as the master candidate and failover will be executed at the same time (MHA uses a lock file which prevents subsequent failovers from happening but if everything happens at the same time, and it happened in our tests, this security measure is not enough).

Unfortunately, there is no built-in way of running MHA in a highly available manner. The most simple solution will be to write a script which would test if MHA is running and if not, start it. Such script would have to be executed from cron or written in the form of a daemon, if 1 minute granularity of cron is not enough.

ClusterControl
Single Console for Your Entire Database Infrastructure
Find out what else is new in ClusterControl

Scenario 2 - MHA Manager Node Lost Network Connection to the Master

Let’s be honest, this is a really bad situation. As soon as MHA cannot connect to the master, it will attempt to perform a failover. The only exception is if secondary_check_script is defined and it verified that the master is alive. It is up to the user to define exactly what actions MHA should perform to verify master’s status - it all depends on the environment and exact setup. Another very important script to define is master_ip_failover_script - this is executed upon failover and it should be used, among others, to ensure that the old master will not show up. If you happen to have access to additional ways of reaching and stopping old master, that’s really great. It can be remote management tools like Integrated Lights-out, it can be access to manageable power sockets (where you can just power off the server), it can be access to cloud provider’s CLI, which will make it possible to stop the virtual instance. It is of utmost importance to stop the old master - otherwise it may happen that, after the network issue is gone, you will end up with two writeable nodes in the system, which is a perfect solution for the split brain, a condition in which data diverged between two parts of the same cluster.

As you can see, MHA can handle the MySQL failover pretty well. It definitely requires careful configuration and you will have to write external scripts, which will be utilized to kill the old master and ensure that the split brain will not happen. Having said that, we would still recommend to use more advanced failover management tools like Orchestrator or ClusterControl, which can perform more advanced analysis of the replication topology state (for example, by utilizing slaves or proxies to assess the master’s availability) and which are and will be maintained in the future. If you are interested to learn how ClusterControl performs failover, we would like to invite you to read this blog post on the failover process in ClusterControl. You can also learn how ClusterControl interacts with ProxySQL delivering smooth, transparent failover for your application. You can always test ClusterControl by downloading it for free.

Viewing all 1256 articles
Browse latest View live