Quantcast
Channel: Severalnines
Viewing all 1258 articles
Browse latest View live

Open Source Database Adoption - Taking a Look at Percona’s Survey Results

$
0
0

Are you still struggling to pick the best open source database software for your organisation? You would have penned down a must-have feature list right from deploying, managing, and monitoring a database but finding the best fit?... still not there. 

There are many software vendors out there trying their best to offer a variety of combinations of features to manage the open-source databases, so it would be wise to get an insight on the current happenings around this space before making any decision. 

Recently Percona conducted a survey on 750 respondents from small, medium, and large companies to try to understand how they have managed their open source database environments. The survey results have led to interesting findings to understand the trends in open source database adoption by the open source community. 

This blog walks you through important points on open source database features, leading technologies, adoption factors, and concerns evaluated by those organisations. 

Multiple Open Source Environments

Many companies now have multiple databases on multiple platforms across different locations, to keep up with the rapid needs and changes in their business. The need for multiple database instances often increases as the data volume increases. On average, over half of the open source community uses at least 25 instances for this purpose. 

73% of relational database users, shows that the relational database is still the market preference over the multiple-model databases like time-Series, graph, wide column, and other niche database technologies. 

With many different databases, companies are now overwhelmed with choices, allowing them to have a combination of database types to support the various applications they have in their environment. The combination usually depends on the interaction and data support between the database and the applications. To maintain these multi environments, companies should be prepared to invest in either a multi-skilled DBA or have a good open source database management system (like ClusterControl) to deploy, manage, and monitor the various databases in their environment.

The Leading Open Source Databases

The survey on open source databases  also highlighted the top databases installed in 2019, and the five leading databases are as below

Postgres-XL, Clustrix, Alibaba Cloud: ApsaraDB RDS for PostgreSQL, FoundationDB Document Layer and Azure Cosmos DB are at the bottom 5 with less than 1% installation for the year.

MySQL - Variants and Combinations

The MySQL Community Edition secured the title for most deployed database for the year of 2019. The top five most popular MySQL-compatible softwares after the community version are...

  • MariaDB Community
  • Percona Server for MySQL
  • MySQL on Amazon RDS
  • Percona XtraDB Cluster
  • Amazon Aurora

MySQL combinations with other databases differ based on the editions. PostgreSQL, Elastic, Redis and MongoDB commonly used with the MySQL Community version. On the other hand, with the Enterprise Version, proprietary databases, SQL Server and Oracle are used as the best combination. 

64% of the community also selected PostgreSQL as a popular database to use alongside the enterprise edition. These results show clearly that the community version is not usually paired with a proprietary database. It is assumed that there could be two main reasons for this decision; lack of skills to manage multiple open source databases and/or the fact that management has concerns over the support of stability of the open source products.

PostgreSQL - Variants and Combinations

PostgreSQL has gained a lot of attention in the last few years and has the most installation after the MySQL database. Its strength lies in the large community base which contributes to its upgrades and expansions. Although there are many compatible versions, only the standard version is preferred one. PostgreSQL is coupled most with Elastic, MongoDB, SQL, and Redis. The enterprise version, like MySQL Enterprise, is commonly paired with the enterprise databases like Oracle and SQL Server.

MongoDB - Variants and Combinations

MongoDB gained its popularity along with big data and its ability to overcome the limitation of a rigid relational database with NoSQL. NoSQL paved the way for agile development and supports flexibility and scalability. Like the other two, MongoDB Community is still the most widely used version by small and medium companies, and the enterprise version is only used by large organisations. 

Open Source Database Adoption

Open-source databases gained popularity because of cost-saving and to avoid vendor lock-in situations. Another bit of good news is that these databases work for any business size, hence it is widely used by small, medium, and large companies alike. 

Open source tools give a platform for experimentation, which allows the users to use a community edition, and get comfortable with it, before moving on to further deployments. On average 53% of companies are moving into the open-source software adoption. 

Open Source Community Contributions

Enhancement in the open source world really depends on the contributions from its user community. This is why open source software with a large community (like PostgreSQL) is always adopted widely by small, medium, and large companies.  Although companies are geared up for open source adoption, and do know the need to contribute, many of the users have said they don't have the time to contribute back to the libraries. 

Support Services

The next main concern on the adoption of open source is around support preferences. Generally, small scale companies management and technical staff prefer a self-support option. 

Support services are also a limiting factor. Companies are often worried about the support mechanism, especially during times of crisis. They lack confidence in their own support team or it could be the internal team just has too many other tasks, making it impossible to give adequate support. 

Small companies usually rely on self-support to minimize cost. To increase confidence in the open source solution, some companies appoint external vendors for support services. Another option which can be considered is to opt for an open source database management system which includes support services as well.

Enterprise or Subscribed Database Preferences

There is still a large percentage of companies using proprietary databases for three major reasons; the strong 24x7 dedicated support line, brand trust, and the enhanced security.  Trust is tagged with a long established brand which gives peace of mind to the users. Despite these factors, community open source still wins with one major factor which is cost saving. 

Open Source Database Adoption Concerns

The survey showed there are three main adoption concerns (besides vendor lock-in). 

The first concern is the lack of support which has been discussed in the earlier sections of this blog. Next is the concern around the lack of fixes and bugs from the small and medium companies. The worry could be on the cost incurred to fix any bugs. 

Large companies are not worried about this, because they can afford the cost to hire someone to fix any bugs and even further enhance the system. 

Security is the third reason, and this concern is mainly from the technical team because they are responsible for the security compliance of its systems in the organisation. 

Conclusion

Adopting an open source database is the way-to-go for any size business and is the best fit if cost and avoiding vendor lock-in is a concern. You also need to be aware of, and check on, the support mechanism, patch support, and security aspects before making a choice. 

Along with the open source technology adoption, you would need a proper technical team to manage the database and have a proper support mechanism to handle any limitations. 

Open source technologies allow you to experiment with the available free or community versions and then decide to go ahead with the licensed or enterprise version if required. 

The great thing is that with open source technologies, you won't have to settle for one database anymore, as you have more than one to serve the different aspects of your business.
A Comparison Between the MySQL Clone Plugin and Xtrabackup

$
0
0

In one of our previous blogs we explained how Clone Plugin, one of new features that showed in MySQL 8.0.17, can be used to rebuild a replication slave. Currently the go-to tool for that, as well as for backups, is Xtrabackup. We thought it is interesting to compare how those tools work and behave.

Comparing Performance

The first thing we decided to test is how both perform when it comes to storing the copy of the data locally. We used AWS and m5d.metal instance with two NVMe SSD and we ran the clone to local copy:

mysql> CLONE LOCAL DATA DIRECTORY='/mnt/clone/';

Query OK, 0 rows affected (2 min 39.77 sec)

Then we tested Xtrabackup and made the local copy:

rm -rf /mnt/backup/ ; time xtrabackup --backup --target-dir=/mnt/backup/ --innodb-file-io-threads=8 --innodb-read-io-threads=8  --innodb-write-io-threads=8 --innodb-io-capacity=20000 --parallel=16

200120 13:12:28 completed OK!

real 2m38.407s

user 0m45.181s

sys 4m18.642s

As you can see, the time required to copy the data was basically the same. In both cases the limitation was the hardware, not the software.

Transferring data to another server will be the most common use case for both tools. It can be a slave you want to provision or rebuild. In the future it may be a backup, Clone Plugin doesn’t have such functionality as of now but we are pretty sure in the future someone will make it possible to use it as a backup tool. Given that hardware is the limitation for local backup in both cases, hardware will also be a limitation for transferring the data across the network. Depending on your setup, it could be either the network, disk I/O or CPU.

In a I/O-intensive operations CPU is the least common bottleneck. This makes it quite common to trade some CPU utilization for reduction in the data set size. You can accomplish that through compression. If it is done on the fly, you still have to read the same amount of data but you send less of it (as it is compressed) over the network. Then, you will have to decompress it and write it down. It is also possible that the files themselves are compressed. In that case you reduce the amount of data read, transferred and written to disk.

Clone Plugin doesn’t come with any sort of on-the-fly compression available. It can clone compressed InnoDB tables but this doesn’t help much when compared to Xtrabackup as Xtrabackup will as well copy the reduced data set. On the other hand, Xtrabackup can be used along with the compression done on the fly, so it will come up faster if the network will be the limiting factor. Other than that we would expect to see similar results in both cases.

Comparing Usability

Performance is just one thing to compare, there are many others like how easy tools are to use. In both cases there are several steps you have to perform. For Clone Plugin it is:

  1. Install the plugin on all nodes
  2. Create users on both donor and receiver nodes
  3. Set up the donor list on the receiver

Those three steps have to be performed once. When they are set, you can use Clone Plugin to copy the data. Based on the init system you may need to start MySQL node after the clone process has completed. This is not required if, like in the case of systemd, MySQL will be automatically restarted.

Xtrabackup requires a couple more steps to get things done.

  1. Install the software on all nodes
  2. Create user on the donor

Those two steps have to be executed once. For every backup you have to execute following steps:

  1. Configure network streaming. Simple and secure way would be to use SSH, something like:
xtrabackup --backup --innodb-file-io-threads=8 --innodb-read-io-threads=8  --innodb-write-io-threads=8 --innodb-io-capacity=20000 --parallel=8 --stream=xbstream --target-dir=/mnt/backup/ | ssh root@172.32.4.70 "xbstream -x -C /mnt/backup/"

We found, though, for faster harddrives, with single-threaded SSH, CPU becomes a bottleneck. Setting up netcat requires additional step on the receiver to ensure netcat is up, listening and redirecting the traffic to the proper software (xbstream).

  1. Stop MySQL on the receiver node

  2. Run the Xtrabackup

  3. Apply InnoDB logs

  4. Copy back the data

  5. Start MySQL on the receiver node

As you can see, Xtrabackup requires more steps to be taken.

Security Considerations

Clone Plugin can be configured to use SSL for data transfer even though by default it uses plain text. Cloning of the encrypted tablespaces is possible but there is no option to encrypt, for example, the local clone. User would have to do it separately, after the clone process is completed.

Xtrabackup itself doesn’t provide any security. Security is determined by how you stream the data. If you use SSH for streaming, data in transit will be encrypted. If you decide to use netcat, it will be sent as a plain text. Of course, if the data is encrypted in tablespaces, it is already secured, just like in the case of the Clone Plugin. Xtrabackup can also be used along with on-the-fly encryption to ensure your data is encrypted also at rest.

Plugin Features

Clone Plugin is a new product, still in an infant phase. Its primary task is to provide ways of provisioning nodes in InnoDB Cluster and it does that just fine. For other tasks, like backups or provisioning of replication slaves, it can be used to some extent but it suffers from several limitations. We covered some of them in our previous blog so we won’t repeat it here but the most serious one, when talking about provisioning and backups, is that only InnoDB tables are cloned. If you happen to use any other storage engine, you cannot really use Clone Plugin. On the other hand Xtrabackup will happily backup and transfer most commonly used storage engines: InnoDB, MyISAM (unfortunately, it’s still used in many places) and CSV. Xtrabackup comes also with a set of tools that are intended to help with streaming the data from node to node or even stream backup to S3 buckets.

To sum it up, when it comes to backing up data and provisioning replication slaves, xtrabackup is and most likely will still be the most popular pick. On the other hand, Clone Plugin, most likely, will improve and evolve. We will see what the future holds and how things will look like in a year’s time.

Let us know if you have any thoughts on the Clone Plugin, we are very interested to see what is your opinion on this new tool.


Understanding the ProxySQL Audit Log

$
0
0

ProxySQL became a very important bit of infrastructure in the database environments. It works as a load balancer, it helps to shape the flow of the traffic and reduce the downtime. With great power comes great responsibility. How can you stay up to date on who is accessing the ProxySQL configuration? Who is connecting to the database through ProxySQL? Those questions can be answered using ProxySQL Audit Log, which is available starting from ProxySQL 2.0.5. In this blog post we will look into how to enable this feature and how the log contents look like.

The initial steps will be to deploy ProxySQL. We can easily do that using ClusterControl - both MySQL Replication and Galera Cluster types support ProxySQL deployment.

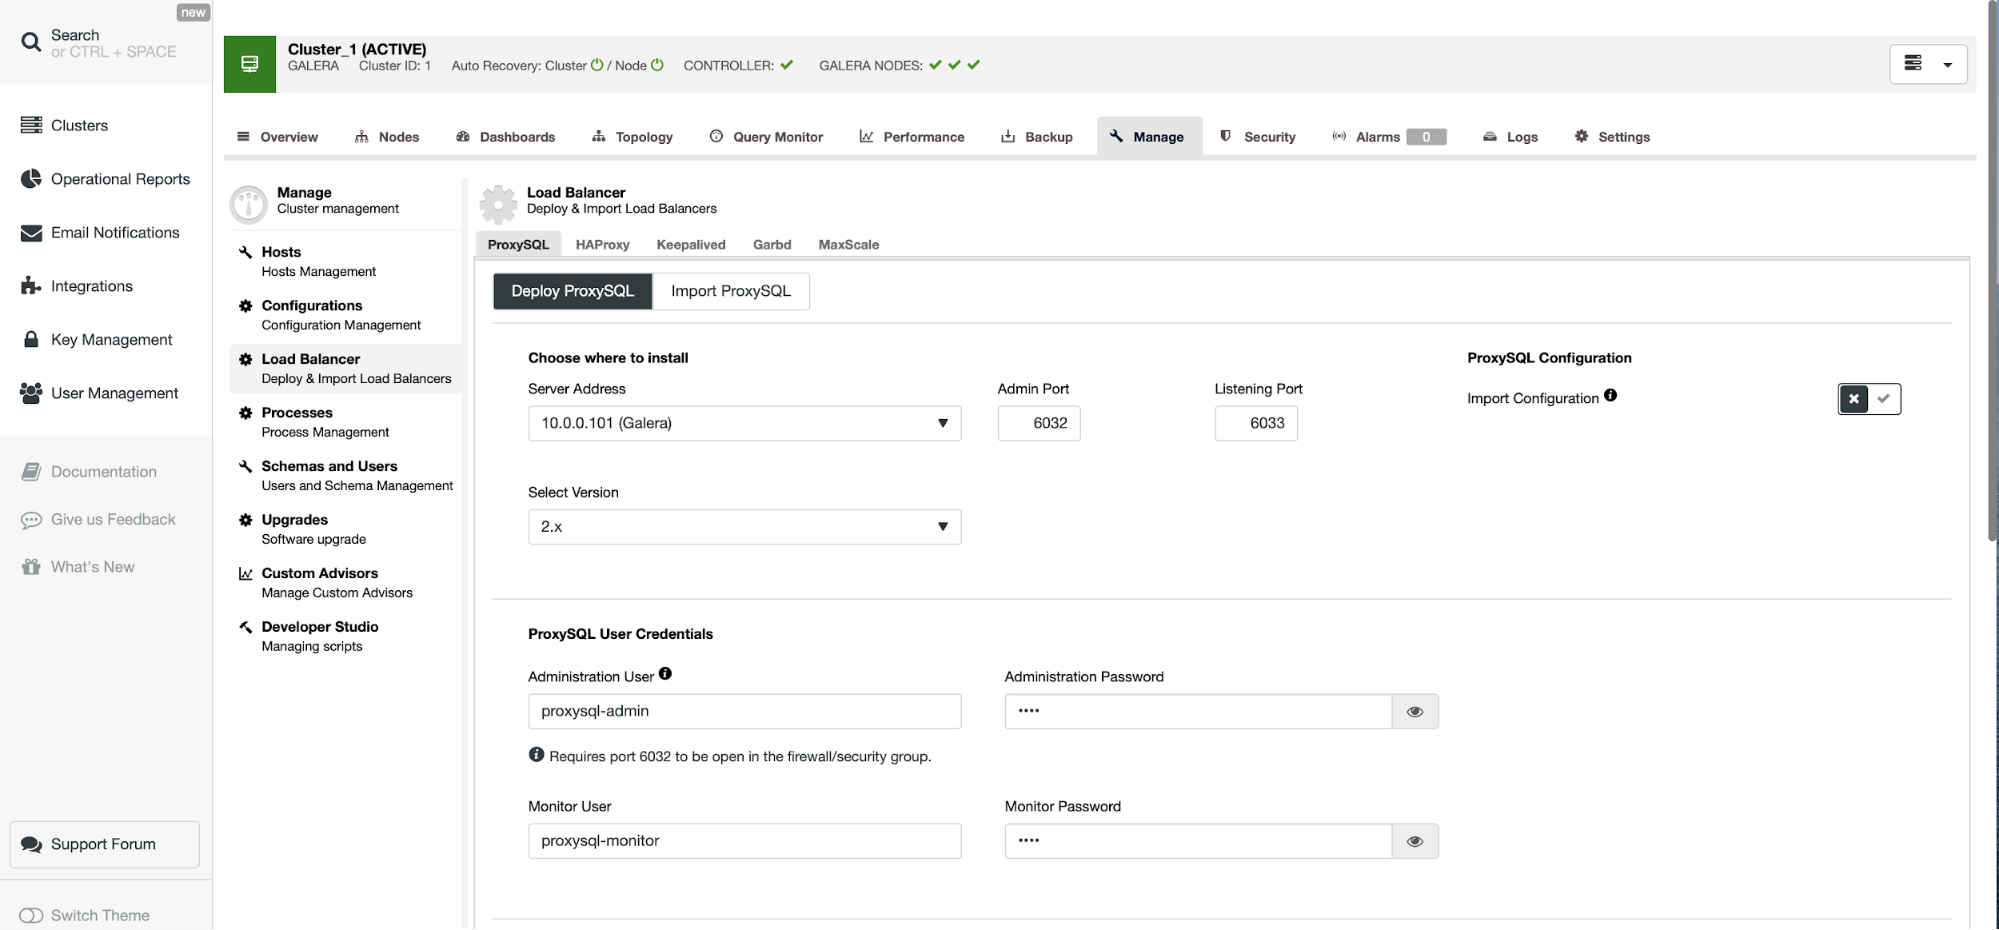
Assuming we have a cluster up and running, we can deploy ProxySQL from Manage -> LoadBalancers:

We have to decide on which node ProxySQL should be installed, its version (we’ll keep the default 2.x) and define credentials for ProxySQL administrative and monitoring users.

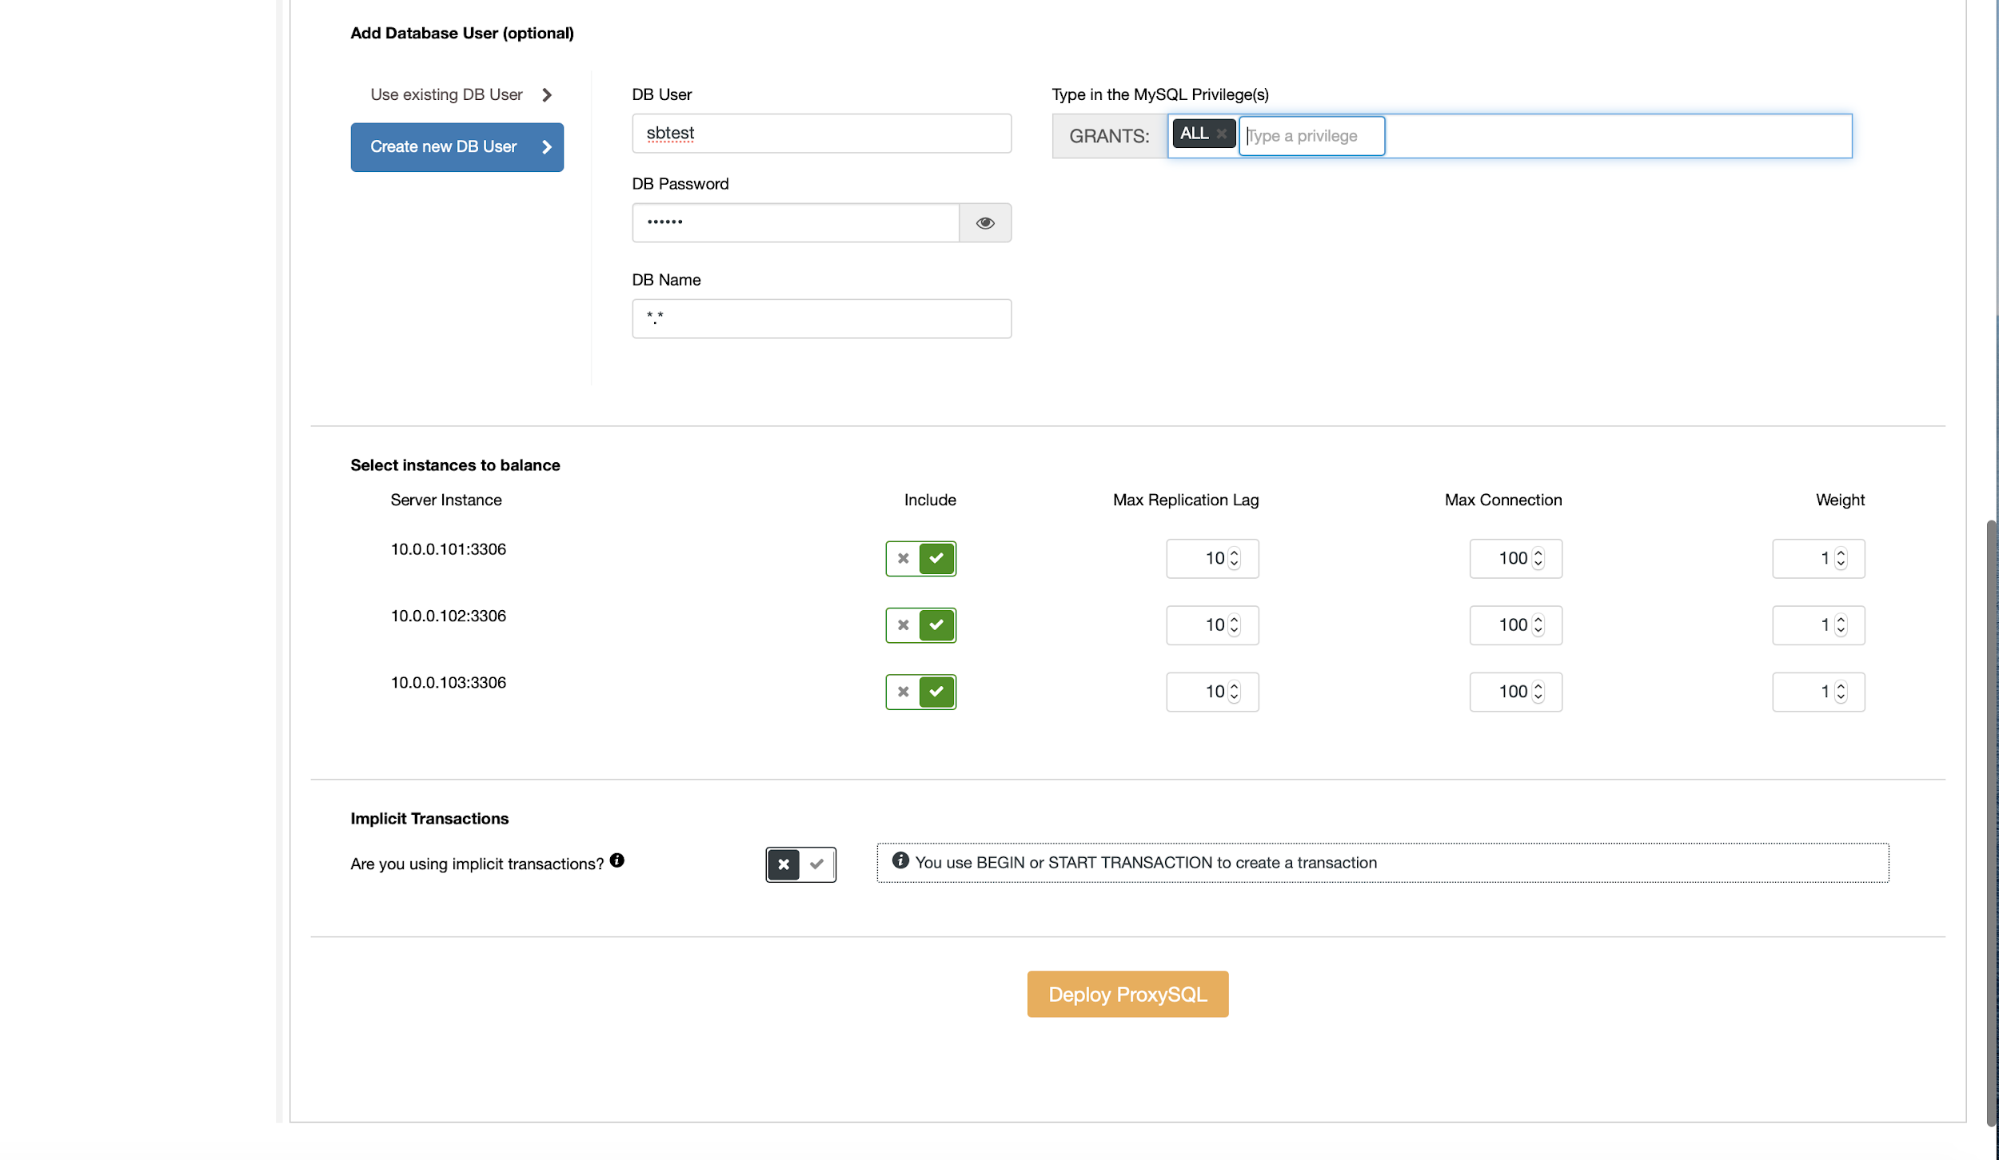
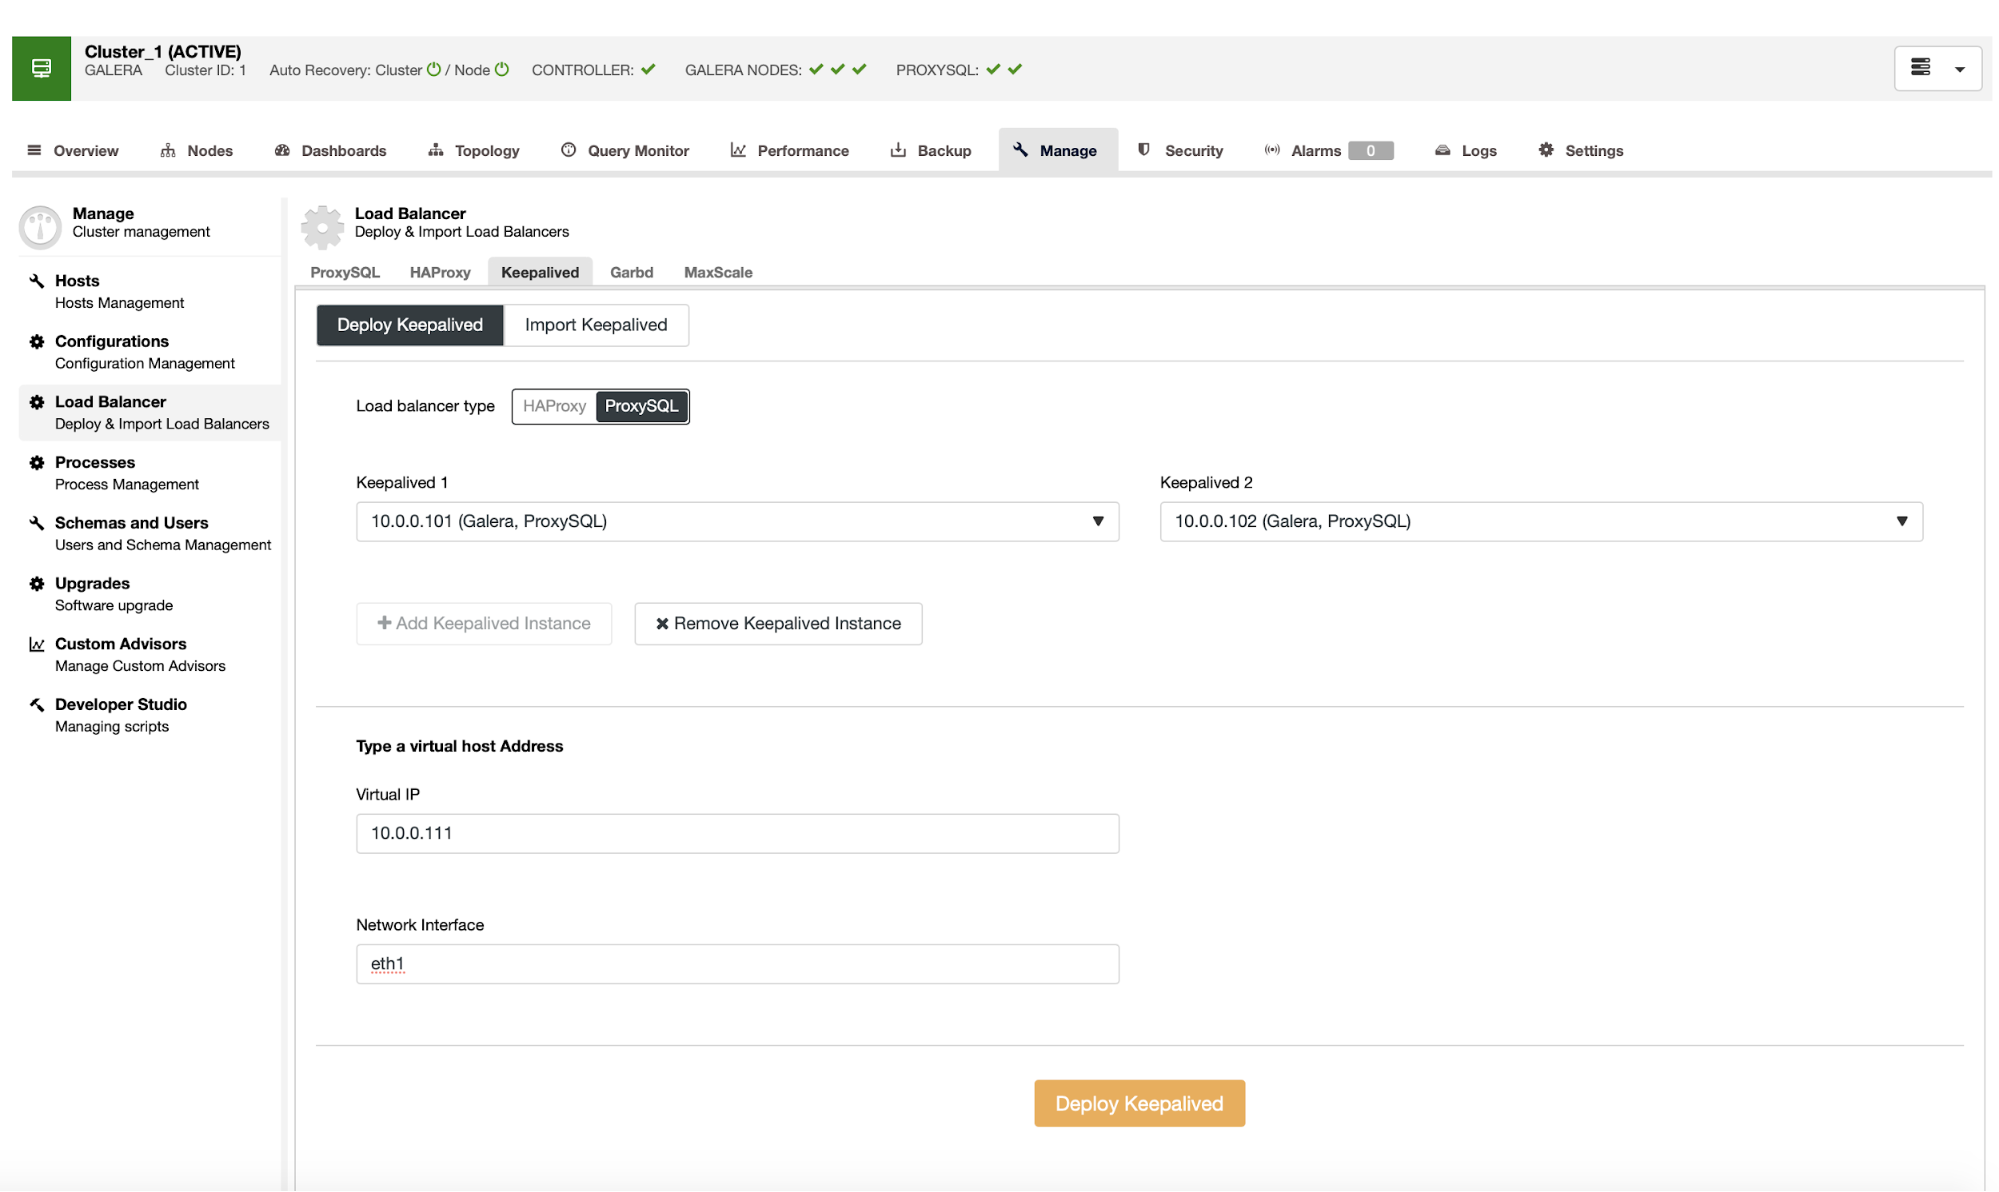
Below we can either import existing application users from the database or create a new one by assigning name, password, schema and MySQL privileges. We can then configure which nodes should be included in ProxySQL and decide if we use implicit transactions or not. Once everything is done, we can deploy ProxySQL. For high availability you probably want to add a second ProxySQL and then keepalived on top of them. Keepalived can also be easily deployed from ClusterControl:

Here we have to pick nodes on which ProxySQL is deployed, pass the Virtual IP and network interface VIP should be assigned to. Once this is done, ClusterControl can deploy Keepalived for you.

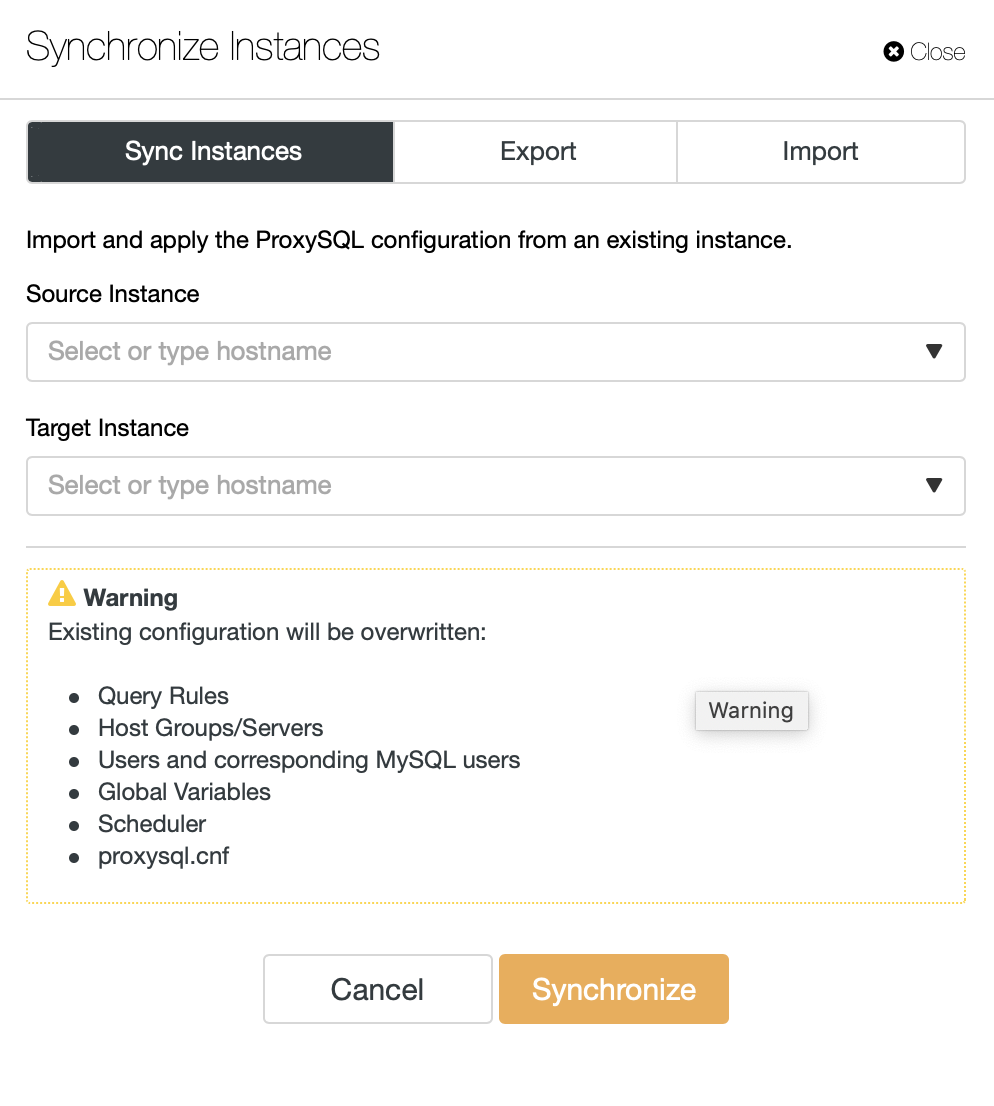
Now, let’s take a look at the audit log. All configurations should be performed on both ProxySQL nodes. Alternatively you can use an option to sync the nodes:

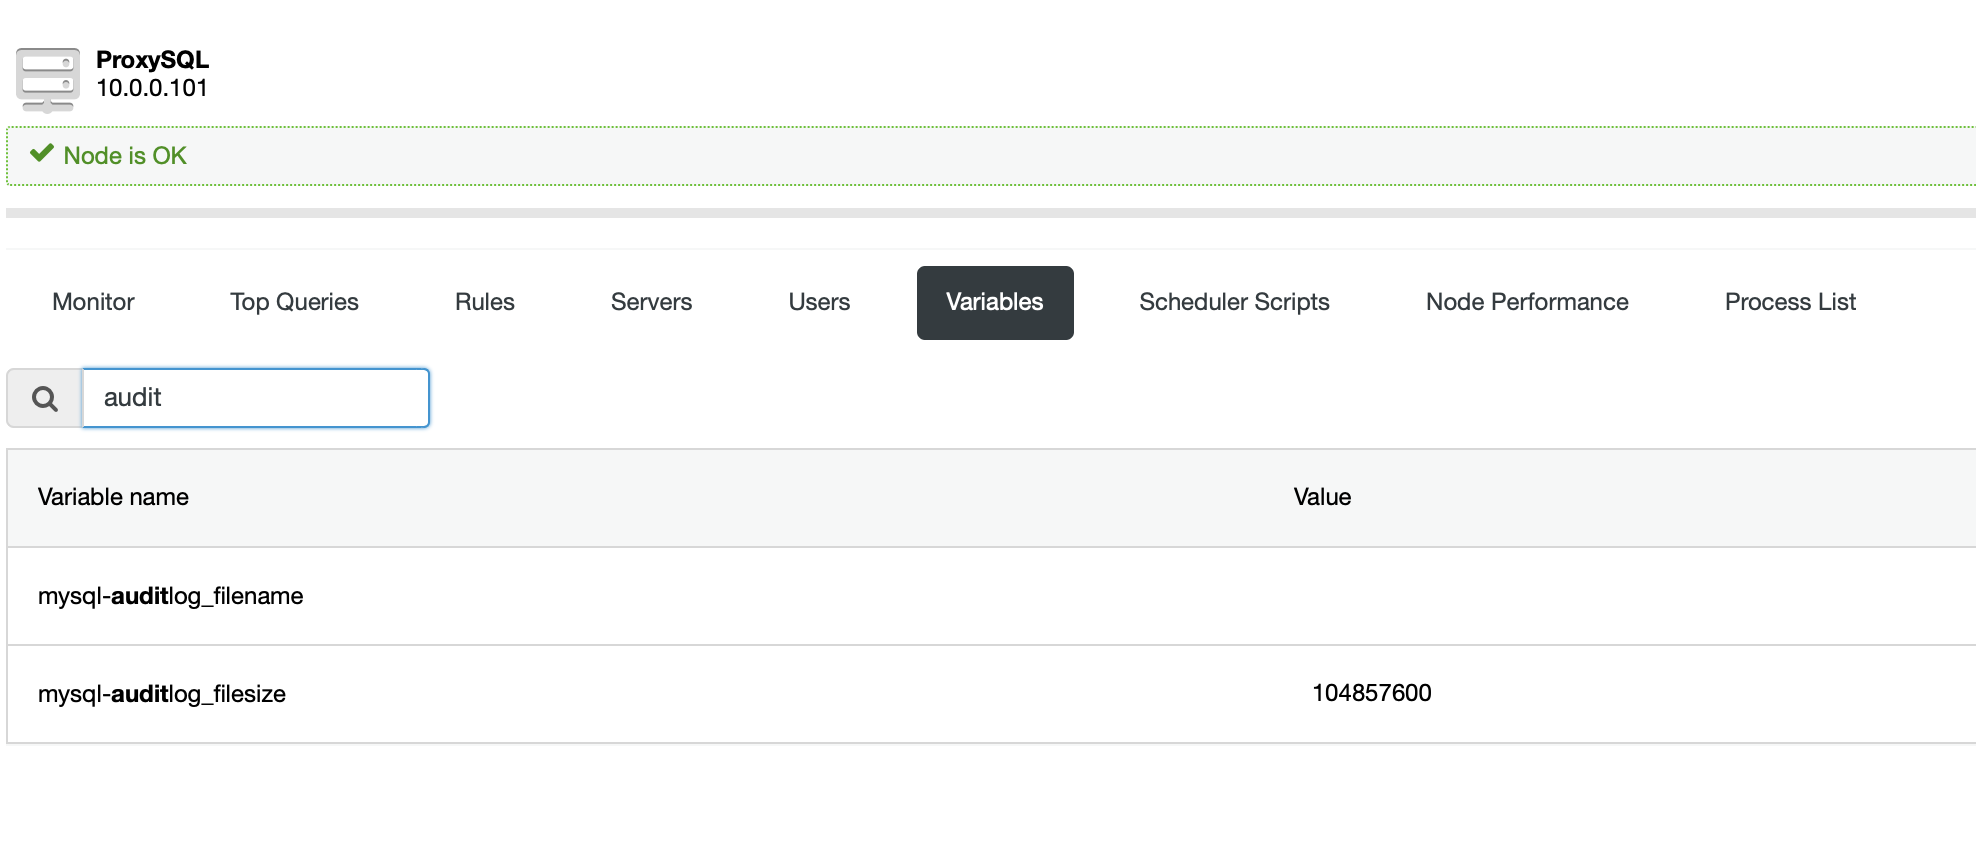
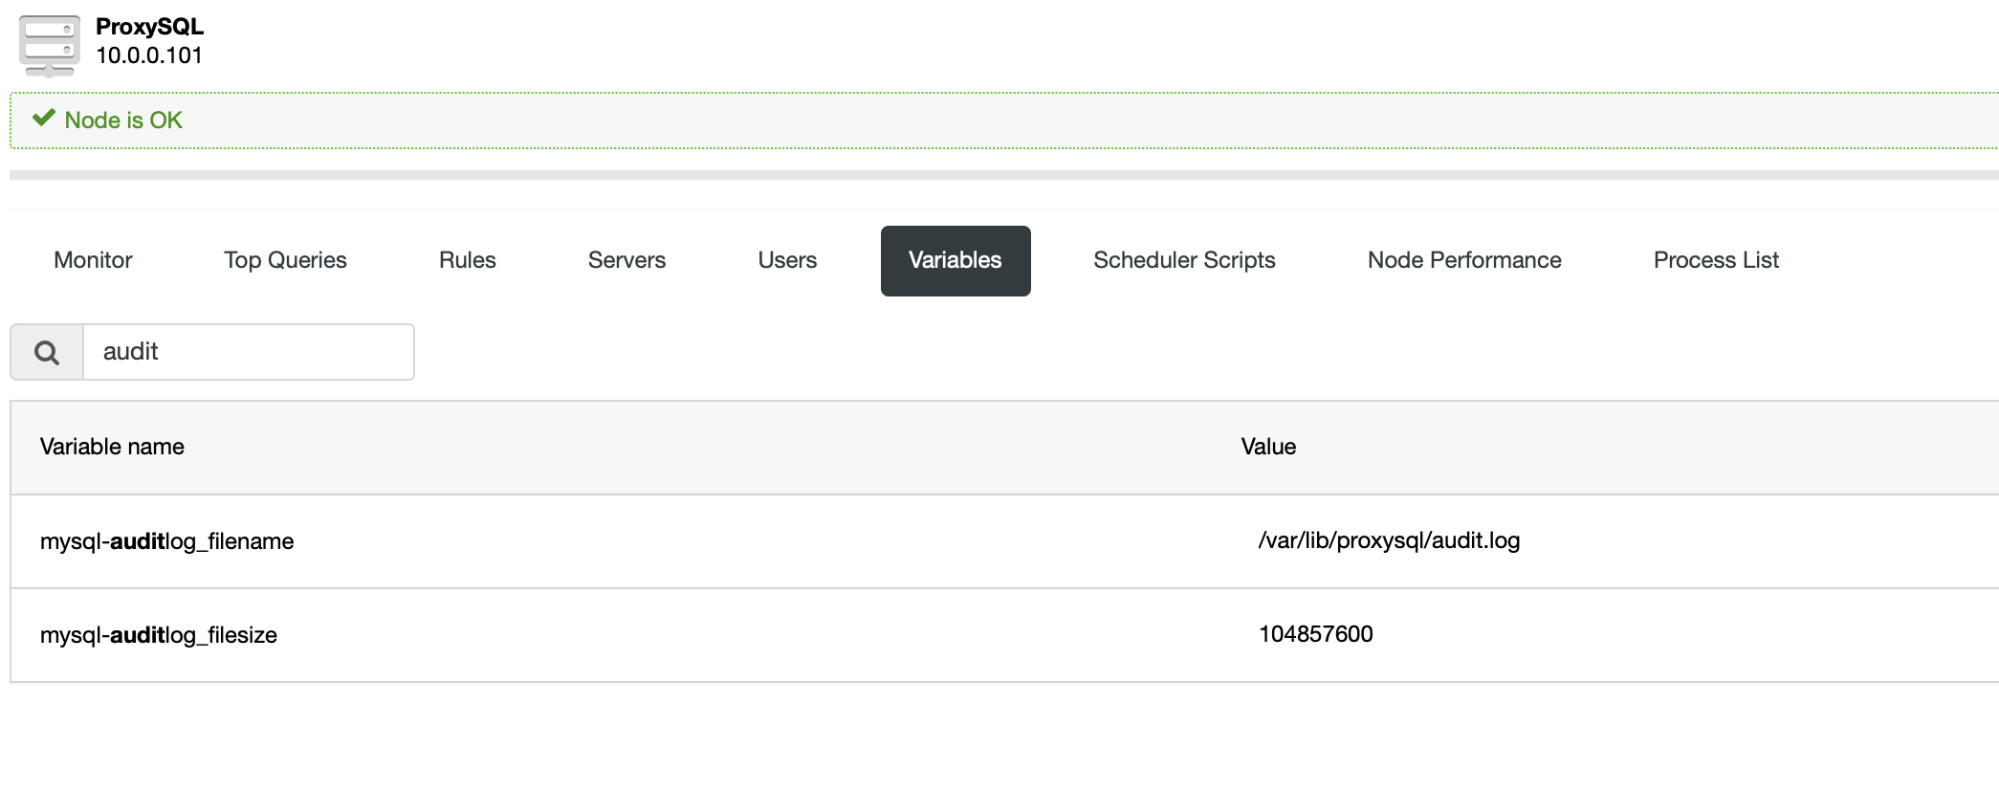
There are two settings that govern how the audit log should work:

The first one defines the file where data should be stored, the second tells how large the log file should be before it’ll be rotated. Let’s configure log in ProxySQL data directory:

Now, we can take a look at the data we see in the audit log file. First of all, the format in which data is stored is JSON. There are two types of events, one related to MySQL connectivity and second related to ProxySQL admin interface connectivity.

Here is an example of entries triggered by MySQL traffic:

"client_addr": "10.0.0.100:40578",

  "event": "MySQL_Client_Connect_OK",

  "proxy_addr": "0.0.0.0:6033",

  "schemaname": "sbtest",

  "ssl": false,

  "thread_id": 810,

  "time": "2020-01-23 14:24:17.595",

  "timestamp": 1579789457595,

  "username": "sbtest"

}

{

  "client_addr": "10.0.0.100:40572",

  "event": "MySQL_Client_Quit",

  "proxy_addr": "0.0.0.0:6033",

  "schemaname": "sbtest",

  "ssl": false,

  "thread_id": 807,

  "time": "2020-01-23 14:24:17.657",

  "timestamp": 1579789457657,

  "username": "sbtest"

}

{

  "client_addr": "10.0.0.100:40572",

  "creation_time": "2020-01-23 14:24:17.357",

  "duration": "299.653ms",

  "event": "MySQL_Client_Close",

  "extra_info": "MySQL_Thread.cpp:4307:process_all_sessions()",

  "proxy_addr": "0.0.0.0:6033",

  "schemaname": "sbtest",

  "ssl": false,

  "thread_id": 807,

  "time": "2020-01-23 14:24:17.657",

  "timestamp": 1579789457657,

  "username": "sbtest"

}

As you can see, most of the data repeats: client address, ProxySQL address, schema name, if SSL was used in connections, related thread number in MySQL, user that created the connection. The “MySQL_Client_Close” event also contains information about the time when the connection was created and the duration of the connection. You can also see which part of ProxySQL code was responsible for closing the connection.

Admin connections are quite similar:

{

  "client_addr": "10.0.0.100:52056",

  "event": "Admin_Connect_OK",

  "schemaname": "information_schema",

  "ssl": false,

  "thread_id": 815,

  "time": "2020-01-23 14:24:19.490",

  "timestamp": 1579789459490,

  "username": "proxysql-admin"

}

{

  "client_addr": "10.0.0.100:52056",

  "event": "Admin_Quit",

  "schemaname": "information_schema",

  "ssl": false,

  "thread_id": 815,

  "time": "2020-01-23 14:24:19.494",

  "timestamp": 1579789459494,

  "username": "proxysql-admin"

}

{

  "client_addr": "10.0.0.100:52056",

  "creation_time": "2020-01-23 14:24:19.482",

  "duration": "11.795ms",

  "event": "Admin_Close",

  "extra_info": "MySQL_Thread.cpp:3123:~MySQL_Thread()",

  "schemaname": "information_schema",

  "ssl": false,

  "thread_id": 815,

  "time": "2020-01-23 14:24:19.494",

  "timestamp": 1579789459494,

  "username": "proxysql-admin"

}

The data collected is very similar, the main difference is that it is related to connections to the ProxySQL administrative interface.

Conclusion

As you can see, in a very easy way you can enable auditing of the access to ProxySQL. This, especially the administrative access, is something which should be monitored from the security standpoint. Audit plugin makes it quite easy to accomplish.

What to Monitor in MySQL 8.0

$
0
0

Monitoring is a must in all environments, and databases aren’t the exception. Once you have your database infrastructure up-and-running, you’ll need to keep tabs on what’s happening. Monitoring is a must if you want to be sure everything is going fine but also if you make necessary adjustments while your system grows and evolves. That will enable you to identify trends, plan for upgrades or improvements, or react adequately to any problems or errors that may arise with new versions, different purposes, and so on.

For each database technology, there are different things to monitor. Some of these are specific to the database engine, vendor, or even the particular version that you’re using. Database clusters heavily depend on the underlying infrastructure, so network and operating stats are interesting to see by the database administrators too. 

When running multiple database systems, the monitoring of these systems can become quite a chore. 

In this blog, we’ll take a look at what you need to monitor a MySQL 8.0 environment. We will also take a look at cluster control monitoring features, which may help you to track the health of your databases for free.

OS and Database System Monitoring

When observing a database cluster or node, there are two main points to take into account: the operating system and the MySQL instance itself. You will need to define which metrics you are going to monitor from both sides and how you are going to do it. You need to follow the parameter always in the meaning of your system, and you should look for alterations on the behavior model.

Grip in mind that when one of your parameters is affected, it can also affect others, making troubleshooting of the issue more complicated. Having a proper monitoring and alerting system is essential to make this task as simple as possible.

In most cases, you will need to use some tools, as it is difficult to find one to cover all the wanted metrics. 

OS System Monitoring

One major thing (which is common to all database engines and even to all systems) is to monitor the Operating System behavior. Here are some points to check here. Below you can find top system resources to watch on a database server. It's actually also the list of very first things to check.

CPU Usage

A high CPU usage is not a bad thing as long as you don’t reach the limit. Excessive percentage of CPU usage could be a problem if it’s not usual behavior. In this case, it is essential to identify the process/processes that are generating this issue. If the problem is the database process, you will need to check what is happening inside the database.

RAM Memory or SWAP Usage

Ideally, your entire database should be stored in memory, but this is not always possible. Give MySQL as much as you can afford but leave enough for other processes to function.

If you see a high value for this metric and nothing has changed in your system, you probably need to check your database configuration. Parameters like shared_buffers and work_mem can affect this directly as they define the amount of memory to be able to use for the MySQL database. Swap is for emergencies only, and it should not be used, make sure you also have your operating system set to let MySQL decide about swap usage.

Disk Usage 

Disk usage is one of the key metrics to monitor and alert. Make sure you always have free space for new data, temporary files, snapshots, or backups.

Monitoring hard metric values is not good enough. An abnormal increase in the use of disk space or an excessive disk access consumption is essential things to watch as you could have a high number of errors logged in the MySQL log file or a lousy cache configuration that could generate a vital disk access consumption instead of using memory to process the queries. Make sure you are able to catch abnormal behaviors even if your warning and critical metrics are not reached yet.

Along with monitoring space we also should monitor disk activity.  The top values to monitor are:

  • Read/Write requests
  • IO Queue length
  • Average IO wait
  • Average Read/Write time
  • Read/Write bandwidth

You can use iostat or pt-diskstats from Percona to see all these details. 

Things that can affect your disk performance are often related to data transfer from and towards your disk so monitor abnormal processes than can be started from other users.

Load Average

An all-in-one performance metric. Understanding Linux Load is a key to monitor OS and database dependent systems.

Load average related to the three points mentioned above. A high load average could be generated by an excessive CPU, RAM, or disk usage.

Network

Unless doing backups or transferring vast amounts of data, it shouldn’t be the bottleneck.

A network issue can affect all the systems as the application can’t connect (or connect losing packages) to the database, so this is an important metric to monitor indeed. You can monitor latency or packet loss, and the main issue could be a network saturation, a hardware issue, or just a lousy network configuration.

Database Monitoring

While monitoring is a must, it’s not typically free. There is always a cost on the database performance, depending on how much you are monitoring, so you should avoid monitoring things that you won’t use.

In general, there are two ways to monitor your databases, from the logs or from the database side by querying.

In the case of logs, to be able to use them, you need to have a high logging level, which generates high disk access and it can affect the performance of your database.

For the querying mode, each connection to the database uses resources, so depending on the activity of your database and the assigned resources, it may affect the performance too.

Of course, there are many metrics in MySQL. Here we will focus on the top important.

Monitoring Active Sessions

You should also track the number of active sessions and DB up down status. Often to understand the problem you need to see how long the database is running. so we can use this to detect respawns.

The next thing would be a number of sessions. If you are near the limit, you need to check if something is wrong or if you just need to increment the max_connections value. The difference in the number can be an increase or decrease of connections. Improper usage of connection pooling, locking or network issues are the most common problems related to the number of connections.

The key values here are

  • Uptime
  • Threads_connected
  • Max_used_connections
  • Aborted_connects

Database Locks

If you have a query waiting for another query, you need to check if that another query is a normal process or something new. In some cases, if somebody is making an update on a big table, for example, this action can be affecting the normal behavior of your database, generating a high number of locks.

Monitoring Replication

The key metrics to monitor for replication are the lag and the replication state. Not only the up down status but also the lag because a continuous increase in this value is not a very good sign as it means that the slave is not able to catch up with its master.

The most common issues are networking issues, hardware resource issues, or under dimensioning issues. If you are facing a replication issue you will need to know this asap as you will need to fix it to ensure the high availability environment. 

Replication is best monitored by checking SLAVE STATUS and the following parameters:

  • SLAVE_RUNNING
  • SLAVE_IO_Running
  • SLAVE_SQL_RUNNING
  • LAST_SQL_ERRNO
  • SECONDS_BEHIND_MASTER

Backups

Unfortunately, the vanilla community edition doesn't come with the backup manager. You should know if the backup was completed, and if it’s usable. Usually, this last point is not taken into account, but it’s probably the most critical check in a backup process. Here we would have to use external tools like percona-xtrabackup or ClusterControl.

Database Logs

You should monitor your database log for errors like FATAL or deadlock, or even for common errors like authentication issues or long-running queries. Most of the errors are written in the log file with detailed useful information to fix it. Common failure points you need to keep an eye on are errors, log file sizes. The location of the error log can be found under the log_error variable.

External Tools

Last but not least you can find a list of useful tools to monitor your database activity. 

Percona Toolkit - is the set of Linux tools from Percona to analyze MySQL and OS activities. You can find it here. It supports the most popular 64 bit Linux distributions like Debian, Ubuntu, and Redhat. 

mysqladmin - mysqladmin is an administration program for the MySQL daemon. It can be used to check server health (ping), list the processes, see the values of the variables, but also do some administrative work like create/drop databases, flush (reset) logs, statistics, and tables, kill running queries, stop the server and control replication.

innotop - offers an extended view of SHOW statements. It's very powerful and can significantly reduce the investigation time. Among vanilla MySQL support, you can see the Galera view and Master-slave replication details. 

mtop - monitors a MySQL server showing the queries which are taking the most amount of time to complete. Features include 'zooming' in on a process to show the complete query, 'explaining' the query optimizer information for a query and 'killing' queries. In addition, server performance statistics, configuration information, and tuning tips are provided.

Mytop -  runs in a terminal and displays statistics about threads, queries, slow queries, uptime, load, etc. in tabular format, much similar to the Linux

Conclusion

This blog is not intended to be an exhaustive guide to how to enhance database monitoring, but it hopefully gives a clearer picture of what things can become essential and some of the basic parameters that can be watched. Do not hesitate to let us know if we’ve missed any important ones in the comments below.


Managing Database Backup Retention Schedules

$
0
0

Attention: Skip reading this blog post if you can afford unlimited storage space. 

If you could afford unlimited storage space, you wouldn't have to worry about backup retention at all, since you could store your backups infinitely without any restriction, provided your storage space provider can assure the data won't be missing. Database backup retention is commonly overlooked because it doesn't seem important at first, and only comes into sheer attention when you have stumbled upon resource limit or hit a bottleneck.

In this blog post, we are going to look into database backup retention management and scheduling and how we can manage them efficiently with ClusterControl.

Database Backup Retention Policy

Database backup retention policy refers to how long the database backups are kept within our possession. Some examples would be:

  • daily backups for big databases are kept for one week using local storage, 
  • weekly backups for small databases are kept for eight weeks on disk storage (both local and remote),
  • monthly backups for all databases are kept for 3 months on cloud storage,
  • no backups are saved beyond 3 months.

The main advantage of having a database backup retention policy is to make sure we efficiently manage our storage resources, without impacting our database recovery process if something goes wrong. You don't want to get caught up when an urgent recovery is needed and the necessary backup file is no longer there to help us perform restoration because we had got it deleted to clear some space up.

To build a good backup retention policy, we need to consider the two most important aspects:

  • Backup storage size.
  • Database backup size.

Backup Storage Size

The first priority is to ensure that we have enough space to store our backups as a starter. A simple rule of thumb is the storage space must at least have the same size as the data directory size for the database server. Generally, the bigger the storage size, the bigger the cost is. If you can opt for a bigger storage space, you can keep older backups longer. This aspect hugely influences your retention policy in terms of the number of backups that you can store. 

Storing the backups off-site, in the cloud, can be a good way to secure your backups against disaster. It comes with a higher price per GB ratio but it's still affordable considering the advantages that you will get from it. Most of the cloud storage providers now offer a secure, scalable, highly available with decent IO performance. Either way, ClusterControl supports storing your backup in the local storage, remote storage or in the cloud.

Database Backup Size

The size of backups are directly affected by the following factors:

  • Backup tools - Physical backup is commonly bigger than logical backup.
  • Backup method - Incremental and partial backups are smaller than a full backup.
  • Compression ratio - Higher compression level produces smaller backup, with a tradeoff of processing power.

Mix and match these 3 factors will allow you to have a suitable backup size to fit into your backup storage and restoration policy. If storing a full backup is considered too big and costly, we can combine incremental backups with a full backup to have a backup for one particular set. Incremental backups commonly stores the delta between two points, and usually only takes a relatively small amount of disk space if compared to a full backup. Or, you can opt for a full partial backup, just backs up chosen databases or tables that can potentially impact the business operation.

If a full physical backup with a compression ratio of 50%, producing 100M of backup size, you could increase the compression ratio to 100% in order to reduce the disk space usage but with a slower backup creation time. Just make sure that you are complying with your database recovery policy when deciding which backup tools, method and compression ratio to use.

Managing Retention Schedules Using ClusterControl

ClusterControl sophisticated backup management features includes the retention management for all database backup methods when creating or scheduling a backup:

The default value is 31 days, which means the backup will be kept in possession for 31 days, and will be automatically deleted on the 32nd day after it was successfully created. The default retention value (in day) can be changed under Backup Settings. One can customize this value for every backup schedule or on-demand backup creation job to any number of days or keep it forever. ClusterControl also supports retention for backup that is stored in the supported cloud platforms (AWS S3, Google Cloud Storage and Azure Blob Storage).

When a backup is successfully created, you will see the retention period in the backup list, as highlighted in the following screenshot:

For backup purging process, ClusterControl triggers backup purge thread every single time after any backup process for that particular cluster is completed. The purge backup thread looks for all "expired" backups and performs the necessary deletion process automatically. The purging interval sounds a bit excessive in some environments but this is the best purging scheduling configuration that we have figured out for most configurations thus far.  To understand this easily, consider the following backup retention setting for a cluster:

  1. One creates a weekly backup, with a retention period of 14 days.
  2. One creates an hourly backup, with a retention period of 7 days.
  3. One creates a monthly backup, without a retention period (keep forever).

For the above configuration, ClusterControl will initiate a backup purge thread for (a) and (b) every hour because of (b), although the retention period for (a) is 14 days. Created backups that have been marked as "Keep Forever" (c) will be skipped by the purge thread. This configuration protects ClusterControl from excessive purging if the job is scheduled daily. Thus, don't be surprised if you see the following lines in job messages after any of the backup job is completed:

Advanced Retention Management with ClusterControl CLI

ClusterControl CLI a.k.a s9s, can be used to perform advanced retention management operations like deleting old backup files while keeping a number of copies exist for safety purpose. This can be very useful when you need to clear up some space and have no idea which backups that will be purged by ClusterControl, and you want to make sure that a number of copies of the backup must exist regardless of its expiration as a precaution. We can easily achieve this with the following command:

$ s9s backup \

--delete-old \

--cluster-id=4 \

--backup-retention=60 \

--cloud-retention=180 \

--safety-copies=3 \

--log


Deleting old backups.

Local backup retention is 60 day(s).

Cloud backup retention is 180 day(s).

Kept safety backup copies 3.

Querying records older than 60 day(s).

Checking for backups to purge.

No old backup records found, nothing to delete.

Checking for old backups is finished.

The above job will force ClusterControl to look for local backups that have been created which are older than 60 days and backups that are stored in the cloud which are older than 180 days. If ClusterControl finds something that matches this query, ClusterControl will make sure only the 4th copy and older will be deleted, regardless of the retention period.

The --backup-retention and --cloud-retention parameters accept a number of values:

  • A positive number  value can control how long (in days) the taken backups will be preserved.
  • -1 has a very special meaning, it means the backup will be kept forever.
  • 0 is the default, it means prefer the global setting which can be configured from the UI.

Apart from the above, the standard backup creation job can be triggered directly from the command line. The following command create a mysqldump backup for cluster ID 4 on node 192.168.1.24, where we will keep the backup forever:

$ s9s backup --create \

--backup-method=mysqldump \

--cluster-id=4 \

--nodes=192.168.1.24:3306 \

--backup-retention=-1 \

--log

192.168.1.24:3306: Preparing for backup - host state (MYSQL_OK) is acceptable.

192.168.1.24:3306: Verifying connectivity and credentials.

Checking backup creation job.

192.168.1.24:3306: Timezone of backup host is UTC.

Backup title is     ''.

Backup host is      192.168.1.24:3306.

Backup directory is /backups/production/mysqldump/.

Backup method is    mysqldump.

PITR compatible     no.

Backup record created.

Backup record saved.

192.168.1.24: Creating backup dir '/backups/production/mysqldump/BACKUPPERDB-190-mysqldump-2020-01-25_093526'.

Using gzip to compress archive.

192.168.1.24:3306: detected version 5.7.28-31-log.

Extra-arguments be passed to mysqldump:  --set-gtid-purged=OFF

Backup (mysqldump, storage node): '192.168.1.24: /usr/bin/mysqldump --defaults-file=/etc/my.cnf  --flush-privileges --hex-blob --opt --master-data=2 --single-transaction --skip-lock-tables --triggers --routines --events   --set-gtid-purged=OFF --databases mysql backupninja backupninja_doc proxydemo severalnines_prod severalnines_service --ignore-table='mysql.innodb_index_stats'  --ignore-table='mysql.innodb_table_stats' |gzip -c > /backups/production/mysqldump/BACKUPPERDB-190-mysqldump-2020-01-25_093526/mysqldump_2020-01-25_093546_dbdumpfile.sql.gz'.

192.168.1.24: MySQL >= 5.7.6 detected, enabling 'show_compatibility_56'

192.168.1.24: A progress message will be written every 1 minutes

192.168.1.24: Backup 190 completed and is stored in 192.168.1.24:/backups/production/mysqldump/BACKUPPERDB-190-mysqldump-2020-01-25_093526.

192.168.1.24:/backups/production/mysqldump/BACKUPPERDB-190-mysqldump-2020-01-25_093526: Custom retention period: never delete.

Checking for backup retention (clearing old backups).

Local backup retention is 31 day(s).

Cloud backup retention is 180 day(s).

Kept safety backup copies 1.

Querying records older than 31 day(s).

Checking for backups to purge.

Found 4 backups older than 31 day(s).

We have 9 completed full backups.

For more explanation and examples, check out the s9s backup guide.

Conclusion

ClusterControl backup retention management allows you to manage your backup storage space efficiently, without compromising your database recovery policy.

An Overview of Job Scheduling Tools for PostgreSQL

$
0
0

Unlike other database management systems that have their own built-in scheduler (like Oracle, MSSQL or MySQL), PostgreSQL still doesn’t have this kind of feature.

In order to provide scheduling functionality in PostgreSQL you will need to use an external tool like...

  • Linux crontab
  • Agent pgAgent
  • Extension pg_cron

In this blog we will explore these tools and highlight how to operate them and their main features.

Linux crontab

It’s the oldest one, however, an efficient and useful way to execute scheduling tasks. This program is based on a daemon (cron) that allows tasks to be automatically run in the background periodically and regularly verifies the configuration files ( called crontab files) on which are defined the script/command to be executed and its scheduling.

Each user can have his own crontab file and for the newest Ubuntu releases are located in: 

/var/spool/cron/crontabs (for other linux distributions the location could be different):

root@severalnines:/var/spool/cron/crontabs# ls -ltr

total 12

-rw------- 1 dbmaster crontab 1128 Jan 12 12:18 dbmaster

-rw------- 1 slonik   crontab 1126 Jan 12 12:22 slonik

-rw------- 1 nines    crontab 1125 Jan 12 12:23 nines

The syntax of the configuration file is the following:

mm hh dd mm day <<command or script to execute>>


mm: Minute(0-59)

hh: Hour(0-23)

dd: Day(1-31)

mm: Month(1-12)

day: Day of the week(0-7 [7 or 0 == Sunday])

A few operators could be used with this syntax to streamline the scheduling definition and these symbols allow to specify multiple values in a field:

Asterisk (*)  - it means all possible values for a field

The comma (,) - used to define a list of values

Dash (-) - used to define a range of values

Separator (/) - specifies a step value

The script all_db_backup.sh will be executed according each scheduling expression:

0 6 * * * /home/backup/all_db_backup.sh

At 6 am every day

20 22 * * Mon, Tue, Wed, Thu, Fri /home/backup/all_db_backup.sh

At 10:20 PM, every weekday

0 23 * * 1-5 /home/backup/all_db_backup.sh

At 11 pm during the week

0 0/5 14 * * /home/backup/all_db_backup.sh

Every five hours starting at 2:00 p.m. and ending at 2:55 p.m., every day

Although it’s not very difficult, this syntax can be automatically generated on multiple web pages.

If the crontab file doesn’t exist for a user it can be created by the following command:

slonik@severalnines:~$ crontab -e

or presented it using the -l parameter:

slonik@severalnines:~$ crontab -l

If necessary to remove this file, the appropriate parameter is -r:

slonik@severalnines:~$ crontab -r

The cron daemon status is shown by the execution of the following command:

Agent pgAgent

The pgAgent is a job scheduling agent available for PostgreSQL that allows the execution of stored procedures, SQL statements, and shell scripts. Its configuration is stored on the postgres database in the cluster.

The purpose is to have this agent running as a daemon on Linux systems and periodically does a connection to the database to check if there are any jobs to execute.

This scheduling is easily managed by PgAdmin 4, but it’s not installed by default once the pgAdmin installed, it’s necessary to download and install it on your own.

Hereafter are described all the necessary steps to have the pgAgent working properly:

Step One

Installation of pgAdmin 4

$ sudo apt install pgadmin4 pgadmin4-apache

Step Two

Creation of plpgsql procedural language if not defined

CREATE TRUSTED PROCEDURAL LANGUAGE ‘plpgsql’

     HANDLER plpgsql_call_handler

          HANDLER plpgsql_validator;

Step Three

Installation of  pgAgent

$ sudo apt-get install pgagent

Step Four

Creation of the pgagent extension

CREATE EXTENSION pageant 

This extension will create all the tables and functions for the pgAgent operation and hereafter is showed the data model used by this extension:

Now the pgAdmin interface already has the option “pgAgent Jobs” in order to manage the pgAgent: 

In order to define a new job, it’s only necessary select "Create" using the right button on “pgAgent Jobs”, and it’ll insert a designation for this job and define the steps to execute it:

In the tab “Schedules” must be defined the scheduling for this new job:

Finally, to have the agent running in the background it’s necessary to launch the following process manually:

/usr/bin/pgagent host=localhost dbname=postgres user=postgres port=5432 -l 1

Nevertheless, the best option for this agent is to create a daemon with the previous command.

Extension pg_cron

The pg_cron is a cron-based job scheduler for PostgreSQL that runs inside the database as an extension (similar to the DBMS_SCHEDULER in Oracle) and allows the execution of database tasks directly from the database, due to a background worker.

The tasks to perform can be any of the following ones:

  • stored procedures
  • SQL statements
  • PostgreSQL commands (as VACUUM, or VACUUM ANALYZE)

pg_cron can run several jobs in parallel, but only one instance of a program can be running at a time. 

If a second run should be started before the first one finishes, then it is queued and will be started as soon as the first run completes.

This extension was defined for the version 9.5 or higher of PostgreSQL.

Installation of pg_cron

The installation of this extension only requires the following command:

slonik@sveralnines:~$ sudo apt-get -y install postgresql-10-cron

Updating of Configuration Files

In order to start the pg_cron background worker once PostgreSQL server starts, it’s necessary to set pg_cron to shared_preload_libraries parameter in postgresql.conf: 

shared_preload_libraries = ‘pg_cron’

It’s also necessary to define in this file, the database on which the pg_cron extension will be created, by adding the following parameter:

cron.database_name= ‘postgres’

On the other hand, in pg_hba.conf file that manages the authentication, it’s necessary to define the postgres login as trust for the IPV4 connections, because pg_cron requires such user to be able to connect to the database without providing any password, so the following line needs to be added to this file:

host postgres postgres 192.168.100.53/32 trust

The trust method of authentication allows anyone to connect to the database(s) specified in the pg_hba.conf file, in this case the postgres database. It's a method used often to allow connection using Unix domain socket on a single user machine to access the database and should only be used when there isan  adequate operating system-level protection on connections to the server.

Both changes require a PostgreSQL service restart:

slonik@sveralnines:~$ sudo system restart postgresql.service

It’s important to take into account that pg_cron does not run any jobs as long as the server is in hot standby mode, but it automatically starts when the server is promoted.

Creation of pg_cron extension

This extension will create the meta-data and the procedures to manage it, so the following command should be executed on psql:

postgres=#CREATE EXTENSION pg_cron;

CREATE EXTENSION

Now, the needed objects to schedule jobs are already defined on the cron schema:

This extension is very simple, only the job table is enough to manage all this functionality:

Definition of New Jobs

The scheduling syntax to define jobs on pg_cron is the same one used on the cron tool, and the definition of new jobs is very simple, it’s only necessary to call the function cron.schedule:

select cron.schedule('*/5 * * * *','CALL reporting.p_compute_client_data(12356,''DAILY_DATA'');')

select cron.schedule('*/5 * * * *','CALL reporting.p_compute_client_data(998934,''WEEKLY_DATA'');')

select cron.schedule('*/5 * * * *','CALL reporting.p_compute_client_data(45678,''DAILY_DATA'');')

select cron.schedule('*/5 * * * *','CALL reporting.p_compute_client_data(1010,''WEEKLY_DATA'');')

select cron.schedule('*/5 * * * *','CALL reporting.p_compute_client_data(1001,''MONTHLY_DATA'');')

select cron.schedule('*/5 * * * *','select reporting.f_reset_client_data(0,''DATA'')')

select cron.schedule('*/5 * * * *','VACUUM')

select cron.schedule('*/5 * * * *','$$DELETE FROM reporting.rep_request WHERE create_dt<now()- interval '60 DAYS'$$)

The job setup is stored on the job table: 

Another way to define a job is by inserting the data directly on the cron.job table:

INSERT INTO cron.job (schedule, command, nodename, nodeport, database, username)

VALUES ('0 11 * * *','call loader.load_data();','postgresql-pgcron',5442,'staging', 'loader');

and use custom values for nodename and nodeport to connect to a different machine (as well as other databases).

Deactivation of a Jobs

On the other hand, to deactivate a job it’s only necessary to execute the following function:

select cron.schedule(8)

Jobs Logging

The logging of these jobs can be found on the PostgreSQL log file /var/log/postgresql/postgresql-12-main.log:

What to Check if the MySQL I/O Utilisation is High

$
0
0

The I/O performance is vital for MySQL databases. Data is read and written to the disk in numerous places. Redo logs, tablespaces, binary and relay logs. With an increase of the usage of solid state drives I/O performance has significantly increased allowing users to push their databases even faster but even then I/O may become a bottleneck and a limiting factor of the performance of the whole database. In this blog post we will take a look at the things you want to check if you notice your I/O performance is high on your MySQL instance.

What does “High” I/O utilisation mean? In short, if the performance of your database is affected by it, it is high. Typically you would notice it as writes slowing down in the database. It will also clearly manifest as high I/O wait on your system. Please keep in mind, though, on hosts with 32 and more CPU cores, even if one core will show 100% I/O wait, you may not notice it on a aggregated view - it will represent only 1/32 of the whole load. Seems not impacting but in fact some single-threaded I/O operation is saturating your CPU and some application is waiting for that I/O activity to finish.

Let’s say we did notice an increase in the I/O activity, just as in the screenshot above. What to look at if you noticed high I/O activity? First, check the list of the processes in the system. Which one is responsible for an I/O wait? You can use iotop to check that:

In our case it is quite clear that it is MySQL which is responsible for most of it. We should start with the simplest check - what exactly is running in the MySQL right now?

We can see there is replication activity on our slave. What is happening to the master?

We can clearly see some batch load job is running. This sort of ends our journey here as we managed to pinpoint the problem quite easily.

There are other cases, though, which may not be that easy to understand and track. MySQL comes with some instrumentation, which is intended to help with understanding the I/O activity in the system. As we mentioned, I/O can be generated in numerous places in the system. Writes are the most clear ones but we may also have on-disk temporary tables - it’s good to see if your queries do use such tables or not.

If you have performance_schema enabled, one way to check which files are responsible for the I/O load can be to query ‘table_io_waits_summary_by_table’:

*************************** 13. row ***************************

                FILE_NAME: /tmp/MYfd=68

               EVENT_NAME: wait/io/file/sql/io_cache

    OBJECT_INSTANCE_BEGIN: 140332382801216

               COUNT_STAR: 17208

           SUM_TIMER_WAIT: 23332563327000

           MIN_TIMER_WAIT: 1596000

           AVG_TIMER_WAIT: 1355913500

           MAX_TIMER_WAIT: 389600380500

               COUNT_READ: 10888

           SUM_TIMER_READ: 20108066180000

           MIN_TIMER_READ: 2798750

           AVG_TIMER_READ: 1846809750

           MAX_TIMER_READ: 389600380500

 SUM_NUMBER_OF_BYTES_READ: 377372793

              COUNT_WRITE: 6318

          SUM_TIMER_WRITE: 3224434875000

          MIN_TIMER_WRITE: 16699500

          AVG_TIMER_WRITE: 510356750

          MAX_TIMER_WRITE: 223219960500

SUM_NUMBER_OF_BYTES_WRITE: 414000000

               COUNT_MISC: 2

           SUM_TIMER_MISC: 62272000

           MIN_TIMER_MISC: 1596000

           AVG_TIMER_MISC: 31136000

           MAX_TIMER_MISC: 60676000

*************************** 14. row ***************************

                FILE_NAME: /tmp/Innodb Merge Temp File

               EVENT_NAME: wait/io/file/innodb/innodb_temp_file

    OBJECT_INSTANCE_BEGIN: 140332382780800

               COUNT_STAR: 1128

           SUM_TIMER_WAIT: 16465339114500

           MIN_TIMER_WAIT: 8490250

           AVG_TIMER_WAIT: 14596931750

           MAX_TIMER_WAIT: 583930037500

               COUNT_READ: 540

           SUM_TIMER_READ: 15103082275500

           MIN_TIMER_READ: 111663250

           AVG_TIMER_READ: 27968670750

           MAX_TIMER_READ: 583930037500

 SUM_NUMBER_OF_BYTES_READ: 566231040

              COUNT_WRITE: 540

          SUM_TIMER_WRITE: 1234847420750

          MIN_TIMER_WRITE: 286167500

          AVG_TIMER_WRITE: 2286754250

          MAX_TIMER_WRITE: 223758795000

SUM_NUMBER_OF_BYTES_WRITE: 566231040

               COUNT_MISC: 48

           SUM_TIMER_MISC: 127409418250

           MIN_TIMER_MISC: 8490250

           AVG_TIMER_MISC: 2654362750

           MAX_TIMER_MISC: 43409881500

As you can see above, it also shows temporary tables that are in use.

To double-check if a particular query uses temporary table you can use EXPLAIN FOR CONNECTION:

mysql> EXPLAIN FOR CONNECTION 3111\G

*************************** 1. row ***************************

           id: 1

  select_type: SIMPLE

        table: sbtest1

   partitions: NULL

         type: ALL

possible_keys: NULL

          key: NULL

      key_len: NULL

          ref: NULL

         rows: 986400

     filtered: 100.00

        Extra: Using temporary; Using filesort

1 row in set (0.16 sec)

On the example above a temporary table is used for filesort.

Another way of catching up disk activity is, if you happen to use Percona Server for MySQL, to enable full slow log verbosity:

mysql> SET GLOBAL log_slow_verbosity='full';

Query OK, 0 rows affected (0.00 sec)

Then, in the slow log, you may see entries like this:

# Time: 2020-01-31T12:05:29.190549Z

# User@Host: root[root] @ localhost []  Id: 12395

# Schema:   Last_errno: 0  Killed: 0

# Query_time: 43.260389  Lock_time: 0.031185 Rows_sent: 1000000  Rows_examined: 2000000 Rows_affected: 0

# Bytes_sent: 197889110  Tmp_tables: 0 Tmp_disk_tables: 0  Tmp_table_sizes: 0

# InnoDB_trx_id: 0

# Full_scan: Yes  Full_join: No Tmp_table: No  Tmp_table_on_disk: No

# Filesort: Yes  Filesort_on_disk: Yes  Merge_passes: 141

#   InnoDB_IO_r_ops: 9476  InnoDB_IO_r_bytes: 155254784  InnoDB_IO_r_wait: 5.304944

#   InnoDB_rec_lock_wait: 0.000000  InnoDB_queue_wait: 0.000000

#   InnoDB_pages_distinct: 8191

SET timestamp=1580472285;

SELECT * FROM sbtest.sbtest1 ORDER BY RAND();

As you can see, you can tell if there was a temporary table on disk or if the data was sorted on disk. You can also check the number of I/O operations and amount of data accessed.

We hope this blog post will help you understand the I/O activity in the system and let you manage it better.


Is My Database Vulnerable to Attack? A Security Checklist

$
0
0

Data is probably the most important asset in a company, so you should make sure your database is secured to avoid any possible data theft. It’s hard to create an environment that is 100% secure, but in this blog we’ll share a checklist to help you make your database as secure as possible.

Controlling Database Access

You should always restrict both physical and remote access.

  • Physical access (on-prem): Restrict unauthorized physical access to the database server.
  • Remote access: Limit the remote access to only the necessary people, and from the less amount of source possibles. Using a VPN to access it is definitely a must here.

Managing Database User Accounts

Depending on the technology, there are many ways to improve security for your user accounts.

  • Remove inactive users.
  • Grant only the necessary privileges.
  • Restrict the source for each user connection.
  • Define a secure password policy (or, depending on the technology, enable a plugin for this if there is one).

Secure Installations and Configurations

There are some changes to do to secure your database installation.

  • Install only the necessary packages and services on the server.
  • Change the default admin user password and restrict the usage from only the localhost.
  • Change the default port and specify the interface to listen in.
  • Enable password security policy plugin.
  • Configure SSL certificates to encrypt data in-transit.
  • Encrypt data at-rest (if it’s possible).
  • Configure the local firewall to allow access to the database port only from the local network (if it’s possible).

Employ a WAF to Avoid SQL Injections or DoS attack (Denial of Service)

These are the most common attacks to a database, and the most secure way to avoid it is by using a WAF (Web Application Firewall) to catch this kind of SQL queries or a SQL Proxy to analyze the traffic.

Keep Your OS and Database Up-to-Date

There are several fixes and improvements that the database vendor or the operating system release in order to fix or avoid vulnerabilities. It’s important to keep your system as up-to-date as possible applying patches and security upgrades.

Check CVE (Common Vulnerabilities and Exposures) Frequently

Every day, new vulnerabilities are detected for your database server. You should check it frequently to know if you need to apply a patch or change something in your configuration. One way to know it is by reviewing the CVE website, where you can find a list of vulnerabilities with a description, and you can look for your database version and vendor, to confirm if there is something critical to fix ASAP.

Conclusion

Following the tips above, your server will be safer, but unfortunately, there is always a risk of being hacked.

To minimize this risk, you should have a good monitoring system like ClusterControl, and run periodically some security scan tool looking for vulnerabilities like Nessus.


My MySQL Database is Out of Disk Space

$
0
0

When the MySQL server ran out of disk space, you would see one of the following error in your application (as well as in the MySQL error log):

ERROR 3 (HY000) at line 1: Error writing file '/tmp/AY0Wn7vA' (Errcode: 28 - No space left on device)

For binary log:

[ERROR] [MY-000035] [Server] Disk is full writing './binlog.000019' (OS errno 28 - No space left on device). Waiting for someone to free space... Retry in 60 secs. Message reprinted in 600 secs.

For relay log:

[ERROR] [MY-000035] [Server] Disk is full writing './relay-bin.000007' (OS errno 28 - No space left on device). Waiting for someone to free space... Retry in 60 secs. Message reprinted in 600 secs.

For slow query log:

[ERROR] [MY-011263] [Server] Could not use /var/log/mysql/mysql-slow.log for logging (error 28 - No space left on device). Turning logging off for the server process. To turn it on again: fix the cause, then either restart the query logging by using "SET GLOBAL SLOW_QUERY_LOG=ON" or restart the MySQL server.

For InnoDB:

[ERROR] [MY-012144] [InnoDB] posix_fallocate(): Failed to preallocate data for file ./#innodb_temp/temp_8.ibt, desired size 16384 bytes. Operating system error number 28. Check that the disk is not full or a disk quota exceeded. Make sure the file system supports this function. Some operating system error numbers are described at http://dev.mysql.com/doc/refman/8.0/en/operating-system-error-codes.html
[Warning] [MY-012638] [InnoDB] Retry attempts for writing partial data failed.
[ERROR] [MY-012639] [InnoDB] Write to file ./#innodb_temp/temp_8.ibt failed at offset 81920, 16384 bytes should have been written, only 0 were written. Operating system error number 28. Check that your OS and file system support files of this size. Check also that the disk is not full or a disk quota exceeded.
[ERROR] [MY-012640] [InnoDB] Error number 28 means 'No space left on device'
[Warning] [MY-012145] [InnoDB] Error while writing 16384 zeroes to ./#

They are all reporting the same error code number which is 28. Alternatively, we can use the error code to see the actual error with perror command:

$ perror 28
OS error code  28: No space left on device

The above simply means the MySQL server is out of disk space, and most of the time MySQL is stopped or stalled at this point. In this blog post, we are going to look into ways to solve this issue for MySQL running in a Linux-based environment.

Troubleshooting

First of all, we have to determine which disk partition is full. MySQL can be configured to store data on different disk or partition. Look at the path as stated in the error to start with. In this example, our directory is located in the default location, /var/lib/mysql which is under the / partition. We can use df command and specify the full path to the datadir to get the partition the data is stored:

$ df -h /var/lib/mysql
Filesystem      Size Used Avail Use% Mounted on
/dev/sda1        40G 40G 20K 100% /

The above means we have to clear up some space in the root partition.

Temporary Workarounds

The temporary workaround is to clear up some disk space so MySQL can write to the disk and resume the operation. Things that we can do if we face this kind of problems are:

  • Remove unnecessary files
  • Purge binary logs
  • Drop old tables, or rebuild a very big table

Remove Unnecessary Files

This is commonly the first step to do if MySQL server is down or unresponsive, or you have no binary logs enabled. For example, files under /var/log/ are commonly the first place to look for unnecessary files:

$ cd /var/log
$ find . -type f -size +5M -exec du -sh {} +
8.1M ./audit/audit.log.6
8.1M ./audit/audit.log.5
8.1M ./audit/audit.log.4
8.1M ./audit/audit.log.3
8.1M ./audit/audit.log.2
8.1M ./audit/audit.log.1
11M ./audit/audit.log
8.5M ./secure-20190429
8.0M ./wtmp

The above example shows how to retrieve files that are bigger than 5MB. We can safely remove the rotated log files which are usually in {filename}.{number} format, for example audit.log.1 until audit.log.6. The same thing goes to any huge older backups that are stored in the server. If you had performed a restoration via Percona Xtrabackup or MariaDB Backup, all files prefixed with xtrabackup_ can be removed from the MySQL datadir, as they are no longer necessary for the restoration. The xtrabackup_logfile usually is the biggest file since it contains all transactions executed while the xtrabackup process copying the datadir to the destination. The following example shows all the related files in MySQL datadir:

$ ls -lah /var/lib/mysql | grep xtrabackup_
-rw-r-----.  1 mysql root   286 Feb 4 11:30 xtrabackup_binlog_info
-rw-r--r--.  1 mysql root    24 Feb 4 11:31 xtrabackup_binlog_pos_innodb
-rw-r-----.  1 mysql root    83 Feb 4 11:31 xtrabackup_checkpoints
-rw-r-----.  1 mysql root   808 Feb 4 11:30 xtrabackup_info
-rw-r-----.  1 mysql root  179M Feb 4 11:31 xtrabackup_logfile
-rw-r--r--.  1 mysql root     1 Feb 4 11:31 xtrabackup_master_key_id
-rw-r-----.  1 mysql root   248 Feb 4 11:31 xtrabackup_tablespaces

Therefore, the mentioned files are safe to be deleted. Start MySQL service once there is at least 10% more free space.

Purge the Binary Logs

If the MySQL server is still responsive and it has binary log enabled, e.g, for replication or point-in-time recovery, we can purge the old binary log files by using PURGE statement and provide the interval. In this example, we are deleting all binary logs before 3 days ago:

mysql> SHOW BINARY LOGS;
mysql> PURGE BINARY LOGS BEFORE DATE(NOW() - INTERVAL 3 DAY);
mysql> SHOW BINARY LOGS;

For MySQL Replication, it's safe to delete all logs that have been replicated and applied on slaves. Check the Relay_Master_Log_File value on the server:

mysql> SHOW SLAVE STATUS\G
...
        Relay_Master_Log_File: binlog.000008
...

And delete the older log files for example binlog.000007 and older. It's good practice to restart MySQL server to make sure that it has enough resources. We can also let the binary log rotation to happen automatically via expire_logs_days variable (<MySQL 8.0). For example, to keep only 3 days of binary logs, run the following statement:

mysql> SET GLOBAL expire_logs_days = 3;

Then, add the following line into MySQL configuration file under [mysqld] section:

expire_logs_days=3

In MySQL 8.0, use binlog_expire_logs_seconds instead, where the default value is 2592000 seconds (30 days). In this example, we reduce it to only 3 days (60 seconds x 60 minutes x 24 hours x 3 days):

mysql> SET GLOBAL binlog_expire_logs_seconds = (60*60*24*3);
mysql> SET PERSIST binlog_expire_logs_seconds = (60*60*24*3);

SET PERSIST will make sure the configuration is loaded in the next restart. Configuration set by this command is stored inside /var/lib/mysql/mysqld-auto.cnf.

Drop Old Tables / Rebuild Tables

Note that DELETE operation won't free up the disk space unless OPTIMIZE TABLE is executed afterward. Thus, if you have deleted many rows, and you would like to return the free space back to the OS after a huge DELETE operation, run the OPTIMIZE TABLE, or rebuild it. For example:

mysql> DELETE tbl_name WHERE id < 100000; -- remove 100K rows
mysql> OPTIMIZE TABLE tbl_name;

We can also force to rebuild a table by using ALTER statement:

mysql> ALTER TABLE tbl_name FORCE;
mysql> ALTER TABLE tbl_name; -- a.k.a "null" rebuild

Note that the above DDL operation is performed via online DDL, meaning MySQL permits concurrent DML operations while the rebuilding is ongoing. Another way to perform a defragmentation operation is to use mysqldump to dump the table to a text file, drop the table, and reload it from the dump file. Ultimately, we can also use DROP TABLE to remove the unused table or TRUNCATE TABLE to clear up all rows in the table, which consequently return the space back to the OS.

Permanent Solutions to Disk Space Issues

The permanent solution is of course adding more space to the corresponding disk or partition, or applying a shorter retention rule to keep unnecessary files in the server. If you are running on top of a scalable file storage system, you should be able to scale the resource up without too much hassle, or with minimal disruption and downtime to the MySQL service. To learn more on how to dimension your storage and understand MySQL and MariaDB capacity planning, check out this blog post.

You can be least worried with ClusterControl proactive monitoring, where you would get a warning notification when the disk space has reached 80%, and critical notification if the disk usage is 90% and higher.

Product Designer

$
0
0

We are looking for a talented product designer to help us continuously improve the user experience for our on-premise product ClusterControl and our cloud services. Lead the design of great new features and enhancements to our entire product lines. 

You are passionate about UX/UI design and understand usability, have an eye for visual consistency and a strong sense of reducing the complex to bare essentials.

Be part of a great distributed global team of highly skilled and motivated colleagues building the next generation database cluster management and monitoring application and cloud services.

Key Job Responsibilities

  • Work collaboratively with the product and development teams and direct the design of visually appealing and intuitive interfaces for all new features and enhancements for our projects
  • Initiate, suggest, and lead major UX&UI refactorings for a more intuitive user experience
  • Design visual frameworks, detailed user and interaction flows, wireframes, mockups, and quick prototypes as well as polished visual assets
  • Capture all interactions, edge-cases, “unhappy paths” and the various states of these experiences through deliverables such as user flows, product maps, wireframes, and prototypes
  • Understand user behavior and motivation at a fundamental level, through user interviews, research, etc., and through the development of journey maps, user personas, and other artifacts
  • Conduct qualitative user research, interviews, usability testing, and other research methods and data analysis techniques to make informed recommendations for UX/UI
  • Advocate for the customer and user-centered design throughout the organization
  • Understand and distill complex problems and propose simple, elegant solutions
  • Have the ability to quickly understand the business needs of any of our distinct brands, and create compelling, effective UX designs
  • Contributes to the success of the company by leading or assisting with other projects and tasks as assigned
  • Work with product management to define requirements, not only translate them to design

Essential Qualifications

  • 5+ Years of software User Experience and/or UI and Visual design experience, and shipping successful consumer-facing products at consumer-focused companies
  • Experience working with design systems and modern UI design tools (Sketch, Figma, Framer, UXPin, Invision etc)
  • Comfortable with an agile approach to design, with an emphasis on user testing and rapid prototyping and iterative design techniques
  • Story telling - Ability to tell simple user stories illustrating solutions
  • Excellent oral and written communication, presentation, and analytical skills.
  • Excellent visual design skills with sensitivity to user interactions
  • A passion for solving design problems while owning all facets of design (strategy, art direction, interaction design and research)
  • Up to date with the latest UX&UI trends, techniques and best practices
  • Proficiency in HTML and CSS for rapid prototyping

How to Identify MySQL Performance Issues with Slow Queries

$
0
0

Performance issues are common problems when administering MySQL databases. Sometimes these problems are, in fact, due to slow queries. In this blog, we'll deal with slow queries and how to identify these.

Checking Your Slow Query Logs

MySQL has the capability to filter and log slow queries. There are various ways you can investigate these, but the most common and efficient way is to use the slow query logs. 

You need to determine first if your slow query logs are enabled. To deal with this, you can go to your server and query the following variable:

MariaDB [(none)]> show global variables like 'slow%log%';

+---------------------+-------------------------------+

| Variable_name       | Value           |

+---------------------+-------------------------------+

| slow_query_log      | ON           |

| slow_query_log_file | /var/log/mysql/mysql-slow.log |

+---------------------+-------------------------------+

2 rows in set (0.001 sec)

You must ensure that the variable slow_query_log is set to ON, while the slow_query_log_file determines the path where you need to place your slow query logs. If this variable is not set, it will use the DATA_DIR of your MySQL data directory.

Accompanied by the slow_query_log variable are the long_query_time and min_examined_row_limit which impacts how the slow query logging works. Basically, the slow query logs work as SQL statements that take more than long_query_time seconds to execute and also require at least min_examined_row_limit rows to be examined. It can be used to find queries that take a long time to execute and are therefore candidates for optimization and then you can use external tools to bring the report for you, which will talk later.

By default, administrative statements (ALTER TABLE, ANALYZE TABLE, CHECK TABLE, CREATE INDEX, DROP INDEX, OPTIMIZE TABLE, and REPAIR TABLE) do not fall into slow query logs. In order to do this, you need to enable variable log_slow_admin_statements

Querying Process List and InnoDB Status Monitor

In a normal DBA routine, this step is the most common way to determine the long running queries or active running queries that causes performance degradation. It might even cause your server to be stuck followed by piled up queues that are slowly increasing due to a lock covered by a running query. You can just simply run,

SHOW [FULL] PROCESSLIST;

or

SHOW ENGINE INNODB STATUS \G

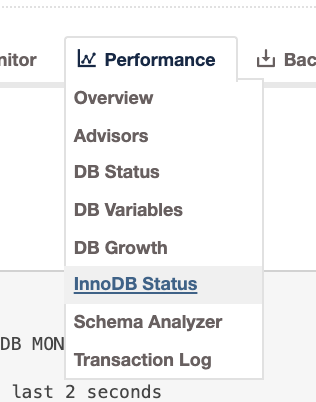
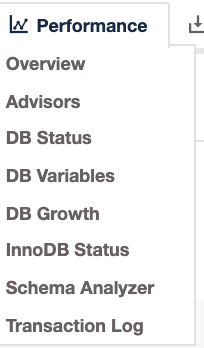
If you are using ClusterControl, you can find it by using <select your MySQL cluster> → Performance → InnoDB Status just like below,

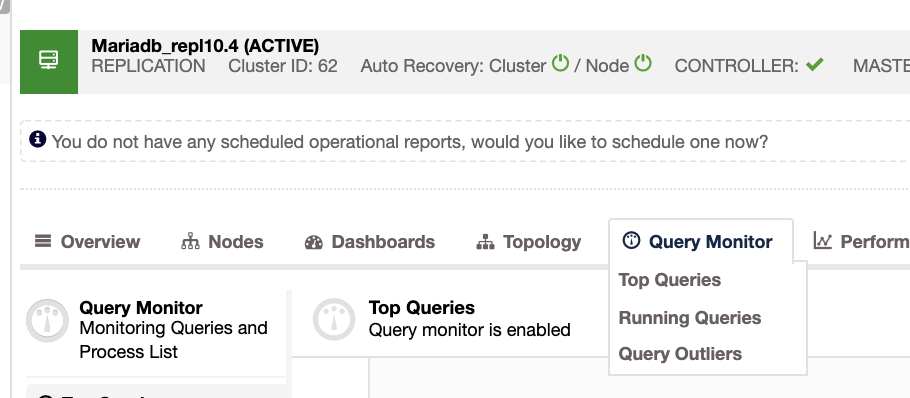
or using <select your MySQL cluster> → Query Monitor → Running Queries (which will discuss later) to view the active processes, just like how a SHOW PROCESSLIST works but with better control of the queries.

Analyzing MySQL Queries

The slow query logs will show you a list of  queries that have been identified as slow, based on the given values in the system variables as mentioned earlier. The slow queries definition might differ in different cases since there are certain occasions that even a 10 second query is acceptable and still not slow. However, if your application is an OLTP, it's very common that a 10 second or even a 5 second query is an issue or causes performance degradation to your database. MySQL query log does help you this but it's not enough to open the log file as it does not provide you an overview of what are those queries, how they perform, and what are the frequency of their occurrence. Hence, third party tools can help you with these.

pt-query-digest

Using Percona Toolkit, which I can say the most common DBA tool, is to use pt-query-digest. pt-query-digest provides you a clean overview of a specific report coming from your slow query log. For example, this specific report shows a clean perspective of understanding the slow query reports in a specific node:

# A software update is available:


# 100ms user time, 100ms system time, 29.12M rss, 242.41M vsz

# Current date: Mon Feb  3 20:26:11 2020

# Hostname: testnode7

# Files: /var/log/mysql/mysql-slow.log

# Overall: 24 total, 14 unique, 0.00 QPS, 0.02x concurrency ______________

# Time range: 2019-12-12T10:01:16 to 2019-12-12T15:31:46

# Attribute          total min max     avg 95% stddev median

# ============     ======= ======= ======= ======= ======= ======= =======

# Exec time           345s 1s 98s   14s 30s 19s 7s

# Lock time             1s 0 1s 58ms    24ms 252ms 786us

# Rows sent          5.72M 0 1.91M 244.14k   1.86M 629.44k 0

# Rows examine      15.26M 0 1.91M 651.23k   1.86M 710.58k 961.27k

# Rows affecte       9.54M 0 1.91M 406.90k 961.27k 546.96k       0

# Bytes sent       305.81M 11 124.83M  12.74M 87.73M 33.48M 56.92

# Query size         1.20k 25 244   51.17 59.77 40.60 38.53


# Profile

# Rank Query ID                         Response time Calls R/Call V/M   

# ==== ================================ ============= ===== ======= ===== 

#    1 0x00C8412332B2795DADF0E55C163... 98.0337 28.4%     1 98.0337 0.00 UPDATE sbtest?

#    2 0xDEF289292EA9B2602DC12F70C7A... 74.1314 21.5%     3 24.7105 6.34 ALTER TABLE sbtest? sbtest3

#    3 0x148D575F62575A20AB9E67E41C3... 37.3039 10.8%     6 6.2173 0.23 INSERT SELECT sbtest? sbtest

#    4 0xD76A930681F1B4CC9F748B4398B... 32.8019  9.5% 3 10.9340 4.24 SELECT sbtest?

#    5 0x7B9A47FF6967FD905289042DD3B... 20.6685  6.0% 1 20.6685 0.00 ALTER TABLE sbtest? sbtest3

#    6 0xD1834E96EEFF8AC871D51192D8F... 19.0787  5.5% 1 19.0787 0.00 CREATE

#    7 0x2112E77F825903ED18028C7EA76... 18.7133  5.4% 1 18.7133 0.00 ALTER TABLE sbtest? sbtest3

#    8 0xC37F2569578627487D948026820... 15.0177  4.3% 2 7.5088 0.00 INSERT SELECT sbtest? sbtest

#    9 0xDE43B2066A66AFA881D6D45C188... 13.7180  4.0% 1 13.7180 0.00 ALTER TABLE sbtest? sbtest3

# MISC 0xMISC                           15.8605 4.6% 5 3.1721 0.0 <5 ITEMS>


# Query 1: 0 QPS, 0x concurrency, ID 0x00C8412332B2795DADF0E55C1631626D at byte 5319

# Scores: V/M = 0.00

# Time range: all events occurred at 2019-12-12T13:23:15

# Attribute    pct total min     max avg 95% stddev  median

# ============ === ======= ======= ======= ======= ======= ======= =======

# Count          4 1

# Exec time     28 98s 98s     98s 98s 98s   0 98s

# Lock time      1 25ms 25ms    25ms 25ms 25ms       0 25ms

# Rows sent      0 0 0       0 0 0 0       0

# Rows examine  12 1.91M 1.91M   1.91M 1.91M 1.91M       0 1.91M

# Rows affecte  20 1.91M 1.91M   1.91M 1.91M 1.91M       0 1.91M

# Bytes sent     0 67 67      67 67 67   0 67

# Query size     7 89 89      89 89 89   0 89

# String:

# Databases    test

# Hosts        localhost

# Last errno   0

# Users        root

# Query_time distribution

#   1us

#  10us

# 100us

#   1ms

#  10ms

# 100ms

#    1s

#  10s+  ################################################################

# Tables

#    SHOW TABLE STATUS FROM `test` LIKE 'sbtest3'\G

#    SHOW CREATE TABLE `test`.`sbtest3`\G

update sbtest3 set c=substring(MD5(RAND()), -16), pad=substring(MD5(RAND()), -16) where 1\G

# Converted for EXPLAIN

# EXPLAIN /*!50100 PARTITIONS*/

select  c=substring(MD5(RAND()), -16), pad=substring(MD5(RAND()), -16) from sbtest3 where  1\G


# Query 2: 0.00 QPS, 0.01x concurrency, ID 0xDEF289292EA9B2602DC12F70C7A041A9 at byte 3775

# Scores: V/M = 6.34

# Time range: 2019-12-12T12:41:47 to 2019-12-12T15:25:14

# Attribute    pct total min     max avg 95% stddev  median

# ============ === ======= ======= ======= ======= ======= ======= =======

# Count         12 3

# Exec time     21 74s 6s     36s 25s 35s 13s     30s

# Lock time      0 13ms 1ms     8ms 4ms 8ms   3ms 3ms

# Rows sent      0 0 0       0 0 0 0       0

# Rows examine   0 0 0       0 0 0 0       0

# Rows affecte   0 0 0       0 0 0 0       0

# Bytes sent     0 144 44      50 48 49.17   3 49.17

# Query size     8 99 33      33 33 33   0 33

# String:

# Databases    test

# Hosts        localhost

# Last errno   0 (2/66%), 1317 (1/33%)

# Users        root

# Query_time distribution

#   1us

#  10us

# 100us

#   1ms

#  10ms

# 100ms

#    1s ################################

#  10s+  ################################################################

# Tables

#    SHOW TABLE STATUS FROM `test` LIKE 'sbtest3'\G

#    SHOW CREATE TABLE `test`.`sbtest3`\G

ALTER TABLE sbtest3 ENGINE=INNODB\G

Using performance_schema

Slow query logs might be an issue if you don't have direct access to the file such as using RDS or using fully-managed database services such Google Cloud SQL or Azure SQL. Although it might need you some variables to enable these features, it comes handy when querying for queries logged into your system. You can order it by using a standard SQL statement in order to retrieve a partial result. For example,

mysql> SELECT SCHEMA_NAME, DIGEST, DIGEST_TEXT, COUNT_STAR, SUM_TIMER_WAIT/1000000000000 SUM_TIMER_WAIT_SEC, MIN_TIMER_WAIT/1000000000000 MIN_TIMER_WAIT_SEC, AVG_TIMER_WAIT/1000000000000 AVG_TIMER_WAIT_SEC, MAX_TIMER_WAIT/1000000000000 MAX_TIMER_WAIT_SEC, SUM_LOCK_TIME/1000000000000 SUM_LOCK_TIME_SEC, FIRST_SEEN, LAST_SEEN FROM events_statements_summary_by_digest;

+--------------------+----------------------------------+-----------------------------------------------------------------------------------------------------------------------------------------------------------------------------------------------------------------------------------------------------------------------------------------------------------------------------------------------------------------+------------+--------------------+--------------------+--------------------+--------------------+-------------------+---------------------+---------------------+

| SCHEMA_NAME        | DIGEST               | DIGEST_TEXT                                                                                                                                                                                                                                                                                                                               | COUNT_STAR | SUM_TIMER_WAIT_SEC | MIN_TIMER_WAIT_SEC | AVG_TIMER_WAIT_SEC | MAX_TIMER_WAIT_SEC | SUM_LOCK_TIME_SEC | FIRST_SEEN | LAST_SEEN |

+--------------------+----------------------------------+-----------------------------------------------------------------------------------------------------------------------------------------------------------------------------------------------------------------------------------------------------------------------------------------------------------------------------------------------------------------+------------+--------------------+--------------------+--------------------+--------------------+-------------------+---------------------+---------------------+

| NULL               | 390669f3d1f72317dab6deb40322d119 | SELECT @@`skip_networking` , @@`skip_name_resolve` , @@`have_ssl` = ? , @@`ssl_key` , @@`ssl_ca` , @@`ssl_capath` , @@`ssl_cert` , @@`ssl_cipher` , @@`ssl_crl` , @@`ssl_crlpath` , @@`tls_version`                                                                                                                                                             | 1 | 0.0373 | 0.0373 | 0.0373 | 0.0373 | 0.0000 | 2020-02-03 20:22:54 | 2020-02-03 20:22:54 |

| NULL               | fba95d44e3d0a9802dd534c782314352 | SELECT `UNIX_TIMESTAMP` ( )                                                                                                                                                                                                                                                                                                                                     | 2 | 0.0002 | 0.0001 | 0.0001 | 0.0001 | 0.0000 | 2020-02-03 20:22:57 | 2020-02-03 20:23:00 |

| NULL               | 18c649da485456d6cdf12e4e6b0350e9 | SELECT @@GLOBAL . `SERVER_ID`                                                                                                                                                                                                                                                                                                                                   | 2 | 0.0001 | 0.0001 | 0.0001 | 0.0001 | 0.0000 | 2020-02-03 20:22:57 | 2020-02-03 20:23:00 |

| NULL               | dd356b8a5a6ed0d7aee2abd939cdb6c9 | SET @? = ?                                                                                                                                                                                                                                                                                                                                                      | 6 | 0.0003 | 0.0000 | 0.0001 | 0.0001 | 0.0000 | 2020-02-03 20:22:57 | 2020-02-03 20:23:00 |

| NULL               | 1c5ae643e930af6d069845d74729760d | SET @? = @@GLOBAL . `binlog_checksum`                                                                                                                                                                                                                                                                                                                           | 2 | 0.0001 | 0.0001 | 0.0001 | 0.0001 | 0.0000 | 2020-02-03 20:22:57 | 2020-02-03 20:23:00 |

| NULL               | ad5208ffa004a6ad7e26011b73cbfb4c | SELECT @?                                                                                                                                                                                                                                                                                                                                                       | 2 | 0.0001 | 0.0000 | 0.0000 | 0.0001 | 0.0000 | 2020-02-03 20:22:57 | 2020-02-03 20:23:00 |

| NULL               | ed0d1eb982c106d4231b816539652907 | SELECT @@GLOBAL . `GTID_MODE`                                                                                                                                                                                                                                                                                                                                   | 2 | 0.0001 | 0.0000 | 0.0000 | 0.0001 | 0.0000 | 2020-02-03 20:22:57 | 2020-02-03 20:23:00 |

| NULL               | cb47e22372fdd4441486b02c133fb94f | SELECT @@GLOBAL . `SERVER_UUID`                                                                                                                                                                                                                                                                                                                                 | 2 | 0.0001 | 0.0000 | 0.0000 | 0.0001 | 0.0000 | 2020-02-03 20:22:57 | 2020-02-03 20:23:00 |

| NULL               | 73301368c301db5d2e3db5626a21b647 | SELECT @@GLOBAL . `rpl_semi_sync_master_enabled`                                                                                                                                                                                                                                                                                                                | 2 | 0.0001 | 0.0000 | 0.0000 | 0.0000 | 0.0000 | 2020-02-03 20:22:57 | 2020-02-03 20:23:00 |

| NULL               | 0ff7375c5f076ba5c040e78a9250a659 | SELECT @@`version_comment` LIMIT ?                                                                                                                                                                                                                                                                                                                              | 1 | 0.0001 | 0.0001 | 0.0001 | 0.0001 | 0.0000 | 2020-02-03 20:45:59 | 2020-02-03 20:45:59 |

| NULL               | 5820f411e67a393f987c6be5d81a011d | SHOW TABLES FROM `performance_schema`                                                                                                                                                                                                                                                                                                                           | 1 | 0.0008 | 0.0008 | 0.0008 | 0.0008 | 0.0002 | 2020-02-03 20:46:11 | 2020-02-03 20:46:11 |

| NULL               | a022a0ab966c51eb820da1521349c7ef | SELECT SCHEMA ( )                                                                                                                                                                                                                                                                                                                                               | 1 | 0.0005 | 0.0005 | 0.0005 | 0.0005 | 0.0000 | 2020-02-03 20:46:29 | 2020-02-03 20:46:29 |

| performance_schema | e4833a7c1365b0b4492e9a514f7b3bd4 | SHOW SCHEMAS                                                                                                                                                                                                                                                                                                                                                    | 1 | 0.1167 | 0.1167 | 0.1167 | 0.1167 | 0.0001 | 2020-02-03 20:46:29 | 2020-02-03 20:46:29 |

| performance_schema | 1107f048fe6d970cb6a553bd4727a1b4 | SHOW TABLES                                                                                                                                                                                                                                                                                                                                                     | 1 | 0.0002 | 0.0002 | 0.0002 | 0.0002 | 0.0000 | 2020-02-03 20:46:29 | 2020-02-03 20:46:29 |

...

You can use the table performance_schema.events_statements_summary_by_digest. Although there are chances that the entries on the tables from performance_schema will be flush, you can decide to save this in a specific table. Take a look at this external post from Percona MySQL query digest with Performance Schema

In case you're wondering why we need to divide the wait time columns (SUM_TIMER_WAIT, MIN_TIMER_WAIT_SEC, AVG_TIMER_WAIT_SEC), these columns are using picoseconds so you might need to do some math or some round ups to make it more readable to you.

Analyzing Slow Queries Using ClusterControl

If you are using ClusterControl, there are different ways to deal with this. For example, in a MariaDB Cluster I have below, it shows you the following tab (Query Monitor) and it's drop-down items (Top Queries, Running Queries, Query Outliers):

  • Top Queries -   aggregated list of all your top queries running on all the nodes of your database cluster
  • Running Queries - View current running queries on your database cluster similar to SHOW FULL PROCESSLIST command in MySQL
  • Query Outliers - Shows queries that are outliers. An outlier is a query taking longer time than the normal query of that type.

On top of that, ClusterControl also captures query performance using graphs which provides you a quick overlook of how your database system performs in relation to query performance. See below,

Wait, it's not over yet. ClusterControl also offers a high resolution metric using Prometheus and showcases very detailed metrics and captures real-time statistics from the server. We have discussed this in our previous blogs which are divided into two part series of blog. Check out part 1 and then the part 2 blogs. It offers you on how to efficiently monitor not only the slow queries but the overall performance of your MySQL, MariaDB, or Percona database servers. 

There are also other tools in ClusterControl which provide pointers and hints that can cause slow query performance even if it's not yet occurred or captured by the slow query log. Check out the Performance Tab as seen below,

these items provides you the following:

  • Overview - You can view graphs of different database counters on this page
  • Advisors - Lists of scheduled advisors’ results created in ClusterControl > Manage > Developer Studio using ClusterControl DSL.
  • DB Status - DB Status provides a quick overview of MySQL status across all your database nodes, similar to SHOW STATUS statement
  • DB Variables - DB Variables provide a quick overview of MySQL variables that are set across all your database nodes, similar to SHOW GLOBAL VARIABLES statement
  • DB Growth - Provides a summary of your database and table growth on daily basis for the last 30 days. 
  • InnoDB Status - Fetches the current InnoDB monitor output for selected host, similar to SHOW ENGINE INNODB STATUS command.
  • Schema Analyzer - Analyzes your database schemas for missing primary keys, redundant indexes and tables using the MyISAM storage engine. 
  • Transaction Log - Lists out long-running transactions and deadlocks across database cluster where you can easily view what transactions are causing the deadlocks. The default query time threshold is 30 seconds.

Conclusion

Tracing your MySQL Performance issue is not really difficult with MySQL. There are various external tools that provide you the efficiency and capabilities that you are looking for. The most important thing is that, it's easy to use and you are able to provide productivity at work. Fix the most outstanding issues or even avoid a certain disaster before it can happen.

How to Protect your MySQL or MariaDB Database From SQL Injection: Part One

$
0
0

Security is one of the most important elements of the properly designed database environment. There are numerous attack vectors used with SQL injection being probably the most popular one. You can design layers of defence in the application code but what can you do on the database layer? Today we would like to show you how easily you can implement SQL firewall on top of MySQL using ProxySQL. In the second part of this blog we will explain how you can create a whitelist of queries that are allowed to access the database.

First, we want to deploy ProxySQL. The easiest way to do it is to use ClusterControl. With a couple of clicks you can deploy it to your cluster.

Deploy ProxySQL to Database Cluster

Define where to deploy it, you can either pick existing host in the cluster or just write down any IP or hostname. Set credentials for administrative and monitoring users.

Then you can create a new user in the database to be used with ProxySQL or you can import one of the existing ones. You also need to define the database nodes you want to include in the ProxySQL. Answer if you use implicit transactions or not and you are all set to deploy ProxySQL. In a couple of minutes a ProxySQL with configuration prepared based on your input is ready to use.

Given our issue is security, we want to be able to tell ProxySQL how to handle inappropriate queries. Let’s take a look at the query rules, the core mechanism that governs how ProxySQL handles the traffic that passes through it. The list of query rules may look like this:

They are being applied from the lowest ID onwards.

Let’s try to create a query rule which will allow only SELECT queries for a particular user:

We are adding a query rule at the beginning of the rules list. We are going to match anything that is not SELECTs (please note Negate Match Pattern is enabled). The query rule will be used only when the username is ‘devuser’. If all the conditions are matched, the user will see the error as in the “Error Msg” field.

root@vagrant:~# mysql -u devuser -h 10.0.0.144 -P6033 -ppass

mysql: [Warning] Using a password on the command line interface can be insecure.

Welcome to the MySQL monitor.  Commands end with ; or \g.

Your MySQL connection id is 3024

Server version: 5.5.30 (ProxySQL)


Copyright (c) 2009-2019 Percona LLC and/or its affiliates

Copyright (c) 2000, 2019, Oracle and/or its affiliates. All rights reserved.


Oracle is a registered trademark of Oracle Corporation and/or its

affiliates. Other names may be trademarks of their respective

owners.


Type 'help;' or '\h' for help. Type '\c' to clear the current input statement.


mysql> create schema myschema;

ERROR 1148 (42000): The query is not allowed

mysql> SELECT 1;

+---+

| 1 |

+---+

| 1 |

+---+

1 row in set (0.01 sec)


mysql> SELECT * FROM sbtest.sbtest1 LIMIT 1\G

*************************** 1. row ***************************

 id: 1

  k: 503019

  c: 18034632456-32298647298-82351096178-60420120042-90070228681-93395382793-96740777141-18710455882-88896678134-41810932745

pad: 43683718329-48150560094-43449649167-51455516141-06448225399

1 row in set (0.00 sec)

Another example, this time we will try to prevent accidents related to the Bobby Tables situation.

With this query rule in place, your ‘students’ table won’t be dropped by Bobby:

mysql> use school;

Reading table information for completion of table and column names

You can turn off this feature to get a quicker startup with -A


Database changed

mysql> INSERT INTO students VALUES (1, 'Robert');DROP TABLE students;--

Query OK, 1 row affected (0.01 sec)


ERROR 1148 (42000): Only superuser can execute DROP TABLE;

As you can see, Bobby was not able to remove our ‘students’ table. He was only nicely inserted into the table.


How Do I Know if My PostgreSQL Backup is Good?

$
0
0

Backups are a must in all Disaster Recovery Plan. It might not always be enough to guarantee an acceptable Recovery Point Objective, but is a good first approach. The problem is what happens if, in case of failure, you need to use this backup, and it’s not usable for some reason? Probably you don’t want to be in that situation, so, in this blog, we’ll see how to confirm if your backup is good to use.

Types of PostgreSQL Backups

Let’s start talking about the different types of backups. There are different types, but in general, we can separate it in two simple categories:

  • Logical: The backup is stored in a human-readable format like SQL.
  • Physical: The backup contains binary data.

Why are we mentioning this? Because we’ll see that there are some checks we can do for one type and not for the other one.

Checking the Backup Logs

The first way to confirm if everything goes fine is by checking the backup logs.

The simplest command to run a PostgreSQL backup could be for example:

$ pg_dumpall > /path/to/dump.sql

But, how can I know if there was an error when the command was running? You can just add to send the output to some specific log file:

$ pg_dumpall > /path/to/dump.sql > /var/log/postgres/pg_dump.log

So, you can add this line in the server cron to run it every day:

30 0 * * * pg_dumpall > /path/to/dump.sql > /var/log/postgres/pg_dump.log

And you should monitor the log file to look for errors, for example, adding it into some monitoring tool like Nagios.

Checking logs is not enough to confirm that the backup will work, because for example, if the backup file is corrupted for some reason, you probably won’t see that in the log file.

Checking the Backup Content

If you are using logical backups, you can verify the content of the backup file, to confirm you have all databases there.

You can list your current PostgreSQL databases using, for example, this command:

$ psql -l | awk '{ print $1 }'| awk 'FNR > 3' |grep '^[a-zA-Z0-9]' |grep -v 'template0'

postgres

template1

world

And check which databases you have in the backup file:

$ grep '^[\]connect' /path/to/dump.sql |awk '{print $2}'

template1

postgres

world

The problem with this check is you don’t check the size or data, so it could be possible that you have some data loss if there was some error when the backup was executed.

Restoring to Check the Backup Manually

The most secure way to confirm if a backup is working is restoring it and access the database.

After the backup is completed, you can restore it manually in another host by copying the dump file and running for example:

$ psql -f /path/to/dump.sql postgres

Then, you can access it and check the databases:

$ psql

postgres=# \l

                                  List of databases

   Name    | Owner   | Encoding |   Collate | Ctype    | Access privileges

-----------+----------+----------+-------------+-------------+-----------------------

 postgres  | postgres | UTF8     | en_US.utf-8 | en_US.utf-8 |

 template0 | postgres | UTF8     | en_US.utf-8 | en_US.utf-8 | =c/postgres          +

           |          | |             | | postgres=CTc/postgres

 template1 | postgres | UTF8     | en_US.utf-8 | en_US.utf-8 | =c/postgres          +

           |          | |             | | postgres=CTc/postgres

 world     | postgres | UTF8     | en_US.utf-8 | en_US.utf-8 |

(4 rows)

The problem with this method is, of course, you should run it manually, or find a way to automate this, which could be a time-consuming task.

Automatic ClusterControl Backup Verification

Now, let’s see how ClusterControl can automate the verification of PostgreSQL backups and help avoid any surprises or manual tasks.

In ClusterControl, select your cluster and go to the "Backup" section, then, select “Create Backup”.

The automatic verify backup feature is available for the scheduled backups. So, let’s choose the “Schedule Backup” option.

When scheduling a backup, in addition to selecting the common options like method or storage, you also need to specify schedule/frequency.

In the next step, you can compress and encrypt your backup and specify the retention period. Here, you also have the “Verify Backup” feature.

To use this feature, you need a dedicated host (or VM) that is not part of the cluster.

ClusterControl will install the software and it’ll restore the backup in this host. After restoring, you can see the verification icon in the ClusterControl Backup section.

Conclusion

As we mentioned, backups are mandatory in any environment, but backup is not a backup if you can’t use it. So, you should make sure that your backup is useful in case you need it one day. In this blog, we showed different ways to check your backup to avoid problems when you want to restore it.


What to Look for if Your MySQL Replication is Lagging

$
0
0

A master/slave replication cluster setup is a common use case in most organizations. Using MySQL Replication enables your data to be replicated across different environments and guarantees that the information gets copied. It is asynchronous and single-threaded (by default), but replication also allows you to configure it to be synchronous (or actually “semi-synchronous”) and can run slave thread to multiple threads or in parallels.

This idea is very common and usually arrives with a simple setup, making its slave serving as its recovery or for backup solutions. However, this always comes to a price especially when bad queries (such as lack of primary or unique keys) are replicated or some trouble with the hardware (such as network or disk IO issues). When these issues occur, the most common problem to face is the replication lag. 

A replication lag is the cost of delay for transaction(s) or operation(s) calculated by its time difference of execution between the primary/master against the standby/slave node. The most certain cases in MySQL relies on bad queries being replicated such as lack of primary keys or bad indexes, a poor network hardware or malfunctioning network card, a distant location between different regions or zones, or some processes such as physical backups running can cause your MySQL database to delay applying the current replicated transaction. This is a very common case when diagnosing these issues. In this blog, we'll check how to deal with these cases and what to look if you are experiencing MySQL replication lag.

The "SHOW SLAVE STATUS": The MySQL DBA's Mantra

In some cases, this is the silver bullet when dealing with replication lag and it reveals mostly everything the cause of an issue in your MySQL database. Simply run this SQL statement in your slave node that is suspected experiencing a replication lag. 

The initial fields that are common to trace for problems are,

  • Slave_IO_State - It tells you what the thread is doing. This field will provide you good insights if the replication health is running normally, facing network problems such as reconnecting to a master, or taking too much time to commit data which can indicate disk problems when syncing data to disk. You can also determine this state value when running SHOW PROCESSLIST.
  • Master_Log_File-  Master's binlog file name where the I/O thread is currently fetch.
  • Read_Master_Log_Pos- binlog file position from the master where the replication I/O thread has already read.
  • Relay_Log_File - the relay log filename for which the SQL thread is currently executing the events
  • Relay_Log_Pos - binlog position from the file specified in Relay_Log_File for which SQL thread has already executed.
  • Relay_Master_Log_File- The master's binlog file that the SQL thread has already executed and is a congruent to  Read_Master_Log_Pos value.
  • Seconds_Behind_Master -  this field shows an approximation for difference between the current timestamp on the slave against the timestamp on the master for the event currently being processed on the slave. However, this field might not be able to tell you the exact lag if the network is slow because the difference in seconds are taken between the slave SQL thread and the slave I/O thread. So there can be cases that it can be caught up with slow-reading slave I/O thread, but i master it's already different.
  • Slave_SQL_Running_State - state of the SQL thread and the value is identical to the state value displayed in SHOW PROCESSLIST.
  • Retrieved_Gtid_Set - Available when using GTID replication. This is the set of GTID's corresponding to all transactions received by this slave. 
  • Executed_Gtid_Set - Available when using GTID replication. It's the set of GTID's written in the binary log.

For example, let's take the example below which uses a GTID replication and is experiencing a replication lag:

mysql> show slave status\G

*************************** 1. row ***************************

               Slave_IO_State: Waiting for master to send event

                  Master_Host: 192.168.10.70

                  Master_User: cmon_replication

                  Master_Port: 3306

                Connect_Retry: 10

              Master_Log_File: binlog.000038

          Read_Master_Log_Pos: 826608419

               Relay_Log_File: relay-bin.000004

                Relay_Log_Pos: 468413927

        Relay_Master_Log_File: binlog.000038

             Slave_IO_Running: Yes

            Slave_SQL_Running: Yes

              Replicate_Do_DB: 

          Replicate_Ignore_DB: 

           Replicate_Do_Table: 

       Replicate_Ignore_Table: 

      Replicate_Wild_Do_Table: 

  Replicate_Wild_Ignore_Table: 

                   Last_Errno: 0

                   Last_Error: 

                 Skip_Counter: 0

          Exec_Master_Log_Pos: 826608206

              Relay_Log_Space: 826607743

              Until_Condition: None

               Until_Log_File: 

                Until_Log_Pos: 0

           Master_SSL_Allowed: No

           Master_SSL_CA_File: 

           Master_SSL_CA_Path: 

              Master_SSL_Cert: 

            Master_SSL_Cipher: 

               Master_SSL_Key: 

        Seconds_Behind_Master: 251

Master_SSL_Verify_Server_Cert: No

                Last_IO_Errno: 0

                Last_IO_Error: 

               Last_SQL_Errno: 0

               Last_SQL_Error: 

  Replicate_Ignore_Server_Ids: 

             Master_Server_Id: 45003

                  Master_UUID: 36272880-a7b0-11e9-9ca6-525400cae48b

             Master_Info_File: mysql.slave_master_info

                    SQL_Delay: 0

          SQL_Remaining_Delay: NULL

      Slave_SQL_Running_State: copy to tmp table

           Master_Retry_Count: 86400

                  Master_Bind: 

      Last_IO_Error_Timestamp: 

     Last_SQL_Error_Timestamp: 

               Master_SSL_Crl: 

           Master_SSL_Crlpath: 

           Retrieved_Gtid_Set: 36272880-a7b0-11e9-9ca6-525400cae48b:7631-9192

            Executed_Gtid_Set: 36272880-a7b0-11e9-9ca6-525400cae48b:1-9191,

864dd532-a7af-11e9-85f2-525400cae48b:1-173,

df68c807-a7af-11e9-9b56-525400cae48b:1-4

                Auto_Position: 1

         Replicate_Rewrite_DB: 

                 Channel_Name: 

           Master_TLS_Version: 

1 row in set (0.00 sec)

Diagnosing issues like this, mysqlbinlog can also be your tool to identify what query has been running on a specific binlog x & y position. To determine this, let's take the Retrieved_Gtid_Set, Relay_Log_Pos, and the Relay_Log_File. See the command below:

[root@testnode5 mysql]# mysqlbinlog --base64-output=DECODE-ROWS --include-gtids="36272880-a7b0-11e9-9ca6-525400cae48b:9192" --start-position=468413927 -vvv relay-bin.000004

/*!50530 SET @@SESSION.PSEUDO_SLAVE_MODE=1*/;

/*!50003 SET @OLD_COMPLETION_TYPE=@@COMPLETION_TYPE,COMPLETION_TYPE=0*/;

DELIMITER /*!*/;

# at 468413927

#200206  4:36:14 server id 45003  end_log_pos 826608271 CRC32 0xc702eb4c        GTID last_committed=1562 sequence_number=1563    rbr_only=no

SET @@SESSION.GTID_NEXT= '36272880-a7b0-11e9-9ca6-525400cae48b:9192'/*!*/;

# at 468413992

#200206  4:36:14 server id 45003  end_log_pos 826608419 CRC32 0xe041ec2c        Query thread_id=24 exec_time=31 error_code=0

use `jbmrcd_date`/*!*/;

SET TIMESTAMP=1580963774/*!*/;

SET @@session.pseudo_thread_id=24/*!*/;

SET @@session.foreign_key_checks=1, @@session.sql_auto_is_null=0, @@session.unique_checks=1, @@session.autocommit=1/*!*/;

SET @@session.sql_mode=1436549152/*!*/;

SET @@session.auto_increment_increment=1, @@session.auto_increment_offset=1/*!*/;

/*!\C utf8 *//*!*/;

SET @@session.character_set_client=33,@@session.collation_connection=33,@@session.collation_server=8/*!*/;

SET @@session.lc_time_names=0/*!*/;

SET @@session.collation_database=DEFAULT/*!*/;

ALTER TABLE NewAddressCode ADD INDEX PostalCode(PostalCode)

/*!*/;

SET @@SESSION.GTID_NEXT= 'AUTOMATIC' /* added by mysqlbinlog */ /*!*/;

DELIMITER ;

# End of log file

/*!50003 SET COMPLETION_TYPE=@OLD_COMPLETION_TYPE*/;

/*!50530 SET @@SESSION.PSEUDO_SLAVE_MODE=0*/;

It tells us that it was trying to replicate and execute a DML statement which tries to be the source of the lag. This table is a huge table containing 13M of rows. 

Check SHOW PROCESSLIST, SHOW ENGINE INNODB STATUS, with ps, top, iostat command combination

In some cases, SHOW SLAVE STATUS is not enough to tell us the culprit. It's possible that the replicated statements are affected by internal processes running in the MySQL database slave. Running the statements SHOW [FULL] PROCESSLIST and SHOW ENGINE INNODB STATUS also provides informative data that gives you insights about the source of the problem. 

For example, let's say a benchmarking tool is running causing to saturate the disk IO and CPU. You can check by running both SQL statements. Combine it with ps and top commands. 

You can also determine bottlenecks with your disk storage by running iostat which provides statistics of the current volume you are trying to diagnose. Running iostat can show how busy or loaded your server is. For example, taken by a slave which is lagging but also experiencing high IO utilization at the same time, 

[root@testnode5 ~]# iostat -d -x 10 10

Linux 3.10.0-693.5.2.el7.x86_64 (testnode5)     02/06/2020 _x86_64_ (2 CPU)


Device:         rrqm/s wrqm/s     r/s w/s rkB/s    wkB/s avgrq-sz avgqu-sz   await r_await w_await svctm  %util

sda               0.00 0.42 3.71   60.65 218.92 568.39   24.47 0.15 2.31 13.79    1.61 0.12 0.76

dm-0              0.00 0.00 3.70   60.48 218.73 568.33   24.53 0.15 2.36 13.85    1.66 0.12 0.76

dm-1              0.00 0.00 0.00    0.00 0.04 0.01 21.92     0.00 63.29 2.37 96.59 22.64   0.01


Device:         rrqm/s wrqm/s     r/s w/s rkB/s    wkB/s avgrq-sz avgqu-sz   await r_await w_await svctm  %util

sda               0.00 0.20 392.30 7983.60  2135.60 49801.55 12.40 36.70    3.84 13.01 3.39 0.08 69.02

dm-0              0.00 0.00 392.30 7950.20  2135.60 50655.15 12.66 36.93    3.87 13.05 3.42 0.08 69.34

dm-1              0.00 0.00 0.00    0.30 0.00 1.20   8.00 0.06 183.67 0.00  183.67 61.67 1.85


Device:         rrqm/s wrqm/s     r/s w/s rkB/s    wkB/s avgrq-sz avgqu-sz   await r_await w_await svctm  %util

sda               0.00 1.40 370.93 6775.42  2557.04 46184.22 13.64 43.43    6.12 11.60 5.82 0.10 73.25

dm-0              0.00 0.00 370.93 6738.76  2557.04 47029.62 13.95 43.77    6.20 11.64 5.90 0.10 73.41

dm-1              0.00 0.00 0.00    0.30 0.00 1.20   8.00 0.03 107.00 0.00  107.00 35.67 1.07


Device:         rrqm/s wrqm/s     r/s w/s rkB/s    wkB/s avgrq-sz avgqu-sz   await r_await w_await svctm  %util

sda               0.00 0.00 299.80 7253.35  1916.88 52766.38 14.48 30.44    4.59 15.62 4.14 0.10 72.09

dm-0              0.00 0.00 299.80 7198.60  1916.88 51064.24 14.13 30.68    4.66 15.70 4.20 0.10 72.57

dm-1              0.00 0.00 0.00    0.00 0.00 0.00   0.00 0.00 0.00 0.00    0.00 0.00 0.00


Device:         rrqm/s wrqm/s     r/s w/s rkB/s    wkB/s avgrq-sz avgqu-sz   await r_await w_await svctm  %util

sda               0.00 0.10 215.50 8939.60  1027.60 67497.10 14.97 59.65    6.52 27.98 6.00 0.08 72.50

dm-0              0.00 0.00 215.50 8889.20  1027.60 67495.90 15.05 60.07    6.60 28.09 6.08 0.08 72.75

dm-1              0.00 0.00 0.00    0.30 0.00 1.20   8.00 0.01 32.33 0.00   32.33 30.33 0.91


Device:         rrqm/s wrqm/s     r/s w/s rkB/s    wkB/s avgrq-sz avgqu-sz   await r_await w_await svctm  %util

sda               0.00 0.90 140.40 8922.10   625.20 54709.80 12.21 11.29    1.25 9.88 1.11 0.08 68.60

dm-0              0.00 0.00 140.40 8871.50   625.20 54708.60 12.28 11.39    1.26 9.92 1.13 0.08 68.83

dm-1              0.00 0.00 0.00    0.30 0.00 1.20   8.00 0.01 27.33 0.00   27.33 9.33 0.28


Device:         rrqm/s wrqm/s     r/s w/s rkB/s    wkB/s avgrq-sz avgqu-sz   await r_await w_await svctm  %util

sda               0.00 1.70 284.50 8621.30 24228.40 51535.75    17.01 34.14 3.27 8.19 3.11 0.08 72.78

dm-0              0.00 0.00 290.90 8587.10 25047.60 53434.95    17.68 34.28 3.29 8.02 3.13 0.08 73.47

dm-1              0.00 0.00 0.00    2.00 0.00 8.00   8.00 0.83 416.45 0.00  416.45 63.60 12.72


Device:         rrqm/s wrqm/s     r/s w/s rkB/s    wkB/s avgrq-sz avgqu-sz   await r_await w_await svctm  %util

sda               0.00 0.30 851.60 11018.80 17723.60 85165.90    17.34 142.59 12.44 7.61 12.81 0.08 99.75

dm-0              0.00 0.00 845.20 10938.90 16904.40 83258.70    17.00 143.44 12.61 7.67 12.99 0.08 99.75

dm-1              0.00 0.00 0.00    0.00 0.00 0.00   0.00 0.00 0.00 0.00    0.00 0.00 0.00


Device:         rrqm/s wrqm/s     r/s w/s rkB/s    wkB/s avgrq-sz avgqu-sz   await r_await w_await svctm  %util

sda               0.00 1.10 24.60 12965.40   420.80 51114.45 7.93 39.44    3.04 0.33 3.04 0.07 93.39

dm-0              0.00 0.00 24.60 12890.20   420.80 51114.45 7.98 40.23    3.12 0.33 3.12 0.07 93.35

dm-1              0.00 0.00 0.00    0.00 0.00 0.00   0.00 0.00 0.00 0.00    0.00 0.00 0.00


Device:         rrqm/s wrqm/s     r/s w/s rkB/s    wkB/s avgrq-sz avgqu-sz   await r_await w_await svctm  %util

sda               0.00 0.00 3.60 13420.70    57.60 51942.00 7.75 0.95   0.07 0.33 0.07 0.07 92.11

dm-0              0.00 0.00 3.60 13341.10    57.60 51942.00 7.79 0.95   0.07 0.33 0.07 0.07 92.08

dm-1              0.00 0.00 0.00    0.00 0.00 0.00   0.00 0.00 0.00 0.00    0.00 0.00 0.00

The result above displays the high IO utilization and a high writes. It also reveals that the average queue size and average request size are moving which means it's an indication of a high workload. In these cases, you need to determine if there are external processes that cause MySQL to choke the replication threads.

How Can ClusterControl Help?

With ClusterControl, dealing with slave lag and determining the culprit is very easy and efficient. It directly tells you in the web UI, see below:

It reveals to you the current slave lag your slave nodes are experiencing. Not only that, with SCUMM dashboards, if enabled, provides you more insights of what your slave node's health or even the whole cluster is doing:

ClusterControl Replication Slave Dashboard
ClusterControl Cluster Overview Dashboard

Not only that these things are available in ClusterControl, it does provide you also the capability to avoid bad queries from occurring with these features as seen below,

The redundant indexes allows you to determine that these indexes can cause performance issues for incoming queries that references the duplicate indexes. It also tells you tables that have no Primary Keys which are usually a common problem of slave lag when a certain SQL query or transactions that references big tables without primary or unique keys when it's replicated to the slaves.

Conclusion

Dealing with MySQL Replication lag is a frequent problem in a master-slave replication setup. It can be easy to diagnose, but difficult to solve. Make sure you have your tables with primary key or unique key existing, and determine the steps and tools on how to troubleshoot and diagnose the cause of slave lag. Efficiency is always the key when solving problems though.

Steps to Take if You Have a MySQL Outage

$
0
0

A MySQL outage simply means your MySQL service is not accessible or unresponsive from the other's perspective. Outages can be originated by a bunch of possible causes..

  • Network issue - Connectivity issue, switch, routing, resolver, load-balancer tier.
  • Resource issue - Whether you have reached resources limit or bottleneck.
  • Misconfiguration - Wrong permission or ownership, unknown variable, wrong password, privilege changed.
  • Locking - Global or table lock prevent others from accessing the data.

In this blog post, we’ll look at some steps to take if you’re having a MySQL outage (Linux environment).

Step One: Get the Error Code

When you have an outage, your application will throw out some errors and exceptions. These errors commonly come with an error code, that will give you a rough idea on what you’re facing and what to do next to troubleshoot the issue and recover the outage. 

To get more details on the error, check the MySQL Error Code or MariaDB Error Code pages respectively to figure out what the error means.

Step Two: Is the MySQL Server Running?

Log into the server via terminal and see if MySQL daemon is running and listening to the correct port. In Linux, one would do the following:

Firstly, check the MySQL process:

$ ps -ef | grep -i mysql

You should get something in return. Otherwise, MySQL is not running. If MySQL is not running, try to start it up:

$ systemctl start mysql # systemd

$ service mysql start # sysvinit/upstart

$ mysqld_safe # manual

If you are seeing an error on the above step, you should go look at the MySQL error log, which varies depending on the operating system and MySQL variable configuration for log_error in MySQL configuration file. For RedHat-based server, the file is commonly located at:

$ cat /var/log/mysqld.log

Pay attention to the most recent lines with log level "[Error]". Some lines labelled with "[Warning]" could indicate some problems, but those are pretty uncommon. Most of the time, misconfiguration and resource issues can be detected from here.

If MySQL is running, check whether it's listening to the correct port:

$ netstat -tulpn | grep -i mysql

tcp6       0 0 :::3306                 :::* LISTEN   1089/mysqld

You would get the process name "mysqld", listening on all interfaces (:::3306 or 0.0.0.0:3306) on port 3306 with PID 1089 and the state is "LISTEN". If you see the above line shows 127.0.0.1:3306, MySQL is only listening locally. You might need to change the bind_address value in MySQL configuration file to listen to all IP addresses, or simply comment on the line. 

Step Three: Check for Connectivity Issues

If the MySQL server is running fine without error inside the MySQL error log, the chance that connectivity issues are happening is pretty high. Start by checking connectivity to the host via ping (if ICMP is enabled) and telnet to the MySQL server from the application server:

(application-server)$ ping db1.mydomain.com

(application-server)$ telnet db1.mydomain.com 3306

Trying db1.mydomain.com...

Connected to 192.168.0.16.

Escape character is '^]'.

O

5.6.46-86.2sN&nz9NZ�32?&>H,EV`_;mysql_native_password

You should see some lines in the telnet output if you can get connected to the MySQL port. Now, try once more by using MySQL client from the application server:

(application-server)$ mysql -u db_user -p -h db1.mydomain.com -P3306

ERROR 1045 (28000): Access denied for user 'db_user'@'db1.mydomain.com' (using password: YES)

In the above example, the error gives us a bit of information on what to do next. The above probably because someone has changed the password for "db_user" or the password for this user has expired. This is a rather normal behaviour from MySQL 5.7. 4 and above, where the automatic password expiration policy is enabled by default with a 360 days threshold - meaning that all passwords will expire once a year.

Step Four: Check the MySQL Processlist

If MySQL is running fine without connectivity issues, check the MySQL process list to see what processes are currently running:

mysql> SHOW FULL PROCESSLIST;

+-----+------+-----------+------+---------+------+-------+-----------------------+-----------+---------------+

| Id  | User | Host      | db | Command | Time | State | Info                  | Rows_sent | Rows_examined |

+-----+------+-----------+------+---------+------+-------+-----------------------+-----------+---------------+

| 117 | root | localhost | NULL | Query   | 0 | init | SHOW FULL PROCESSLIST |       0 | 0 |

+-----+------+-----------+------+---------+------+-------+-----------------------+-----------+---------------+

1 row in set (0.01 sec)

Pay attention to the Info and Time column. Some MySQL operations could be destructive enough to make the database stalls and become unresponsive. The following SQL statements, if running, could block others to access the database or table (which could bring a brief outage of MySQL service from the application perspective):

  • FLUSH TABLES WITH READ LOCK
  • LOCK TABLE ...
  • ALTER TABLE ...

Some long running transactions could also stall others, which eventually would cause timeouts to other transactions waiting to access the same resources. You may either kill the offensive transaction to let others access the same rows or retry the enqueue transactions after the long transaction finishes.

Conclusion

Proactive monitoring is really important to minimize the risk of MySQL outage. If your database is managed by ClusterControl, all the mentioned aspects are being monitored automatically without any additional configuration from the user. You shall receive alarms in your inbox for anomaly detections like long running queries, server misconfiguration, resource exceeding threshold and many more. Plus, ClusterControl will automatically attempt to recover your database service if something goes wrong with the host or network.

You can also learn more about MySQL & MariaDB Disaster Recovery by reading our whitepaper.


What's New in MongoDB 4.2

$
0
0

Database updates come with improved features for performance, security, and with new integrated features. It is always advisable to test a new version before deploying it into production, just to ensure that it suits your needs and there is no possibility of crashes. 

Considering many products, those preceding the first minor versions of a new major version have the most important fixes. For instance I would prefer to have MongoDB version 4.2.1 in production a few days after release than I would for version 4.2.0. 

In this blog we are going to discuss what has been included and what improvements have been made to MongoDB version 4.2

What’s New in MongoDB 4.2

  1. Distributed transactions
  2. Wildcard indexes
  3. Retrayable reads and writes
  4. Automatic Client-Side Field-level encryption.
  5. Improved query language for expressive updates
  6. On-demand materialized Views
  7. Modern maintenance operations

Distributed Transactions

Transactions are important database features that ensure data consistency and integrity especially those that guarantees the ACID procedures. MongoDB version 4.2  now supports multi-document transactions on replica sets and a sharded cluster through the distributed transaction approach. The same syntax for using transactions has been maintained as the previous 4.0 version.

However, the client driver specs have changed a bit hence if one intends to use transactions in MongoDB 4.2, you must  upgrade the drivers to versions that are compatible with 4.2 servers.

This version does not limit the size of a transaction in terms of memory usage but only dependent on the size of your hardware and the hardware handling capability.

Global cluster locale reassignment is now possible with version 4.2. This is to say, for a geo zone sharding implementation, if a user residing in region A moves to region B, by changing the value of their location field, the data can be automatically moved from region A to B through a transaction.

The sharding system now allows one to change a shard key contrary to the previous version. Literally, when a shard key is changed, it is an equivalent to moving the document to another shard. In this version, MongoDB wraps this update and if the document needs to be moved from one shard to another, the update will be executed inside a transaction in a background manner.

Using transactions is not an advisable approach since they degrade database performance especially if they occur multiple times. During a transaction period,  there is a stretched window for operations that may cause conflicts when making writes to a document that is affected. As much as a transaction can be retried, there might be an update made to the document before this retry, and whenever the retry happens, it may deal with the old rather than the latest document version. Retries obviously exert more processing cost besides increasing the application downtime through growing latency. 

A good practice around using transactions include:

  1. Avoid using unindexed queries inside a transaction as a way of ensuring the Op will not be slow.
  2. Your transaction should involve a few documents.

With the MongoDB dynamic schema format and embedding feature, you can opt to put all fields in the same collection to avoid the need to use transaction as a first measure.

Wildcard Indexes

Wildcard indexes were introduced in MongoDB version 4.2 to enhance queries against arbitrary fields or fields whose names are not known in advance, by indexing the entire document or subdocument.They are not intended to replace the workload based indexes but suit working with data involving polymorphic pattern. A polymorphic pattern is where all documents in a collection are similar but not having an identical structure. Polymorphic data patterns can be generated from application involving, product catalogs or social data. Below is an example of Polymorphic collection data

{

Sport: ‘Chess’,

playerName: ‘John Mah’,

Career_earning: {amount: NumberDecimal(“3000”), currency: “EUR”},

gamesPlayed:25,

career_titles:10

},

{

Sport: Tennis,

playerName: ‘Semenya Jones,

Career_earning: {amount: NumberDecimal(“34545”), currency: “USD”},

Event: {

name:”Olympics”,

career_titles:10,

career_tournaments:14

}

By indexing the entire document using Wildcard indexes, you can make a query using any arbitrary field as an index.

To create a Wildcard index

$db.collection.createIndex({“fieldA.$**”: 1})

If the selected field is a nested document or an array, the Wildcard index recurses into the document and stores the value for all the fields in the document or array.

Retryable Reads and Writes

Normally a database may incur some frequent network transient outages that may result in a query being partially or fully unexecuted. These network errors may not be that serious hence offer a chance for a retry of these queries once reconnected. Starting with MongoDB 4.2, the retry configuration is enabled by default. The MongoDB drivers can retry failed reads and writes for certain transactions whenever they encounter minor network errors or rather when they are unable to find some healthy primary in the sharded cluster/ replica set. However, if you don’t want the retryable writes, you can explicitly disable them in your configurations but I don’t find a compelling reason why one should disable them.

This feature is to ensure that in any case MongoDB infrastructure changes, the application code shouldn’t be affected. Regarding an example explained by Eliot Horowitz, the Co-founder of MongoDB, for a webpage that does 20 different database operations, instead of reloading the entire thing or having to wrap the entire web page in some sort of loop, the driver under the covers can just decide to retry the operation. Whenever a write fails, it will retry automatically and will have a contract with the server to guarantee that every write happens only once.

The retryable writes only makes a single retry attempt which helps to address replica set elections and  transient network errors but not for persistent network errors.

Retrayable writes do not address instances where the failover period exceeds serverSelectionTimoutMs value in the parameter configurations.

With this MongoDB version, one can update document shard key values (except if the shardkey is the immutable _id field) by issuing a single-document findAndModify/update operations either in a transaction or as a retryable write.

MongoDB version 4.2 can now retry a single-document upsert operation (i.e upsert: true and multi: false) which may have failed because of duplicate key error if the operation meets these key conditions:

  1. Target collection contains a unique index that made the duplicate key error.
  2. The update operation will not modify any of the fields in the query predicate.
  3. The update match condition is either a single equality predicate {field: “value”} or a logical AND of equality predicates {filed: “value”, field0: “value0”}
  4. Set of fields in the unique index key pattern matches the set of fields in the update query predicate.

Automatic Client-Side Field-level Encryption

MongoDB version 4.2 comes with the Automatic Client-Side Field Level encryption (CSFLE), a feature that allows  developers to selectively encrypt individual fields of a document on the client side before it is sent to the server. The encrypted data is thus kept private from the providers hosting the database and any user that may have direct access to the database.

Only applications with the access to the correct encryption keys can decrypt and read the protected data. In case the encryption key is deleted, all data that was encrypted will be rendered unreadable.

Note: this feature is only available with MongoDB enterprise only.

Improved query language for expressive updates

MongoDB version 4.2 provides a richer query language than its predecessors. It now supports aggregations and modern use-case operations along the lines of geo-based searches, graph search and text search. It has integrated a third-party search engine which makes searches faster considering that the search engine is running on a different process/server. This generally improves on database performance contrary to if all searches were made to the mongod process which would rather make the database operation latency volatile whenever the search engine reindexes.

With this version, you can now handle arrays, do sums and other maths operations directly through an update statement.

On-Demand Materialized Views

The data aggregation pipeline framework in MongoDB is a great feature with different stages of transforming a document to some desired state. The MongoDB version 4.2 introduces a new stage $merge which for me I will say it saved me some time working with the final output that needed to be stored in a collection. Initially, the $out stage allows creating a new collection based on aggregation and populates the collection with the results obtained. If the collection already exist, it would overwrite the collection with the new results contrary to the $merge stage which only incorporates the pipeline results into an existing output rather than fully replacing the collection. Regenerating an entire collection everytime with the $out stage consumes a lot of CPU and IO which may degrade the database performance. The output content will therefore be timely updated enabling users to create on-demand materialized views

Modern Maintenance Operations

Developers can now have a great operational experience with MongoDB version 4.2 with integrated features that enhance high availability, cloud managed backup strategy,  improve the monitoring power and alerting systems. MongoDB Atlas and MongoDB Ops Manager are the providing platforms for these features. The latter has been labeled as the best for running MongoDB on-enterprise. It has also been integrated with Kubernetes operator for on-premise users who are moving to private cloud. This interface enables one to directly control Ops Manager.

There are some internal changes made to MongoDB version 4.2 which include:

  1. Listing open cursors.
  2. Removal of the MMAPv1 storage engine.
  3. Improvement on the WiredTiger data file repair.
  4. Diagnostic fields can now have queryHash
  5. Auto-splitting thread for mongos nodes has been removed.

Conclusion

MongoDB version 4.2 comes with some improvements along the lines of security and database performance. It has included an Automatic Client-Side Field Level Encryption that ensures data is protected from the client angle. More features like a Third party search engine and inclusion of the $merge stage in the aggregation framework render some improvement in the database performance. Before putting this version in production, please ensure that all your needs are fully addressed.

Migrating PostgreSQL to the Cloud - Comparing Solutions from Amazon, Google & Microsoft

$
0
0

From a bird’s eye view, it would appear that when it comes to migrating the PostgreSQL workloads into the cloud, the choice of cloud provider should make no difference. Out of the box, PostgreSQL makes it easy to replicate data, with no downtime, via Logical Replication, although with some restrictions. In order to make their service offering more attractive cloud providers may work out some of those restrictions. As we start thinking about differences in the available PostgreSQL versions, compatibility, limits, limitations, and performance, it becomes clear that the migration services are key factors in the overall service offering. It isn’t any longer a case of “we offer it, we migrate it”. It’s become more like “we offer it, we migrate it, with the least limitations”.

Migration is important to small and large organizations alike. It is not as much about the size of the PostgreSQL cluster, as it is about the acceptable downtime and post-migration effort.

Selecting a Strategy

The migration strategy should take into consideration the size of the database, the network link between the source and the target, as well as the migration tools offered by the cloud provider.

Hardware or Software?

Just as mailing USB keys, and DVDs back in the early days of Internet, in cases where the network bandwidth isn’t enough for transferring data at the desired speed, cloud providers are offering hardware solutions, able to carry up to hundreds of petabytes of data. Below are the current solutions from each of the big three:

A handy table provided by Google showing the available options:

GCP migration options

GCP appliance is Transfer Appliance

A similar recommendation from Azure based on the data size vs network bandwidth:

Azure migration options

Azure appliance is Data box

Towards the end of its data migrations page, AWS provides a glimpse of what we can expect, along with their recommendation of the solution:

AWS migration choices: managed or unmanaged.

In cases where the database sizes exceed 100GB and limited network bandwidth AWS suggest a hardware solution.

AWS appliance is Snowball Edge

Data Export/Import

Organizations that tolerate downtime, can benefit from the simplicity of common tools provided by PostgreSQL out of the box. However, when migrating data from one cloud (or hosting) provider to another cloud provider, beware of the egress cost.

AWS

For testing the migrations I used a local installation of my Nextcloud database running on one of my home network servers:

postgres=# select pg_size_pretty(pg_database_size('nextcloud_prod'));

pg_size_pretty

----------------

58 MB

(1 row)


nextcloud_prod=# \dt

                     List of relations

Schema |             Name | Type  | Owner

--------+-------------------------------+-------+-----------

public | awsdms_ddl_audit              | table | s9sdemo

public | oc_accounts                   | table | nextcloud

public | oc_activity                   | table | nextcloud

public | oc_activity_mq                | table | nextcloud

public | oc_addressbookchanges         | table | nextcloud

public | oc_addressbooks               | table | nextcloud

public | oc_appconfig                  | table | nextcloud

public | oc_authtoken                  | table | nextcloud

public | oc_bruteforce_attempts        | table | nextcloud

public | oc_calendar_invitations       | table | nextcloud

public | oc_calendar_reminders         | table | nextcloud

public | oc_calendar_resources         | table | nextcloud

public | oc_calendar_resources_md      | table | nextcloud

public | oc_calendar_rooms             | table | nextcloud

public | oc_calendar_rooms_md          | table | nextcloud

...

public | oc_termsofservice_terms       | table | nextcloud

public | oc_text_documents             | table | nextcloud

public | oc_text_sessions              | table | nextcloud

public | oc_text_steps                 | table | nextcloud

public | oc_trusted_servers            | table | nextcloud

public | oc_twofactor_backupcodes      | table | nextcloud

public | oc_twofactor_providers        | table | nextcloud

public | oc_users                      | table | nextcloud

public | oc_vcategory                  | table | nextcloud

public | oc_vcategory_to_object        | table | nextcloud

public | oc_whats_new                  | table | nextcloud

(84 rows)

The database is running PostgreSQL version 11.5:

postgres=# select version();

                                                version

------------------------------------------------------------------------------------------------------------

PostgreSQL 11.5 on x86_64-redhat-linux-gnu, compiled by gcc (GCC) 9.1.1 20190503 (Red Hat 9.1.1-1), 64-bit

(1 row)

I have also created a PostgreSQL user to be used by AWS DMS which is Amazon’s service for importing PostgreSQL into Amazon RDS:

postgres=# \du s9sdemo

            List of roles

Role name | Attributes |  Member of

-----------+------------+-------------

s9sdemo   |   | {nextcloud}

AWS DMS provides many advantages, just as we’d expect from a managed solution in the cloud: 

  • auto-scaling (storage only, as compute instance must be right sized)
  •  automatic provisioning
  •  pay-as-you-go model
  •  automatic failover

However, maintaining data consistency for a live database is a best effort. A 100% consistency is achieved only when the database is in read-only mode — that is a consequence of how table changes are captured.

In other words, tables have a different point-in-time cutover:

AWS DMS: tables have different point in time cutover.

Just as with everything in the cloud, there is a cost associated with the migration service.

In order to create the migration environment, follow the Getting Started guide to setup a replication instance, a source, a target endpoint, and one or more tasks.

Replication Instance

Creating the replication instance is straightforward to anyone familiar with EC2 instances on AWS:

The only change from the defaults was in selecting AWS DMS 3.3.0 or later due to my local PostgreSQL engine being 11.5:

AWS DMS: Supported PostgreSQL versions.

And here’s the list of currently available AWS DMS versions:

Current AWS DMS versions.

Large installations should also take note of the AWS DMS Limits:

AWS DMS limits.

There is also a set of limitations that are a consequence of PostgreSQL logical replication restrictions. For example, AWS DMS will not migrate secondary objects:

AWS DMS: secondary objects are not migrated.

It is worth mentioning that in PostgreSQL all indexes are secondary indexes, and that is not a bad thing, as noted in this more detailed discussion.

Source Endpoint

Follow the wizard to create the Source Endpoint:

AWS DMS: Source Endpoint configuration.

In the setup scenario Configuration for a Network to a VPC Using the Internet my home network required a few tweaks in order to allow the source endpoint IP address to access my internal server. First, I created a port forwarding on the edge router (173.180.222.170) to sent traffic on port 30485 to my internal gateway (10.11.11.241) on port 5432 where I can fine tune access based on the source IP address via iptables rules. From there, network traffic flows through an SSH tunnel to the web server running the PostgreSQL database. With the described configuration the client_addr in the output of pg_stat_activity will show up as 127.0.0.1.

Before allowing incoming traffic, iptables logs show 12 attempts from replication instance at ip=3.227.167.58):

Jan 19 17:35:28 mha.can.local kernel: filter/INPUT: IN=enp0s29f7u2 OUT= MAC=00:24:9b:17:3a:fa:9c:1e:95:e5:ad:b0:08:00 SRC=3.227.167.58 DST=10.11.11.241 LEN=60 TOS=0x00 PREC=0x00 TTL=39 ID=23973 DF PROTO=TCP SPT=54662 DPT=5432 WINDOW=26880 RES=0x00 SYN URGP=0

Jan 19 17:35:29 mha.can.local kernel: filter/INPUT: IN=enp0s29f7u2 OUT= MAC=00:24:9b:17:3a:fa:9c:1e:95:e5:ad:b0:08:00 SRC=3.227.167.58 DST=10.11.11.241 LEN=60 TOS=0x00 PREC=0x00 TTL=39 ID=23974 DF PROTO=TCP SPT=54662 DPT=5432 WINDOW=26880 RES=0x00 SYN URGP=0

Jan 19 17:35:31 mha.can.local kernel: filter/INPUT: IN=enp0s29f7u2 OUT= MAC=00:24:9b:17:3a:fa:9c:1e:95:e5:ad:b0:08:00 SRC=3.227.167.58 DST=10.11.11.241 LEN=60 TOS=0x00 PREC=0x00 TTL=39 ID=23975 DF PROTO=TCP SPT=54662 DPT=5432 WINDOW=26880 RES=0x00 SYN URGP=0

Jan 19 17:35:35 mha.can.local kernel: filter/INPUT: IN=enp0s29f7u2 OUT= MAC=00:24:9b:17:3a:fa:9c:1e:95:e5:ad:b0:08:00 SRC=3.227.167.58 DST=10.11.11.241 LEN=60 TOS=0x00 PREC=0x00 TTL=39 ID=23976 DF PROTO=TCP SPT=54662 DPT=5432 WINDOW=26880 RES=0x00 SYN URGP=0

Jan 19 17:35:48 mha.can.local kernel: filter/INPUT: IN=enp0s29f7u2 OUT= MAC=00:24:9b:17:3a:fa:9c:1e:95:e5:ad:b0:08:00 SRC=3.227.167.58 DST=10.11.11.241 LEN=60 TOS=0x00 PREC=0x00 TTL=39 ID=4328 DF PROTO=TCP SPT=54667 DPT=5432 WINDOW=26880 RES=0x00 SYN URGP=0

Jan 19 17:35:49 mha.can.local kernel: filter/INPUT: IN=enp0s29f7u2 OUT= MAC=00:24:9b:17:3a:fa:9c:1e:95:e5:ad:b0:08:00 SRC=3.227.167.58 DST=10.11.11.241 LEN=60 TOS=0x00 PREC=0x00 TTL=39 ID=4329 DF PROTO=TCP SPT=54667 DPT=5432 WINDOW=26880 RES=0x00 SYN URGP=0

Jan 19 17:35:51 mha.can.local kernel: filter/INPUT: IN=enp0s29f7u2 OUT= MAC=00:24:9b:17:3a:fa:9c:1e:95:e5:ad:b0:08:00 SRC=3.227.167.58 DST=10.11.11.241 LEN=60 TOS=0x00 PREC=0x00 TTL=39 ID=4330 DF PROTO=TCP SPT=54667 DPT=5432 WINDOW=26880 RES=0x00 SYN URGP=0

Jan 19 17:35:55 mha.can.local kernel: filter/INPUT: IN=enp0s29f7u2 OUT= MAC=00:24:9b:17:3a:fa:9c:1e:95:e5:ad:b0:08:00 SRC=3.227.167.58 DST=10.11.11.241 LEN=60 TOS=0x00 PREC=0x00 TTL=39 ID=4331 DF PROTO=TCP SPT=54667 DPT=5432 WINDOW=26880 RES=0x00 SYN URGP=0

Jan 19 17:36:08 mha.can.local kernel: filter/INPUT: IN=enp0s29f7u2 OUT= MAC=00:24:9b:17:3a:fa:9c:1e:95:e5:ad:b0:08:00 SRC=3.227.167.58 DST=10.11.11.241 LEN=60 TOS=0x00 PREC=0x00 TTL=39 ID=8298 DF PROTO=TCP SPT=54670 DPT=5432 WINDOW=26880 RES=0x00 SYN URGP=0

Jan 19 17:36:09 mha.can.local kernel: filter/INPUT: IN=enp0s29f7u2 OUT= MAC=00:24:9b:17:3a:fa:9c:1e:95:e5:ad:b0:08:00 SRC=3.227.167.58 DST=10.11.11.241 LEN=60 TOS=0x00 PREC=0x00 TTL=39 ID=8299 DF PROTO=TCP SPT=54670 DPT=5432 WINDOW=26880 RES=0x00 SYN URGP=0

Jan 19 17:36:11 mha.can.local kernel: filter/INPUT: IN=enp0s29f7u2 OUT= MAC=00:24:9b:17:3a:fa:9c:1e:95:e5:ad:b0:08:00 SRC=3.227.167.58 DST=10.11.11.241 LEN=60 TOS=0x00 PREC=0x00 TTL=39 ID=8300 DF PROTO=TCP SPT=54670 DPT=5432 WINDOW=26880 RES=0x00 SYN URGP=0

Jan 19 17:36:16 mha.can.local kernel: filter/INPUT: IN=enp0s29f7u2 OUT= MAC=00:24:9b:17:3a:fa:9c:1e:95:e5:ad:b0:08:00 SRC=3.227.167.58 DST=10.11.11.241 LEN=60 TOS=0x00 PREC=0x00 TTL=39 ID=8301 DF PROTO=TCP SPT=54670 DPT=5432 WINDOW=26880 RES=0x00 SYN URGP=0

Once allowing the source endpoint IP address (3.227.167.58) the connection test succeed and the source endpoint configuration is complete. We also have an SSL connection in order to encrypt the traffic through public networks. This can be confirmed on the PostgreSQL server using the query below as well as in the AWS console:

postgres=# SELECT datname, usename, client_addr, ssl, cipher, query, query_start FROM pg_stat_activity a, pg_stat_ssl s where a.pid=s.pid and usename = 's9sdemo';

datname | usename | client_addr | ssl | cipher | query | query_start

---------+---------+-------------+-----+--------+-------+-------------

(0 rows)

…and then watch while running the connection from the AWS console. The results should looks similar to the following:

postgres=# \watch


                                                                           Sun 19 Jan 2020 06:50:51 PM PST (every 2s)


    datname     | usename | client_addr | ssl |           cipher |                 query | query_start

----------------+---------+-------------+-----+-----------------------------+------------------------------------------------------------------------------------+-------------------------------

 nextcloud_prod | s9sdemo | 127.0.0.1   | t | ECDHE-RSA-AES256-GCM-SHA384 | select cast(setting as integer) from pg_settings where name = 'server_version_num' | 2020-01-19 18:50:51.463496-08

(1 row)

…while AWS console should report a success:

AWS DMS: Source Endpoint connection test successful.

As indicated in the prerequisites section, if we choose the migration option Full load, ongoing replication, we will need to alter the permissions for the PostgreSQL user. This migration option requires superuser privileges, therefore I adjusted the settings for the PostgreSQL user created earlier:

nextcloud_prod=# \du s9sdemo

         List of roles

Role name | Attributes | Member of

-----------+------------+-----------

s9sdemo   | Superuser  | {}

The same document contains instructions for modifying postgresql.conf. Here’s a diff from the original one:

--- a/var/lib/pgsql/data/postgresql.conf

+++ b/var/lib/pgsql/data/postgresql.conf

@@ -95,7 +95,7 @@ max_connections = 100                 # (change requires restart)


# - SSL -


-#ssl = off

+ssl = on

#ssl_ca_file = ''

#ssl_cert_file = 'server.crt'

#ssl_crl_file = ''

@@ -181,6 +181,7 @@ dynamic_shared_memory_type = posix  # the default is the first option


# - Settings -


+wal_level = logical

#wal_level = replica                   # minimal, replica, or logical

                                       # (change requires restart)

#fsync = on                            # flush data to disk for crash safety

@@ -239,6 +240,7 @@ min_wal_size = 80MB

#max_wal_senders = 10          # max number of walsender processes

                              # (change requires restart)

#wal_keep_segments = 0         # in logfile segments; 0 disables

+wal_sender_timeout = 0

#wal_sender_timeout = 60s      # in milliseconds; 0 disables


#max_replication_slots = 10    # max number of replication slots

@@ -451,6 +453,7 @@ log_rotation_size = 0                       # Automatic rotation of logfiles will

#log_duration = off

#log_error_verbosity = default         # terse, default, or verbose messages

Lastly, don’t forget to adjust the pg_hba.conf settings in order to allow SSL connection from the replication instance IP address.

We are now ready for the next step.

Target Endpoint

Follow the wizard to create the Target Endpoint:

AWS DMS: Target Endpoint configuration.

This step assumes that the RDS instance with the specified endpoint already exists along with the empty database nextcloud_awsdms. The database can be created during the RDS instance setup.

At this point, if the AWS networking is correctly setup, we should be ready to run the connection test:

AWS DMS: Target Endpoint connection test successful.

With the environment in place, it is now time to create the migration task:

Migration Task

Once the wizard completed the configuration looks like this:

AWS DMS: Migration Task configuratoin - part 1.

...and the second part of the same view:

AWS DMS: Migration Task configuration - part 2.

Once the task is started we can monitor the progress —open up the task details and scroll down to Table Statistics:

AWS DMS: Table Statistics for running tasks.

 AWS DMS is using the cached schema in order to migrate the database tables. While migration progresses, we can continue “watching” the queries on the source database, and the PostgreSQL error log, in addition to the AWS console:

psql: `\watch'-ing the AWS DMS queries.

In case of errors, the failure state is displayed in the console:

AWS DMS: failed task display.

One place to look for clues is CloudWatch, although during my tests the logs didn’t end up being published, which could likely be just another glitch in the beta version of the AWS DMS 3.3.0 as it turned out to be towards the end of this exercise:

AWS DMS: logs not published to CloudWatch - 3.3.0 beta version glitch?

The migration progress is nicely displayed in the AWS DMS console:

AWS DMS: migration progress displayed in console.

Once the migration is complete, reviewing one more time, the PostgreSQL error log, reveals a surprising message:

PostgreSQL error log: relhaspkey error - another AWS DMS 3.3.0 beta version glitch?

What seems to happen, is that in PostgreSQL 9.6, 10 the pg_class table contains the named column relhaspkey, but that’s not the case in 11. And that’s the glitch in beta version of AWS DMS 3.3.0 that I was referring to earlier.

GCP

Google’s approach is based on the open source tool PgBouncer. The excitement was short lived, as the official documentation talks about migrating PostgreSQL into a compute engine environment.

Further attempts to find a migration solution to Cloud SQL that resembles AWS DMS failed. The Database migration strategies contain no reference to PostgreSQL:

GCP: migrating to Cloud SQL - not available for PostgreSQL.

On-prem PostgreSQL installations can be migrated to Cloud SQL by using the services of one of the Google Cloud partners.

A potential solution may be PgBouncer to Cloud SQL, but that is not within the scope of this blog.

Microsoft Cloud Services (Azure)

In order to facilitate the migration of PostgreSQL workloads from on-prem to the managed Azure Database for PostgreSQL Microsoft provides Azure DMS which according to documentation can be used to migrate with minimal downtime. The tutorial Migrate PostgreSQL to Azure Database for PostgreSQL online using DMS describes these steps in detail.

The Azure DMS documentation discusses in great detail the issues and limitations associated with migrating the PostgreSQL workloads into Azure.

One notable difference from AWS DMS is the requirement to manually create the schema:

Azure DMS: schema must be migrated manually.

A demo of this will be the topic of a future blog. Stay tuned.


What to Check if PostgreSQL Memory Utilization is High

$
0
0

Reading from memory will always be more performant than going to disk, so for all database technologies you would want to use as much memory as possible. If you are not sure about the configuration, or you have an error, this could generate high memory utilization or even an out-of-memory issue.

In this blog, we’ll look at how to check your PostgreSQL memory utilization and which parameter you should take into account to tune it. For this, let’s start by seeing an overview of PostgreSQL's architecture.

PostgreSQL Architecture

PostgreSQL's architecture is based on three fundamental parts: Processes, Memory, and Disk.

The memory can be classified into two categories:

  • Local Memory: It is loaded by each backend process for its own use for queries processing. It is divided into sub-areas:
    • Work mem: The work mem is used for sorting tuples by ORDER BY and DISTINCT operations, and for joining tables.
    • Maintenance work mem: Some kinds of maintenance operations use this area. For example, VACUUM, if you’re not specifying autovacuum_work_mem.
    • Temp buffers: It is used for store temporary tables.
  • Shared Memory: It is allocated by the PostgreSQL server when it is started, and it is used by all the processes. It is divided into sub-areas:
    • Shared buffer pool: Where PostgreSQL loads pages with tables and indexes from disk, to work directly from memory, reducing the disk access.
    • WAL buffer: The WAL data is the transaction log in PostgreSQL and contains the changes in the database. WAL buffer is the area where the WAL data is stored temporarily before writing it to disk into the WAL files. This is done every some predefined time called checkpoint. This is very important to avoid the loss of information in the event of a server failure.
    • Commit log: It saves the status of all transactions for concurrency control.

How to Know What is Happening

If you are having high memory utilization, first, you should confirm which process is generating the consumption.

Using the “Top” Linux Command

The top linux command is probably the best option here (or even a similar one like htop). With this command, you can see the process/processes that are consuming too much memory. 

When you confirm that PostgreSQL is responsible for this issue, the next step is to check why.

Using the PostgreSQL Log

Checking both the PostgreSQL and systems logs is definitely a good way to have more information about what is happening in your database/system. You could see messages like:

Resource temporarily unavailable

Out of memory: Kill process 1161 (postgres) score 366 or sacrifice child

If you don’t have enough free memory.

Or even multiple database message errors like:

FATAL:  password authentication failed for user "username"

ERROR:  duplicate key value violates unique constraint "sbtest21_pkey"

ERROR:  deadlock detected

When you are having some unexpected behavior on the database side. So, the logs are useful to detect these kinds of issues and even more. You can automate this monitoring by parsing the log files looking for works like “FATAL”, “ERROR” or “Kill”, so you will receive an alert when it happens.

Using Pg_top

If you know that the PostgreSQL process is having a high memory utilization, but the logs didn’t help, you have another tool that can be useful here, pg_top.

This tool is similar to the top linux tool, but it’s specifically for PostgreSQL. So, using it, you will have more detailed information about what is running your database, and you can even kill queries, or run an explain job if you detect something wrong. You can find more information about this tool here.

But what happens if you can’t detect any error, and the database is still using a lot of RAM. So, you will probably need to check the database configuration.

Which Configuration Parameters to Take into Account

If everything looks fine but you still have the high utilization problem, you should check the configuration to confirm if it is correct. So, the following are parameters that you should take into account in this case.

shared_buffers

This is the amount of memory that the database server uses for shared memory buffers. If this value is too low, the database would use more disk, which would cause more slowness, but if it is too high, could generate high memory utilization. According to the documentation, if you have a dedicated database server with 1GB or more of RAM, a reasonable starting value for shared_buffers is 25% of the memory in your system.

work_mem

It specifies the amount of memory that will be used by the ORDER BY, DISTINCT and JOIN before writing to the temporary files on disk. As with the shared_buffers, if we configure this parameter too low, we can have more operations going into disk, but too high is dangerous for the memory usage. The default value is 4 MB.

max_connections

Work_mem also goes hand to hand with the max_connections value, as each connection will be executing these operations at the same time, and each operation will be allowed to use as much memory as specified by this value before it starts to write data in temporary files. This parameter determines the maximum number of simultaneous connections to our database, if we configure a high number of connections, and don’t take this into account, you can start having resource issues. The default value is 100.

temp_buffers

The temporary buffers are used to store the temporary tables used in each session. This parameter sets the maximum amount of memory for this task. The default value is 8 MB.

maintenance_work_mem

This is the max memory that an operation like Vacuuming, adding indexes or foreign keys can consume. The good thing is that only one operation of this type can be run in a session, and is not the most common thing to be running several of these at the same time in the system. The default value is 64 MB.

autovacuum_work_mem

The vacuum uses the maintenance_work_mem by default, but we can separate it using this parameter. We can specify the maximum amount of memory to be used by each autovacuum worker here.

wal_buffers

The amount of shared memory used for WAL data that has not yet been written to disk. The default setting is 3% of shared_buffers, but not less than 64kB nor more than the size of one WAL segment, typically 16MB. 

Conclusion

There are different reasons to have a high memory utilization, and detecting the root issue could be a time-consuming task. In this blog, we mentioned different ways to check your PostgreSQL memory utilization and which parameter should you take into account to tune it, to avoid excessive memory usage.

When Should I Add an Extra Database Node?

$
0
0

The fact that people are not easily convinced to have an additional database node in production due to cost is somewhat absurd and is an idea that should be put aside. While adding a new node would bring more complexity to the current database infrastructure, there is a plethora of automation and helper tools in the market that can help you manage the scalability and continuity of the database layer. 

There are diverse reasons that may influence this somewhat costly decision, and you will probably realize it only when something is going south or starting to fall apart. This blog post provides common reasons when you should add an extra database node into your existing database infrastructure, whether you are running on a standalone or a clustered setup.

Faster Recovery Time

The ultimate reason for having an extra database node for redundancy is to achieve better availability and faster recovery time when something goes wrong. It's a protection against malfunctions that could occur on the primary database node and you would have a standby node which is ready to take over the primary role from the problematic node at any given time. 

A standby node replicating to a primary node is probably the most cost-effective solution that you can have to improve the recovery time. When the primary database node is down, promote the standby node as the new master and change the database connection string in the applications to connect to the new master and you are pretty much back in business. The failover process can then be automated and fine tuned over time, or you could introduce a reverse proxy tier which acts as the gateway on top of the database tier.

Improved Performance

Application grows to be more demanding over time. The magnitude of growth could be exponential depending on the success of your business. Scaling out your database tier to cater for bigger workloads is commonly necessary to improve the performance and responsiveness of your applications. 
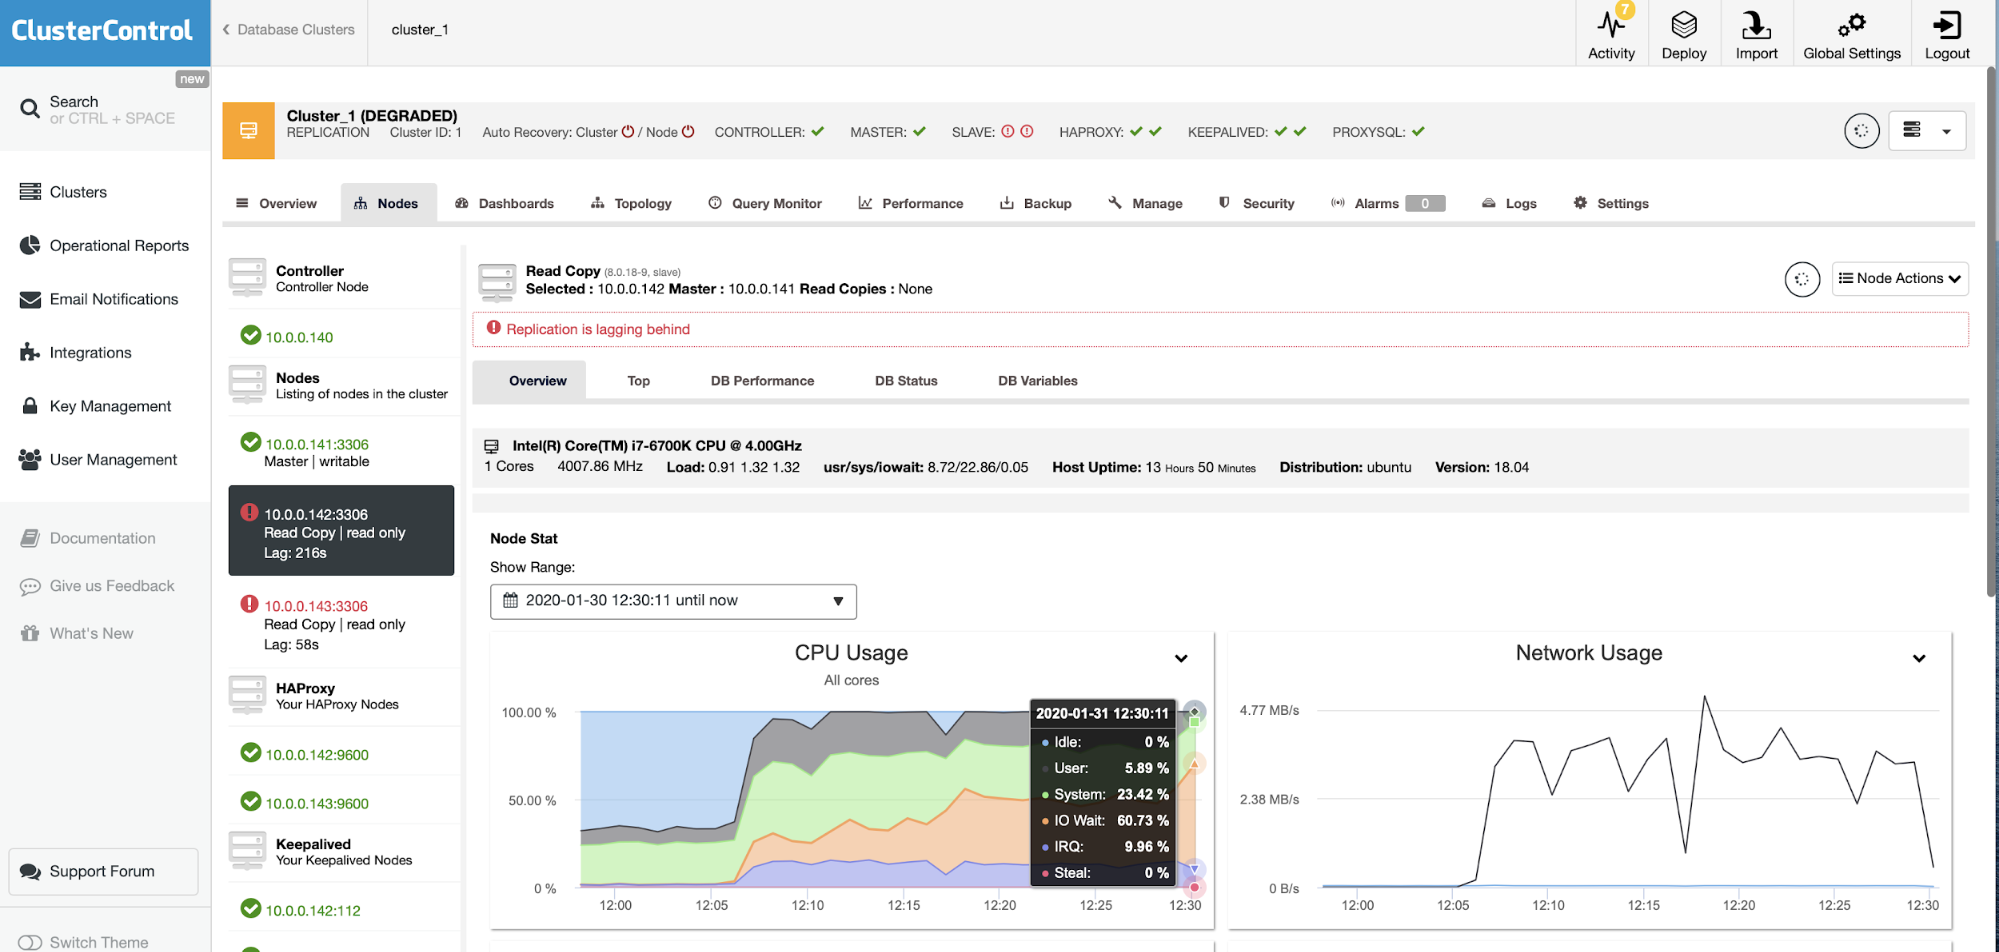
Database workloads can be categorized into two - reads or writes. For read-intensive workload, adding more database replicas will help to spread out the load to multiple database servers. For write-intensive workload, adding more database masters will likely reduce the contention that commonly happens in a single node and improve parallelism processing. Just make sure that the multi-master clustering technology that you use supports conflict detection and resolution, otherwise the application has to handle this part separately.

Approaching the Thresholds

As your database usage grows, there will be a point of time where the database node is fast approaching the defined threshold for the server and database resources. Resources like CPU clock, RAM, disk I/O and disk space are frequently becoming the limiting factors for your database to keep up with the demand.

For example, one would probably hit the limit of storage allocated for the database and also approaching the maximum connections allowed to the database. In this case, partitioning your data into multiple nodes would make more sense because you would get more storage space and I/O operations with the ability to process bigger write workloads for the database, just like killing two birds with one stone.

Upgrade Testing

Before upgrading to another major version, it's recommended to test out your current dataset on the new version just to make sure you can operate smoothly and eliminate the element of surprise later on. It's pretty common for the new major version to deprecate some legacy options or parameters that we have been using in the current version and some incompatibilities where application programming changes might be required. Also, you can measure the performance improvement (or regression) that you will get after upgrading, which could justify the reason for this exercise.

Major version upgrade commonly requires extra attention to the upgrade step, if compared to minor version patching which usually can be performed with few steps. Minor releases never change the internal storage format and are always compatible with earlier and later minor releases of the same major version number.

Generally, there are 3 ways to perform database major version upgrade:

  • In-place
  • Logical upgrade
  • Replication

In-place, where you use existing data directory against the new database major version, with just running upgrade script after binaries are upgraded. For logical upgrade, use the logical backup on an old version and then restore it on a new version. This usually requires an additional database node, unless you would like to restore the logical backup on the new version installed in the same server as the old one.

For replication, create a standby server with the updated database version and replicate from the old major version. Once everything is synced up, connect your application to the to the standby (or slave) server and verify if necessary adjustments are required. Then, you can promote the standby server as the new master and your database server is officially upgraded, with a very minimal downtime.

Backup Verification

We have stressed out this a couple of times in the older blog posts - backup is not a backup if it is not restorable. Backup verification is an important process to ensure you meet your RTO, which basically represents how long it takes to restore from the incident until normal operations are available to the mass users.

You can measure the amount of time it takes to recover by observing the backup verification process, which is the best to be performed on a separate node, as you don't want to increase the burden or put the production database servers under risks.

The ClusterControl backup verification feature allows you to estimate your total mean recovery time, with the extra database node used for verification process can be configured to shut down automatically right after verification process completes. Check out this blog post if you want to learn more about how ClusterControl performs this job.

Conclusion

As your database grows, scaling out your database nodes is going to be necessary and must be well-thought since the beginning. The actual cost of having more database nodes for your environment sometimes justify your requirements and could be more than worth it to keep up with the growth of your business.


How to Protect your MySQL or MariaDB Database From SQL Injection: Part Two

$
0
0

In the first part of this blog we described how ProxySQL can be used to block incoming queries that were deemed dangerous. As you saw in that blog, achieving this is very easy. This is not a full solution, though. You may need to design an even more tightly secured setup - you may want to block all of the queries and then allow just some select ones to pass through. It is possible to use ProxySQL to accomplish that. Let’s take a look at how it can be done.
There are two ways to implement whitelist in ProxySQL. First, the historical one, would be to create a catch-all rule that will block all the queries. It should be the last query rule in the chain. An example below:

We are matching every string and generate an error message. This is the only rule existing at this time, it prevents any query from being executed.

mysql> USE sbtest;

Database changed

mysql> SELECT * FROM sbtest1 LIMIT 10;

ERROR 1148 (42000): This query is not on the whitelist, you have to create a query rule before you'll be able to execute it.

mysql> SHOW TABLES FROM sbtest;

ERROR 1148 (42000): This query is not on the whitelist, you have to create a query rule before you'll be able to execute it.

mysql> SELECT 1;

ERROR 1148 (42000): This query is not on the whitelist, you have to create a query rule before you'll be able to execute it.

As you can see, we can’t run any queries. In order for our application to work we would have to create query rules for all of the queries that we want to allow to execute. It can be done per query, based on the digest or pattern. You can also allow traffic based on the other factors: username, client host, schema. Let’s allow SELECTs to one of the tables:

Now we can execute queries on this table, but not on any other:

mysql> SELECT id, k FROM sbtest1 LIMIT 2;

+------+------+

| id   | k |

+------+------+

| 7615 | 1942 |

| 3355 | 2310 |

+------+------+

2 rows in set (0.01 sec)

mysql> SELECT id, k FROM sbtest2 LIMIT 2;

ERROR 1148 (42000): This query is not on the whitelist, you have to create a query rule before you'll be able to execute it.

The problem with this approach is that it is not efficiently handled in ProxySQL, therefore in ProxySQL 2.0.9 comes with new mechanism of firewalling which includes new algorithm, focused on this particular use case and as such more efficient. Let’s see how we can use it.

First, we have to install ProxySQL 2.0.9. You can download packages manually from https://github.com/sysown/proxysql/releases/tag/v2.0.9 or you can set up the ProxySQL repository.


Once this is done, we can start looking into it and try to configure it to use SQL firewall. 

The process itself is quite easy. First of all, you have to add a user to the mysql_firewall_whitelist_users table. It contains all the users for which firewall should be enabled.

mysql> INSERT INTO mysql_firewall_whitelist_users (username, client_address, mode, comment) VALUES ('sbtest', '', 'DETECTING', '');

Query OK, 1 row affected (0.00 sec)

mysql> LOAD MYSQL FIREWALL TO RUNTIME;

Query OK, 0 rows affected (0.00 sec)

In the query above we added ‘sbtest’ user to the list of users which should have firewall enabled. It is possible to tell that only connections from a given host are tested against the firewall rules. You can also have three modes: ‘OFF’, when firewall is not used, ‘DETECTING’, where incorrect queries are logged but not blocked and ‘PROTECTING’, where not allowed queries will not be executed.

Let’s enable our firewall:

mysql> SET mysql-firewall_whitelist_enabled=1;

Query OK, 1 row affected (0.00 sec)

mysql> LOAD MYSQL VARIABLES TO RUNTIME;

Query OK, 0 rows affected (0.00 sec)

ProxySQL firewall bases on the digest of the queries, it does not allow for regular expressions to be used. The best way to collect data about which queries should be allowed is to use stats.stats_mysql_query_digest table, where you can collect queries and their digests. On top of that, ProxySQL 2.0.9 comes with a new table: history_mysql_query_digest, which is an persistent extension to the previously mentioned in-memory table. You can configure ProxySQL to store data on disk from time to time:

mysql> SET admin-stats_mysql_query_digest_to_disk=30;

Query OK, 1 row affected (0.00 sec)

Every 30 seconds data about queries will be stored on disk. Let’s see how it goes. We’ll execute couple of queries and then check their digests:

mysql> SELECT schemaname, username, digest, digest_text FROM history_mysql_query_digest;

+------------+----------+--------------------+-----------------------------------+

| schemaname | username | digest             | digest_text |

+------------+----------+--------------------+-----------------------------------+

| sbtest     | sbtest | 0x76B6029DCBA02DCA | SELECT id, k FROM sbtest1 LIMIT ? |

| sbtest     | sbtest | 0x1C46AE529DD5A40E | SELECT ?                          |

| sbtest     | sbtest | 0xB9697893C9DF0E42 | SELECT id, k FROM sbtest2 LIMIT ? |

+------------+----------+--------------------+-----------------------------------+

3 rows in set (0.00 sec)

As we set the firewall to ‘DETECTING’ mode, we’ll also see entries in the log:

2020-02-14 09:52:12 Query_Processor.cpp:2071:process_mysql_query(): [WARNING] Firewall detected unknown query with digest 0xB9697893C9DF0E42 from user sbtest@10.0.0.140

2020-02-14 09:52:17 Query_Processor.cpp:2071:process_mysql_query(): [WARNING] Firewall detected unknown query with digest 0x76B6029DCBA02DCA from user sbtest@10.0.0.140

2020-02-14 09:52:20 Query_Processor.cpp:2071:process_mysql_query(): [WARNING] Firewall detected unknown query with digest 0x1C46AE529DD5A40E from user sbtest@10.0.0.140

Now, if we want to start blocking queries, we should update our user and set the mode to ‘PROTECTING’. This will block all the traffic so let’s start by whitelisting queries above. Then we’ll enable the ‘PROTECTING’ mode:

mysql> INSERT INTO mysql_firewall_whitelist_rules (active, username, client_address, schemaname, digest, comment) VALUES (1, 'sbtest', '', 'sbtest', '0x76B6029DCBA02DCA', ''), (1, 'sbtest', '', 'sbtest', '0xB9697893C9DF0E42', ''), (1, 'sbtest', '', 'sbtest', '0x1C46AE529DD5A40E', '');

Query OK, 3 rows affected (0.00 sec)

mysql> UPDATE mysql_firewall_whitelist_users SET mode='PROTECTING' WHERE username='sbtest' AND client_address='';

Query OK, 1 row affected (0.00 sec)

mysql> LOAD MYSQL FIREWALL TO RUNTIME;

Query OK, 0 rows affected (0.00 sec)

mysql> SAVE MYSQL FIREWALL TO DISK;

Query OK, 0 rows affected (0.08 sec)

That’s it. Now we can execute whitelisted queries:

mysql> SELECT id, k FROM sbtest1 LIMIT 2;

+------+------+

| id   | k |

+------+------+

| 7615 | 1942 |

| 3355 | 2310 |

+------+------+

2 rows in set (0.00 sec)

But we cannot execute non-whitelisted ones:

mysql> SELECT id, k FROM sbtest3 LIMIT 2;

ERROR 1148 (42000): Firewall blocked this query

ProxySQL 2.0.9 comes with yet another interesting security feature. It has embedded libsqlinjection and you can enable the detection of possible SQL injections. Detection is based on the algorithms from the libsqlinjection. This feature can be enabled by running:

mysql> SET mysql-automatic_detect_sqli=1;

Query OK, 1 row affected (0.00 sec)

mysql> LOAD MYSQL VARIABLES TO RUNTIME;

Query OK, 0 rows affected (0.00 sec)

It works with the firewall in a following way:

  • If the firewall is enabled and the user is in PROTECTING mode, SQL injection detection is not used as only explicitly whitelisted queries can pass through.
  • If the firewall is enabled and the user is in DETECTING mode, whitelisted queries are not tested for SQL injection, all others will be tested.
  • If the firewall is enabled and the user is in ‘OFF’ mode, all queries are assumed to be whitelisted and none will be tested for SQL injection.
  • If the firewall is disabled, all queries will be tested for SQL intection.

Basically, it is used only if the firewall is disabled or for users in ‘DETECTING’ mode. SQL injection detection, unfortunately, comes with quite a lot of false positives. You can use table mysql_firewall_whitelist_sqli_fingerprints to whitelist fingerprints for queries which were detected incorrectly. Let’s see how it works. First, let’s disable firewall:

mysql> set mysql-firewall_whitelist_enabled=0;

Query OK, 1 row affected (0.00 sec)

mysql> LOAD MYSQL VARIABLES TO RUNTIME;

Query OK, 0 rows affected (0.00 sec)

Then, let’s run some queries.

mysql> SELECT id, k FROM sbtest2 LIMIT 2;

ERROR 2013 (HY000): Lost connection to MySQL server during query

Indeed, there are false positives. In the log we could find:

2020-02-14 10:11:19 MySQL_Session.cpp:3393:handler(): [ERROR] SQLinjection detected with fingerprint of 'EnknB' from client sbtest@10.0.0.140 . Query listed below:

SELECT id, k FROM sbtest2 LIMIT 2

Ok, let’s add this fingerprint to the whitelist table:

mysql> INSERT INTO mysql_firewall_whitelist_sqli_fingerprints VALUES (1, 'EnknB');

Query OK, 1 row affected (0.00 sec)

mysql> LOAD MYSQL FIREWALL TO RUNTIME;

Query OK, 0 rows affected (0.00 sec)

Now we can finally execute this query:

mysql> SELECT id, k FROM sbtest2 LIMIT 2;

+------+------+

| id   | k |

+------+------+

|   84 | 2456 |

| 6006 | 2588 |

+------+------+

2 rows in set (0.01 sec)

We tried to run sysbench workload, this resulted in two more fingerprints added to the whitelist table:

2020-02-14 10:15:55 MySQL_Session.cpp:3393:handler(): [ERROR] SQLinjection detected with fingerprint of 'Enknk' from client sbtest@10.0.0.140 . Query listed below:

SELECT c FROM sbtest21 WHERE id=49474

2020-02-14 10:16:02 MySQL_Session.cpp:3393:handler(): [ERROR] SQLinjection detected with fingerprint of 'Ef(n)' from client sbtest@10.0.0.140 . Query listed below:

SELECT SUM(k) FROM sbtest32 WHERE id BETWEEN 50053 AND 50152

We wanted to see if this automated SQL injection can protect us against our good friend, Booby Tables.

mysql> CREATE TABLE school.students (id INT, name VARCHAR(40));

Query OK, 0 rows affected (0.07 sec)

mysql> INSERT INTO school.students VALUES (1, 'Robert');DROP TABLE students;--

Query OK, 1 row affected (0.01 sec)

Query OK, 0 rows affected (0.04 sec)

mysql> SHOW TABLES FROM school;

Empty set (0.01 sec)

Unfortunately, not really. Please keep in mind this feature is based on automated forensic algorithms, it is far from perfect. It may come as an additional layer of defence but it will never be able to replace properly maintained firewall created by someone who knows the application and its queries.

We hope that after reading this short, two-part series you have a better understanding of how you can protect your database against SQL injection and malicious attempts (or just plainly user errors) using ProxySQL. If you have more ideas, we’d love to hear from you in the comments.

Viewing all 1258 articles
Browse latest View live


<script src="https://jsc.adskeeper.com/r/s/rssing.com.1596347.js" async> </script>