Quantcast
Channel: Severalnines
Viewing all 1258 articles
Browse latest View live

What to Check if MySQL Memory Utilisation is High

$
0
0

One of the key factors of a performant MySQL database server is having good memory allocation and utilization, especially when running it in a production environment. But how can you determine if the MySQL utilization is optimized? Is it reasonable to have high memory utilization or does it require fine tuning? What if I come up against a memory leak?

Let's cover these topics and show the things you can check in MySQL to determine traces of high memory utilization.

Memory Allocation in MySQL

Before we delve into the specific subject title, I'll just give a short information about how MySQL uses memory. Memory plays a significant resource for speed and efficiency when handling concurrent transactions and running big queries. Each thread in MySQL demands memory which is used to manage client connections, and these threads share the same base memory. Variables like thread_stack (stack for threads), net_buffer_length (for connection buffer and result buffer), or with max_allowed_packet where connection and result will dynamically enlarge up to this value when needed, are variables that do affect memory utilization. When a thread is no longer needed, the memory allocated to it is released and returned to the system unless the thread goes back into the thread cache. In that case, the memory remains allocated. Query joins, query caches, sorting, table cache, table definitions do require memory in MySQL but these are attributed with system variables that you can configure and set.

In most cases, the memory-specific variables set for a configuration are targeted on a storage-based specific configuration such as MyISAM or InnoDB. When a mysqld instance spawns within the host system, MySQL allocates buffers and caches to improve performance of database operations based on the set values set on a specific configuration. For example, the most common variables every DBA will set in InnoDB are variables innodb_buffer_pool_size and innodb_buffer_pool_instances which are both related to buffer pool memory allocation that holds cached data for InnoDB tables. It's desirable if you have large memory and are expecting to handle big transactions by setting innodb_buffer_pool_instances to improve concurrency by dividing the buffer pool into multiple buffer pool instances. 

While for MyISAM, you have to deal with key_buffer_size to handle the amount of memory that the key buffer will handle. MyISAM also allocates buffer for every concurrent threads which contains a table structure, column structures for each column, and a buffer of size 3 * N are allocated (where N is the maximum row length, not counting BLOB columns).  MyISAM also maintains one extra row buffer for internal use.

MySQL also allocates memory for temporary tables unless it becomes too large (determined by tmp_table_size and max_heap_table_size). If you are using MEMORY tables and variable max_heap_table_size is set very high, this can also take a large memory since max_heap_table_size system variable determines how large a table can grow, and there is no conversion to on-disk format.

MySQL also has a Performance Schema which is a feature for monitoring MySQL activities at a low level. Once this is enabled, it dynamically allocates memory incrementally, scaling its memory use to actual server load, instead of allocating required memory during server startup. Once memory is allocated, it is not freed until the server is restarted. 

MySQL can also be configured to allocate large areas of memory for its buffer pool if using Linux and if kernel is enabled for large page support, i.e. using HugePages

What To Check Once MySQL Memory is High

Check Running Queries

It's very common for MySQL DBAs to touch base first what's going on with the running MySQL server. The most basic procedures are check processlist, check server status, and check the storage engine status. To do these things, basically, you have just to run the series of queries by logging in to MySQL. See below:

To view the running queries,

mysql> SHOW [FULL] PROCESSLIST;

Viewing the current processlist reveals queries that are running actively or even idle or sleeping processes. It is very important and is a significant routine to have a record of queries that are running. As noted on how MySQL allocates memory, running queries will utilize memory allocation and can drastically cause performance issues if not monitored.

View the MySQL server status variables,

mysql> SHOW SERVER STATUS\G

or filter specific variables like

mysql> SHOW SERVER STATUS WHERE variable_name IN ('<var1>', 'var2'...);

MySQL's status variables serve as your statistical information to grab metric data to determine how your MySQL performs by observing the counters given by the status values. There are certain values here which gives you a glance that impacts memory utilization. For example, checking the number of threads, the number of table caches, or the buffer pool usage,

...

| Created_tmp_disk_tables                 | 24240 |

| Created_tmp_tables                      | 334999 |

…

| Innodb_buffer_pool_pages_data           | 754         |

| Innodb_buffer_pool_bytes_data           | 12353536         |

...

| Innodb_buffer_pool_pages_dirty          | 6         |

| Innodb_buffer_pool_bytes_dirty          | 98304         |

| Innodb_buffer_pool_pages_flushed        | 30383         |

| Innodb_buffer_pool_pages_free           | 130289         |

…

| Open_table_definitions                  | 540 |

| Open_tables                             | 1024 |

| Opened_table_definitions                | 540 |

| Opened_tables                           | 700887 |

...

| Threads_connected                             | 5 |

...

| Threads_cached    | 2 |

| Threads_connected | 5     |

| Threads_created   | 7 |

| Threads_running   | 1 |

View the engine's monitor status, for example, InnoDB status

mysql> SHOW ENGINE INNODB STATUS\G

The InnoDB status also reveals the current status of transactions that the storage engine is processing. It gives you the heap size of a transaction, adaptive hash indexes revealing its buffer usage, or shows you the innodb buffer pool information just like the example below:

---TRANSACTION 10798819, ACTIVE 0 sec inserting, thread declared inside InnoDB 1201

mysql tables in use 1, locked 1

1 lock struct(s), heap size 1136, 0 row lock(s), undo log entries 8801

MySQL thread id 68481, OS thread handle 139953970235136, query id 681821 localhost root copy to tmp table

ALTER TABLE NewAddressCode2_2 ENGINE=INNODB


…

-------------------------------------

INSERT BUFFER AND ADAPTIVE HASH INDEX

-------------------------------------

Ibuf: size 528, free list len 43894, seg size 44423, 1773 merges

merged operations:

 insert 63140, delete mark 0, delete 0

discarded operations:

 insert 0, delete mark 0, delete 0

Hash table size 553193, node heap has 1 buffer(s)

Hash table size 553193, node heap has 637 buffer(s)

Hash table size 553193, node heap has 772 buffer(s)

Hash table size 553193, node heap has 1239 buffer(s)

Hash table size 553193, node heap has 2 buffer(s)

Hash table size 553193, node heap has 0 buffer(s)

Hash table size 553193, node heap has 1 buffer(s)

Hash table size 553193, node heap has 1 buffer(s)

115320.41 hash searches/s, 10292.51 non-hash searches/s

...

----------------------

BUFFER POOL AND MEMORY

----------------------

Total large memory allocated 2235564032

Dictionary memory allocated 3227698

Internal hash tables (constant factor + variable factor)

    Adaptive hash index 78904768        (35404352 + 43500416)

    Page hash           277384 (buffer pool 0 only)

    Dictionary cache    12078786 (8851088 + 3227698)

    File system         1091824 (812272 + 279552)

    Lock system         5322504 (5313416 + 9088)

    Recovery system     0 (0 + 0)

Buffer pool size   131056

Buffer pool size, bytes 2147221504

Free buffers       8303

Database pages     120100

Old database pages 44172

Modified db pages  108784

Pending reads      0

Pending writes: LRU 2, flush list 342, single page 0

Pages made young 533709, not young 181962

3823.06 youngs/s, 1706.01 non-youngs/s

Pages read 4104, created 236572, written 441223

38.09 reads/s, 339.46 creates/s, 1805.87 writes/s

Buffer pool hit rate 1000 / 1000, young-making rate 12 / 1000 not 5 / 1000

Pages read ahead 0.00/s, evicted without access 0.00/s, Random read ahead 0.00/s

LRU len: 120100, unzip_LRU len: 0

I/O sum[754560]:cur[8096], unzip sum[0]:cur[0]

…

Another thing to add, you can also use Performance Schema and sys schema for monitoring memory consumption and utilization by your MySQL server. By default, most instrumentations are disabled by default so there are manual things to do to use this. 

Check for Swappiness 

Either way, it's probable that MySQL is swapping out its memory to disk. This is oftentimes a very common situation especially when MySQL server and the underlying hardware is not set optimally in parallel to the expected requirements. There are certain cases that the demand of traffic has not been anticipated, memory could grow increasingly especially if bad queries are run causing to consume or utilize a lot of memory space causing degrading performance as data are picked on disk instead of on the buffer. To check for swappiness, just run freemem command or vmstat just like below,

[root@node1 ~]# free -m

              total        used free      shared buff/cache available

Mem:           3790 2754         121 202 915         584

Swap:          1535 39        1496

[root@node1 ~]# vmstat 5 5

procs -----------memory---------- ---swap-- -----io---- -system-- ------cpu-----

 r  b swpd   free buff  cache si so    bi bo in cs us sy id wa st

 2  0 40232 124100      0 937072 2 3 194  1029 477 313 7 2 91 1  0

 0  0 40232 123912      0 937228 0 0   0 49 1247 704 13 3 84  0 0

 1  0 40232 124184      0 937212 0 0   0 35 751 478 6 1 93  0 0

 0  0 40232 123688      0 937228 0 0   0 15 736 487 5 1 94  0 0

 0  0 40232 123912      0 937220 0 0   3 74 1065 729 8 2 89  0 0

You may also check using procfs and gather information such as going to /proc/vmstat or /proc/meminfo.

Using Perf, gdb, and Valgrind with Massif

Using tools like perf, gdb, and valgrind helps you dig into a more advanced method of determining MySQL memory utilization. There are times that an interesting outcome becomes a mystery of solving memory consumption that leads to your bewilderment in MySQL. This turns in the need to have more skepticism and using these tools helps you investigate how MySQL is using handling memory from allocating it to utilizing it for processing transactions or processes. This is useful for example if you are observing MySQL is behaving abnormally that might cause bad configuration or could lead to a findings of memory leaks.

For example, using perf in MySQL reveals more information in a system level report:

[root@testnode5 ~]# perf report --input perf.data --stdio

# To display the perf.data header info, please use --header/--header-only options.

#

#

# Total Lost Samples: 0

#

# Samples: 54K of event 'cpu-clock'

# Event count (approx.): 13702000000

#

# Overhead  Command Shared Object        Symbol                                                                                                                                                                                             

# ........  ....... ...................  ...................................................................................................................................................................................................

#

    60.66%  mysqld [kernel.kallsyms]    [k] _raw_spin_unlock_irqrestore

     2.79%  mysqld   libc-2.17.so         [.] __memcpy_ssse3

     2.54%  mysqld   mysqld             [.] ha_key_cmp

     1.89%  mysqld   [vdso]             [.] __vdso_clock_gettime

     1.05%  mysqld   mysqld             [.] rec_get_offsets_func

     1.03%  mysqld   mysqld             [.] row_sel_field_store_in_mysql_format_func

     0.92%  mysqld   mysqld             [.] _mi_rec_pack

     0.91%  mysqld   [kernel.kallsyms]    [k] finish_task_switch

     0.90%  mysqld   mysqld             [.] row_search_mvcc

     0.86%  mysqld   mysqld             [.] decimal2bin

     0.83%  mysqld   mysqld             [.] _mi_rec_check

….

Since this can be a special topic to dig in, we suggest you look into these really good external blogs as your references, perf Basics for MySQL Profiling, Finding MySQL Scaling Problems Using perf, or learn how to debug using valgrind with massif.

Efficient Way To Check MySQL Memory Utilization

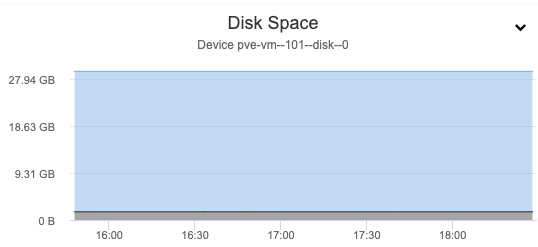
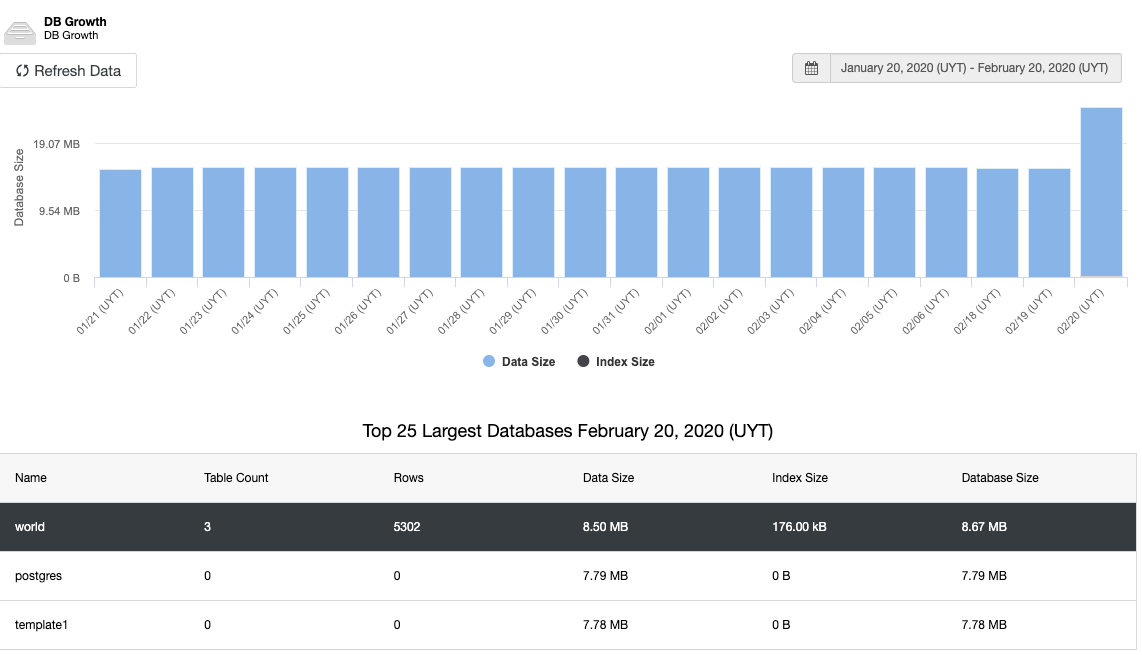
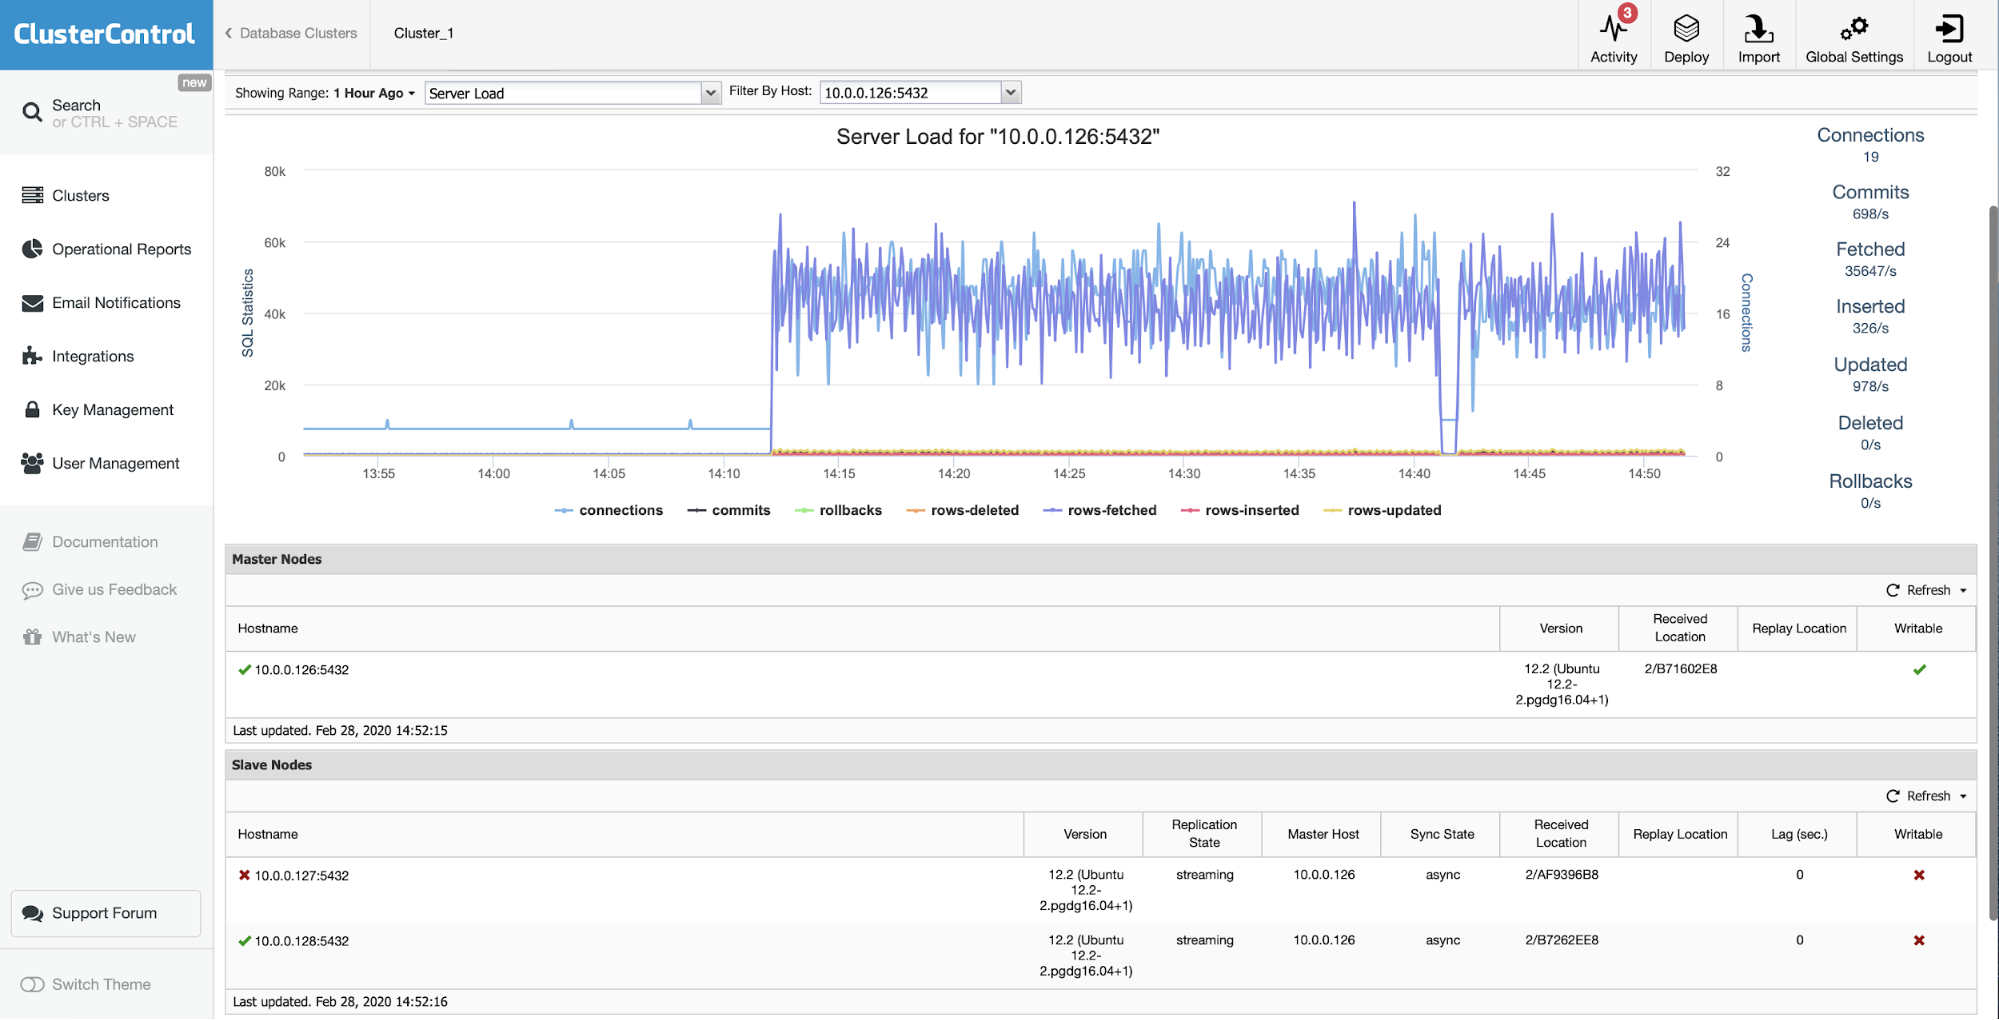
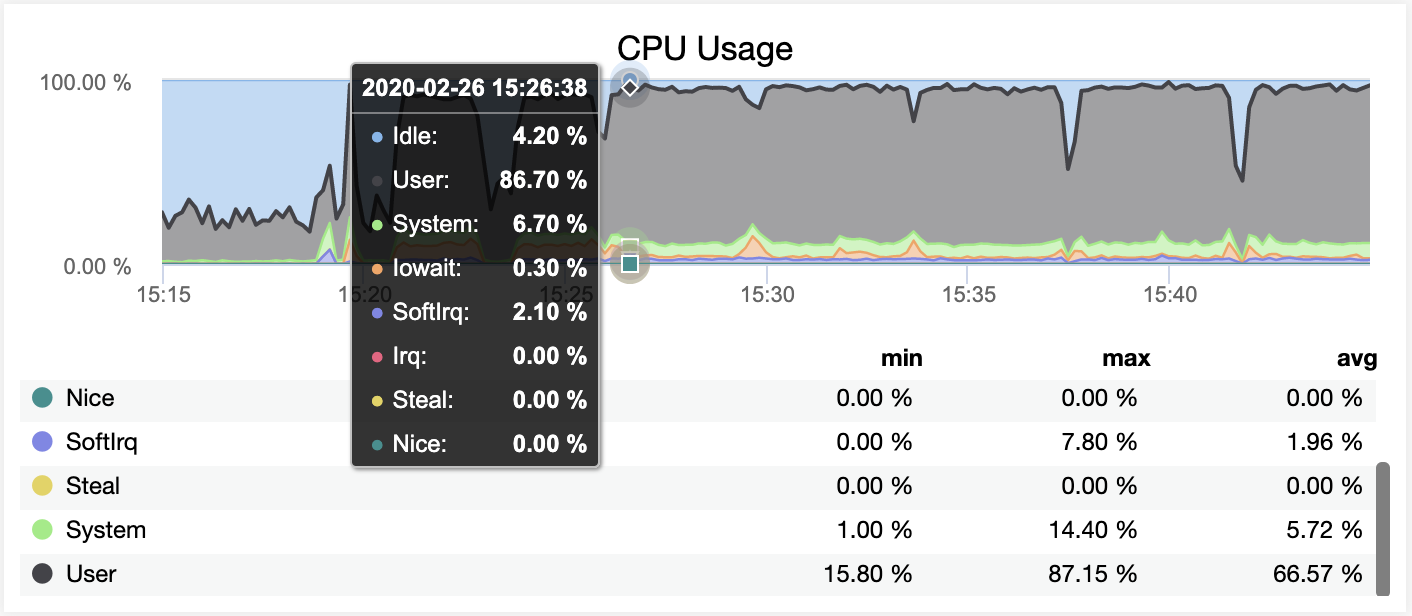
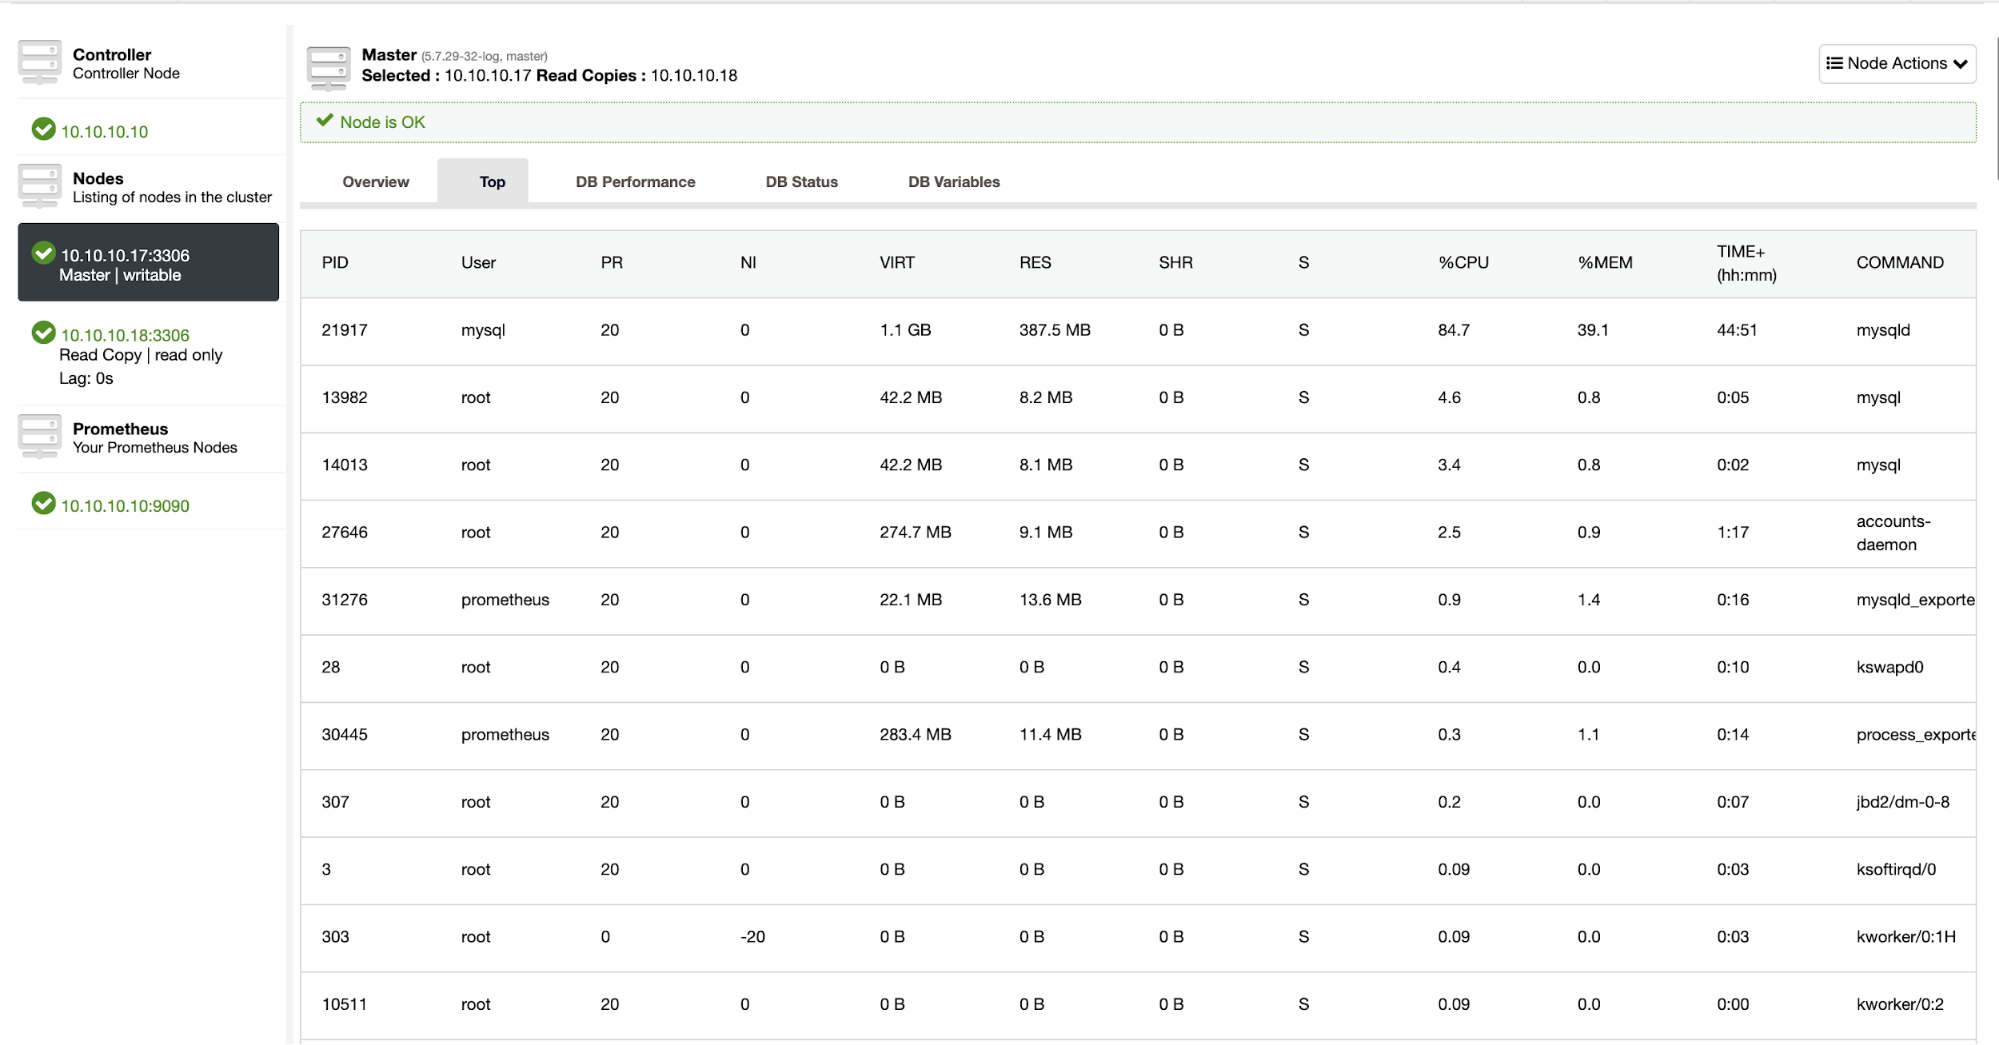
Using ClusterControl relieves any hassle routines like going over through your runbooks or even creating your own playbooks that would deliver reports for you. In ClusterControl, you have Dashboards (using SCUMM) where you can have a quick overview of your MySQL node(s). For example, viewing the MySQL General dashboard,

you can determine how the MySQL node performs,

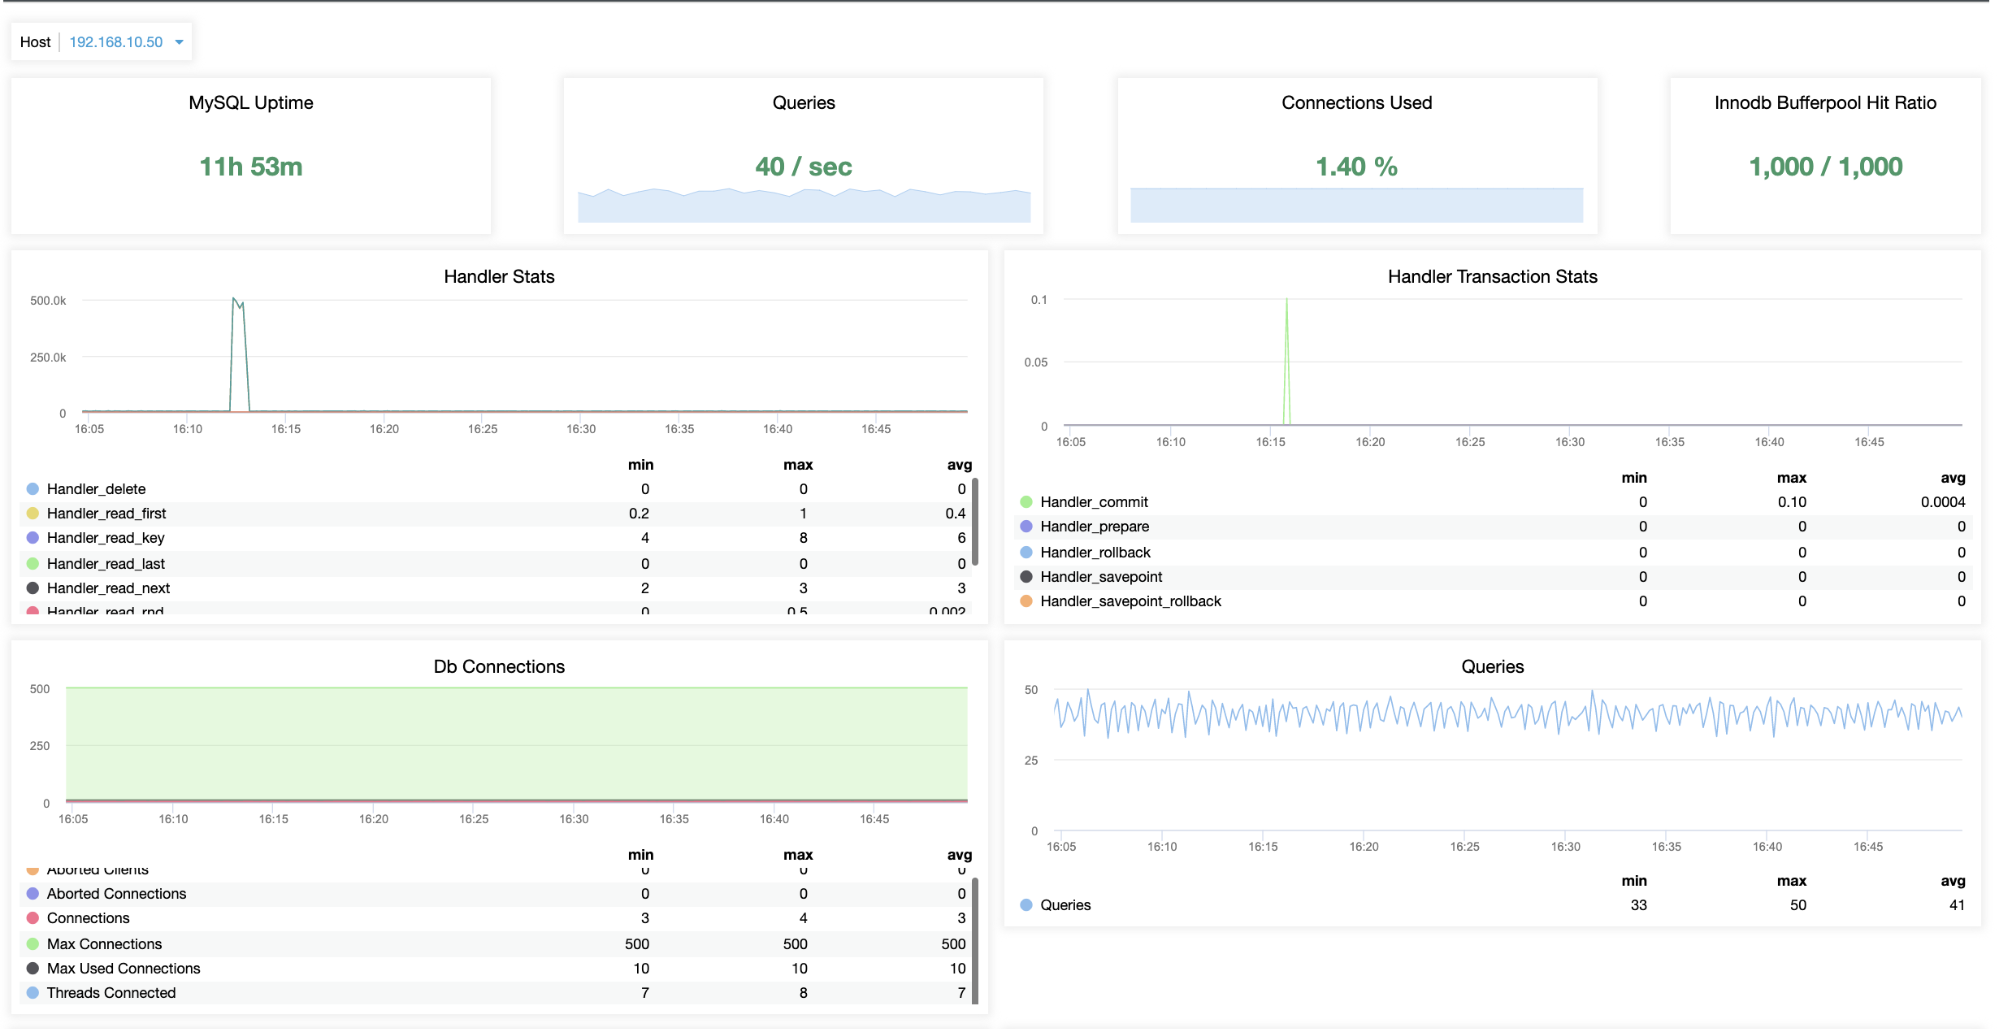
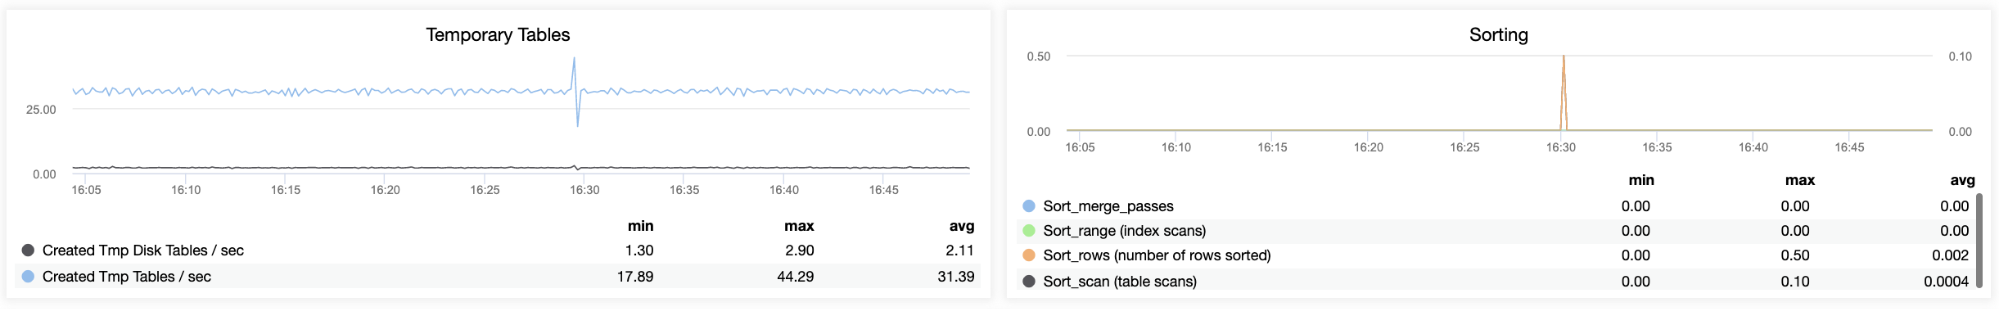
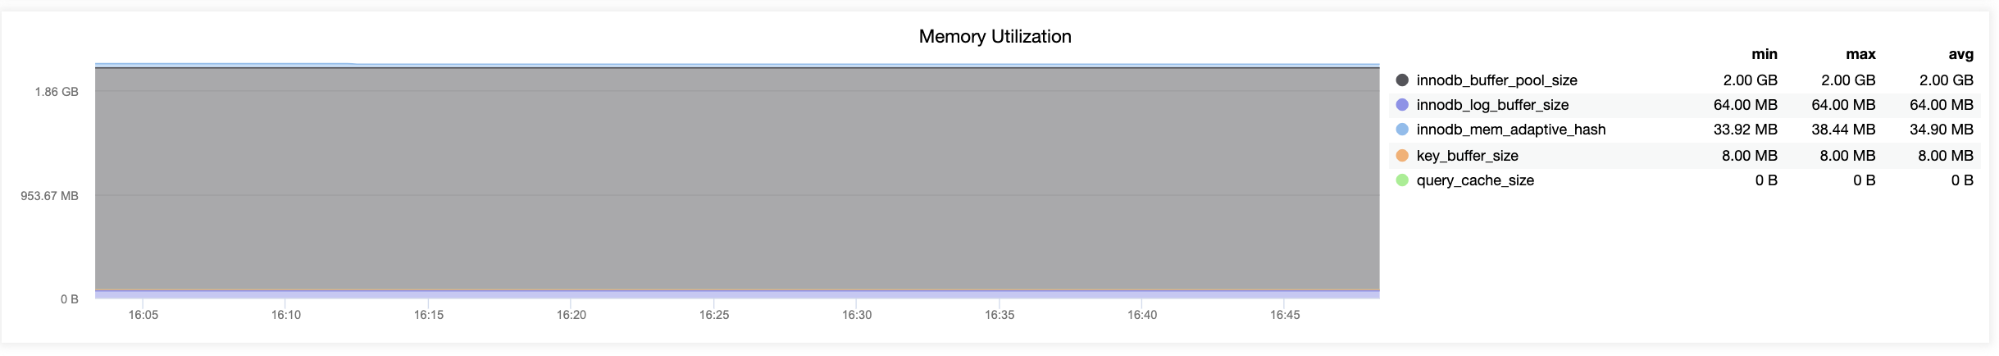
You see that the images above reveal variables that impact MySQL memory utilization. You can check how the metrics for sort caches, temporary tables, threads connected, query cache, or storage engines innodb buffer pool or MyISAM's key buffer.

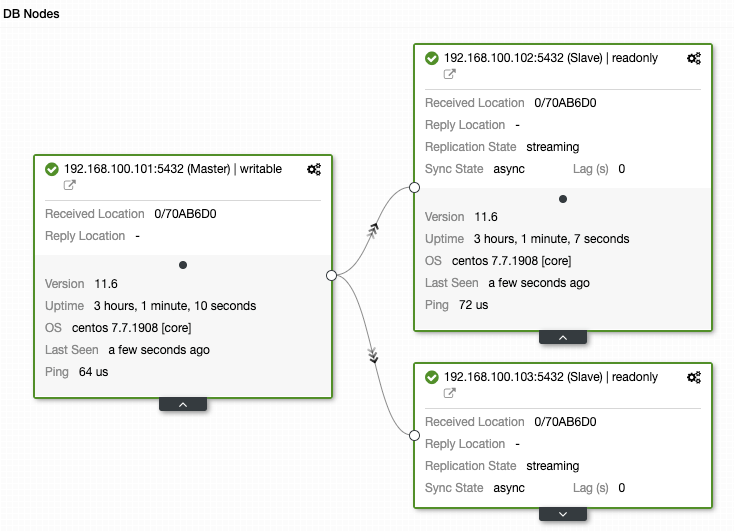
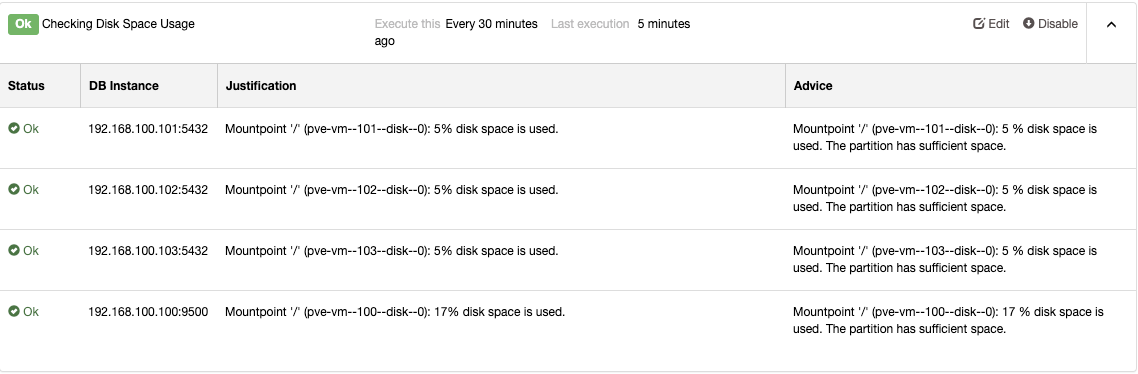
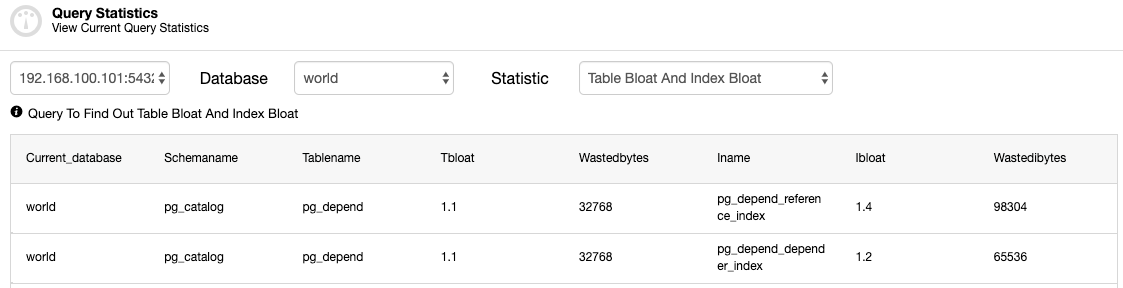
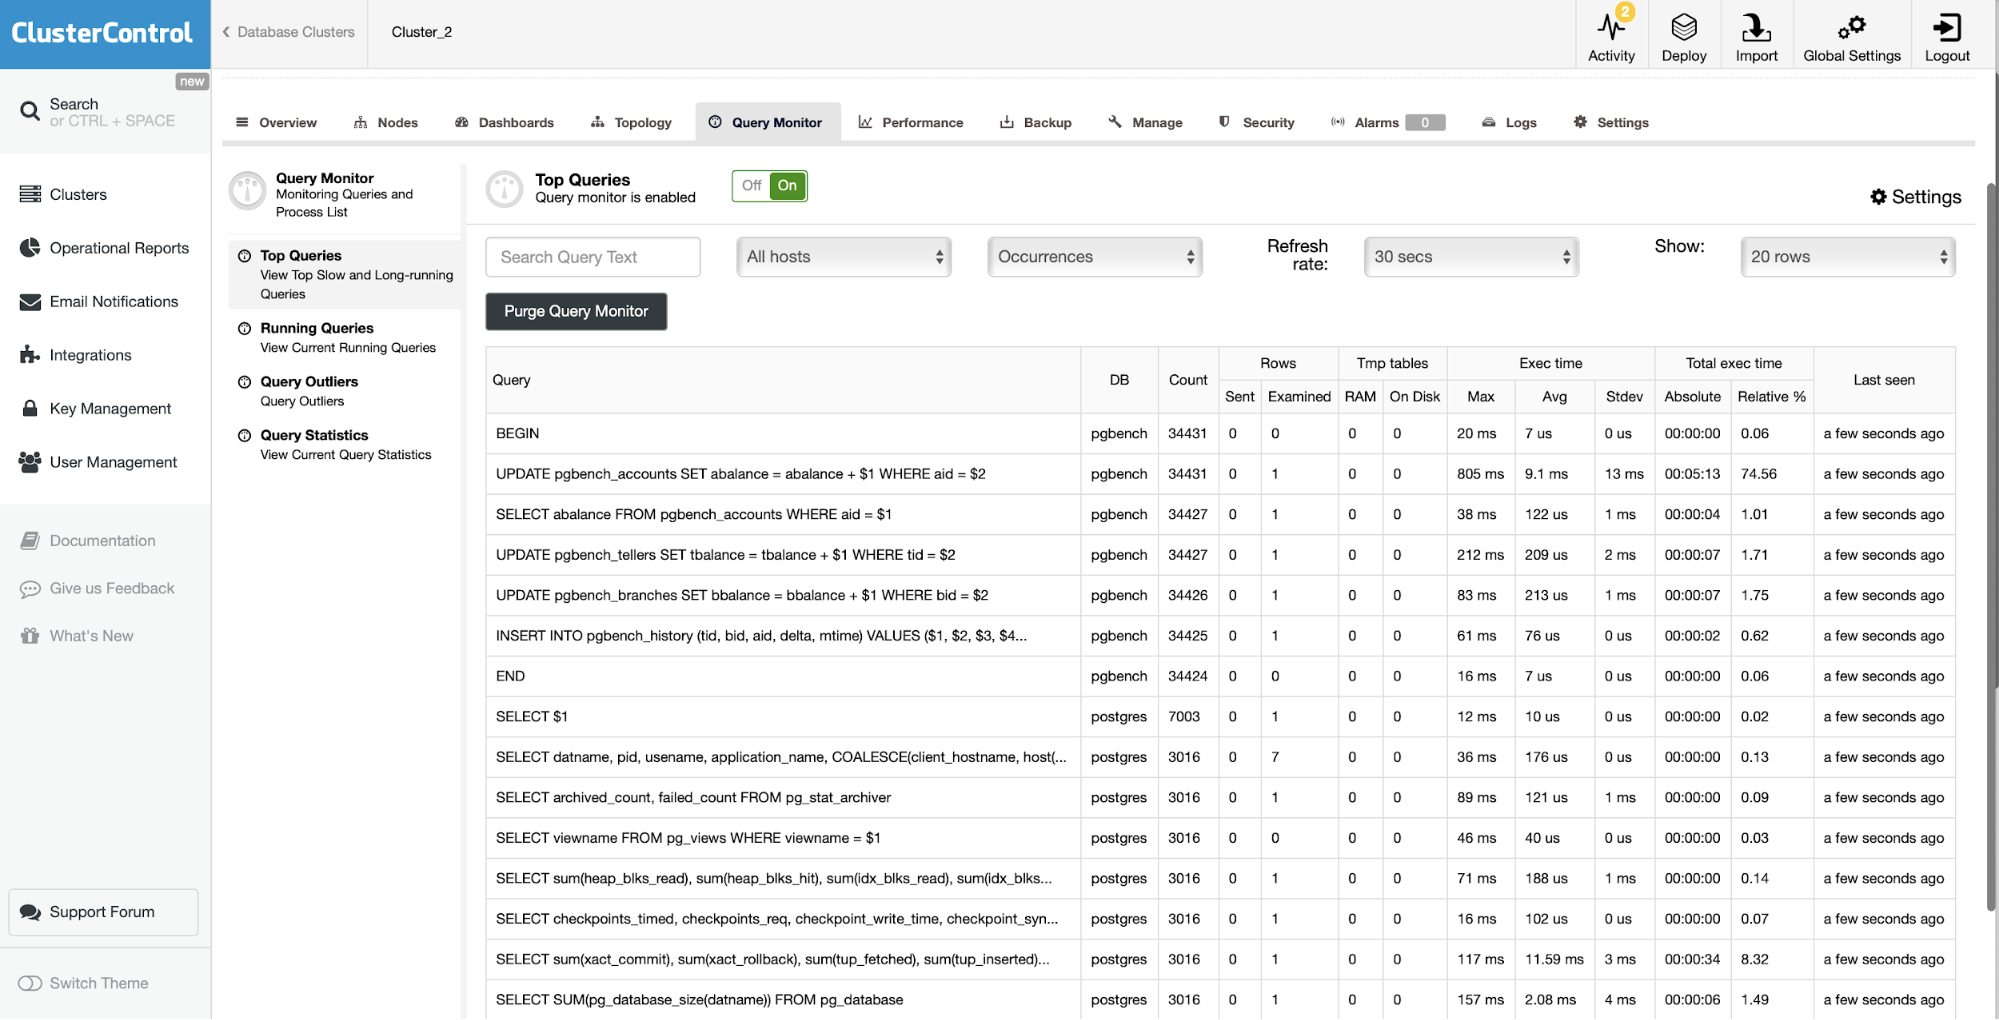
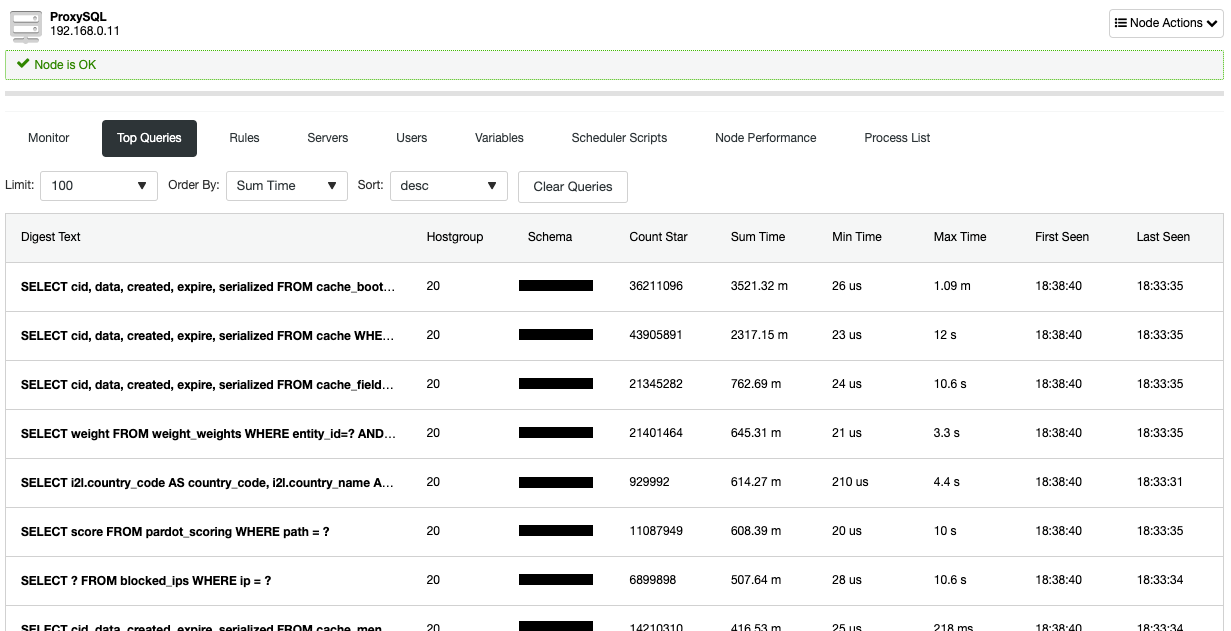
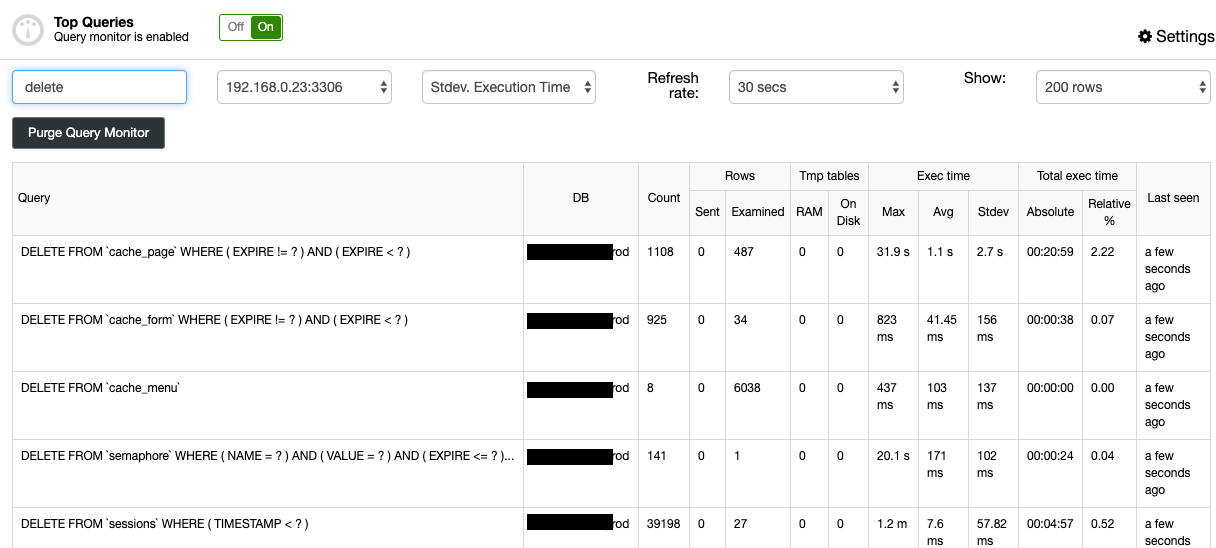
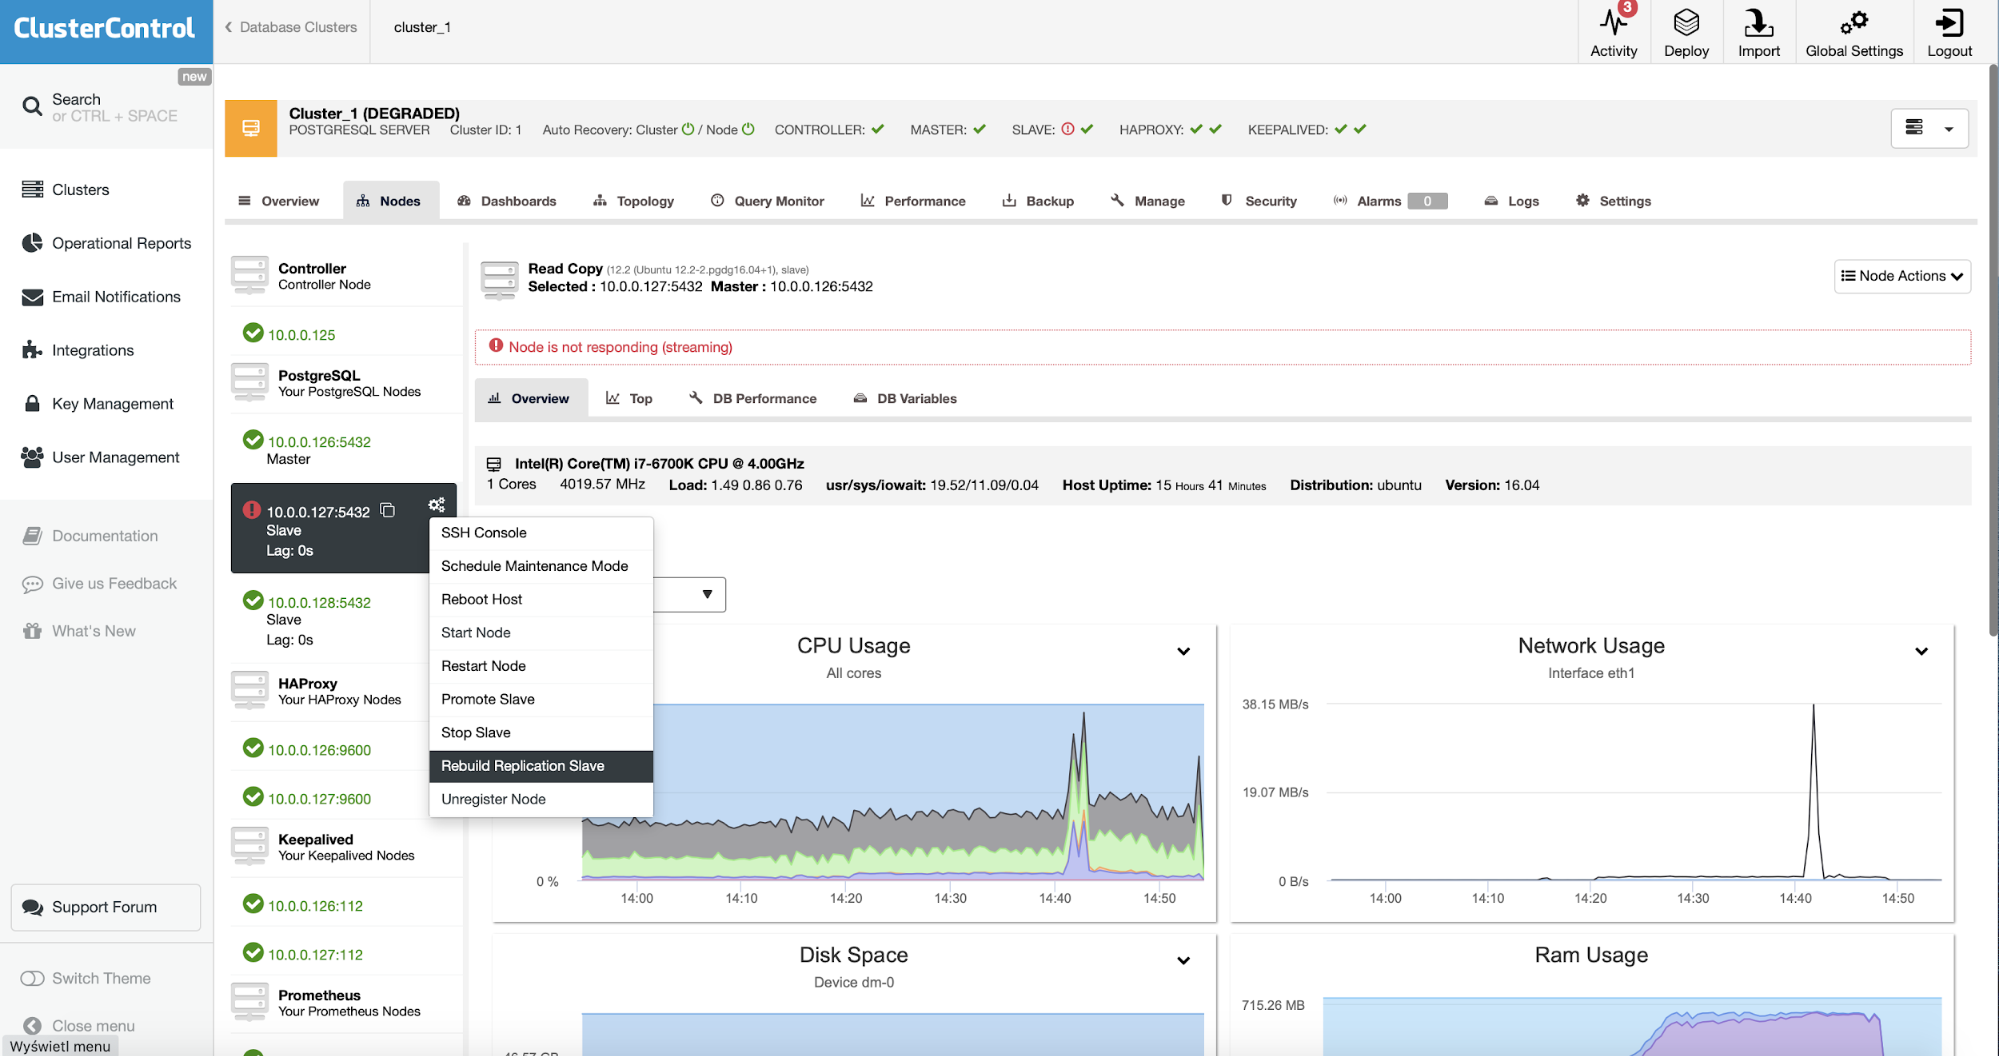
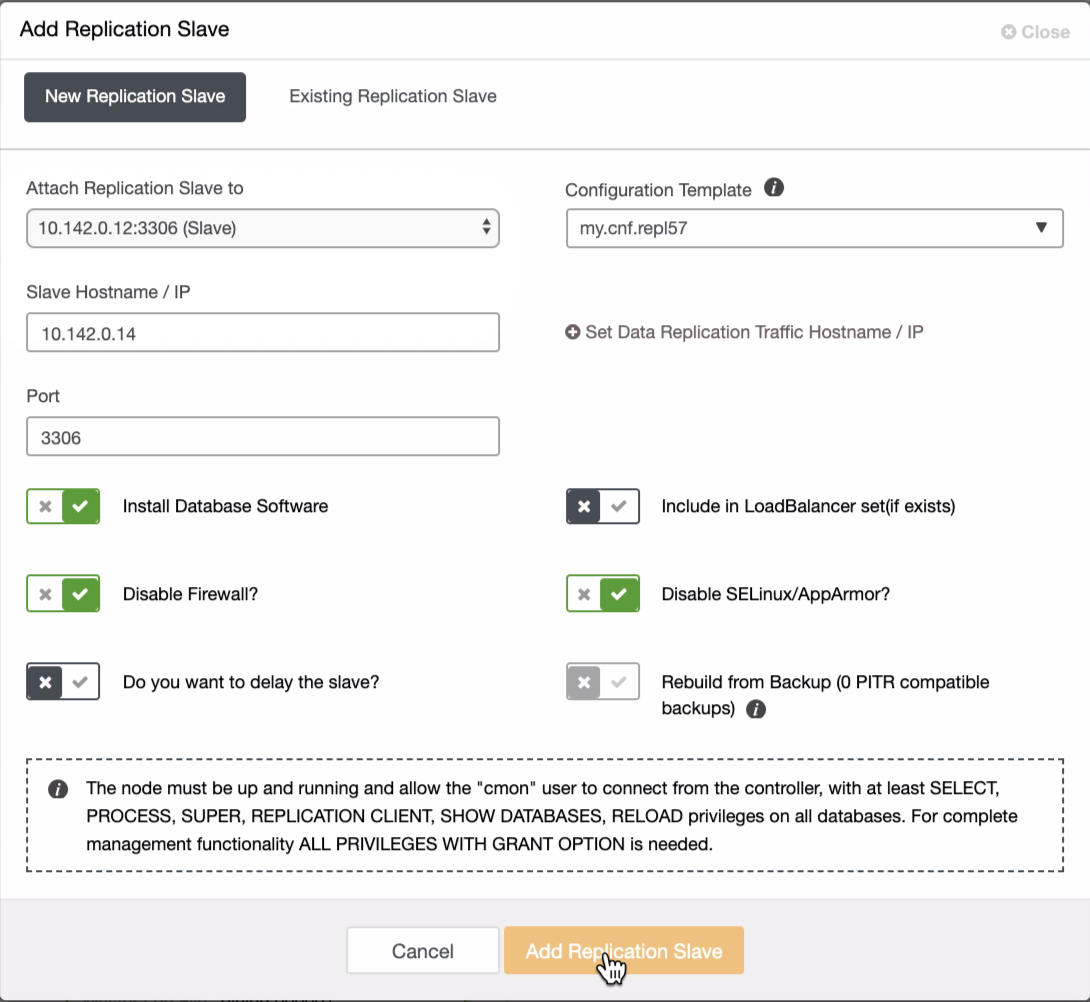
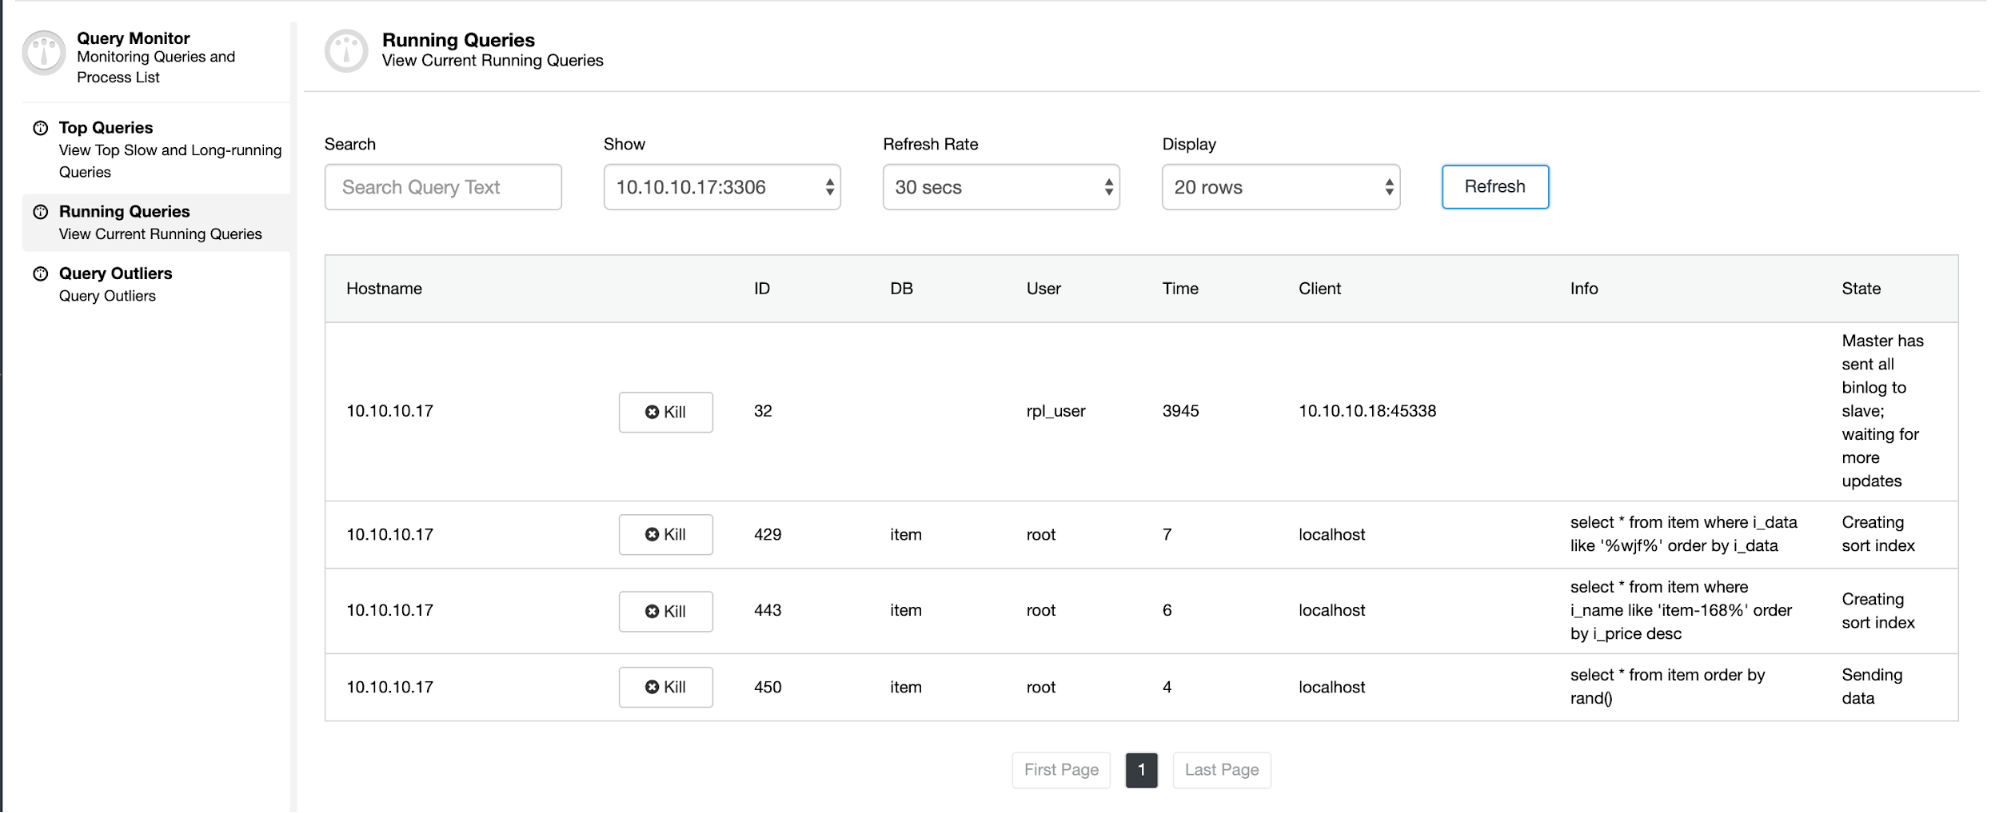
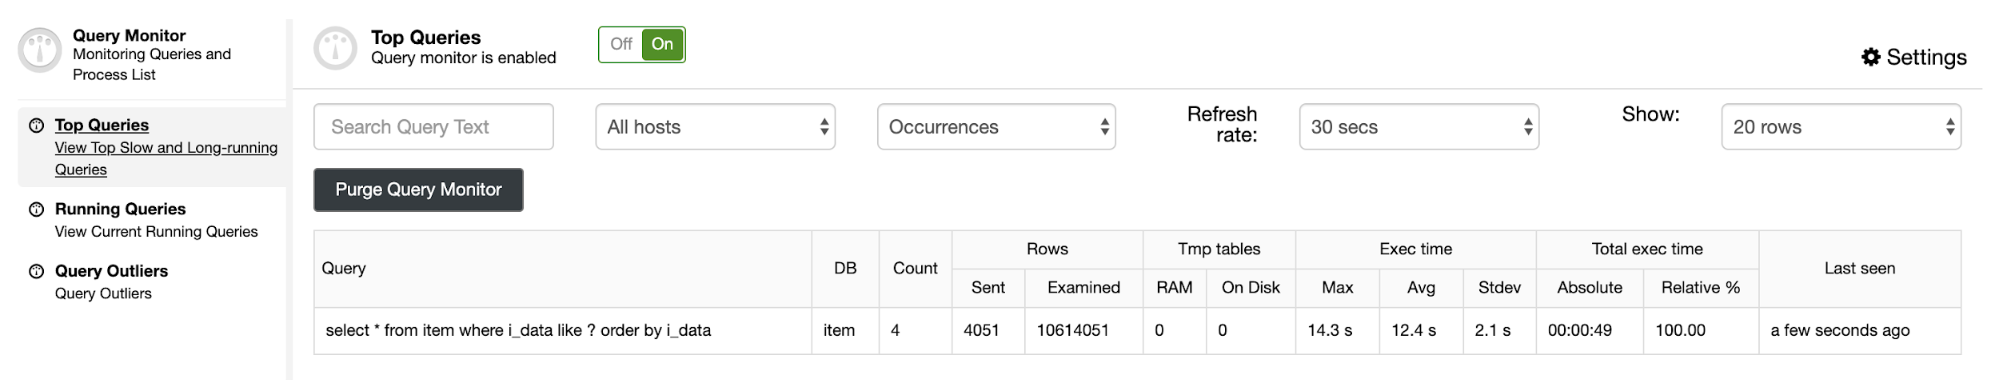
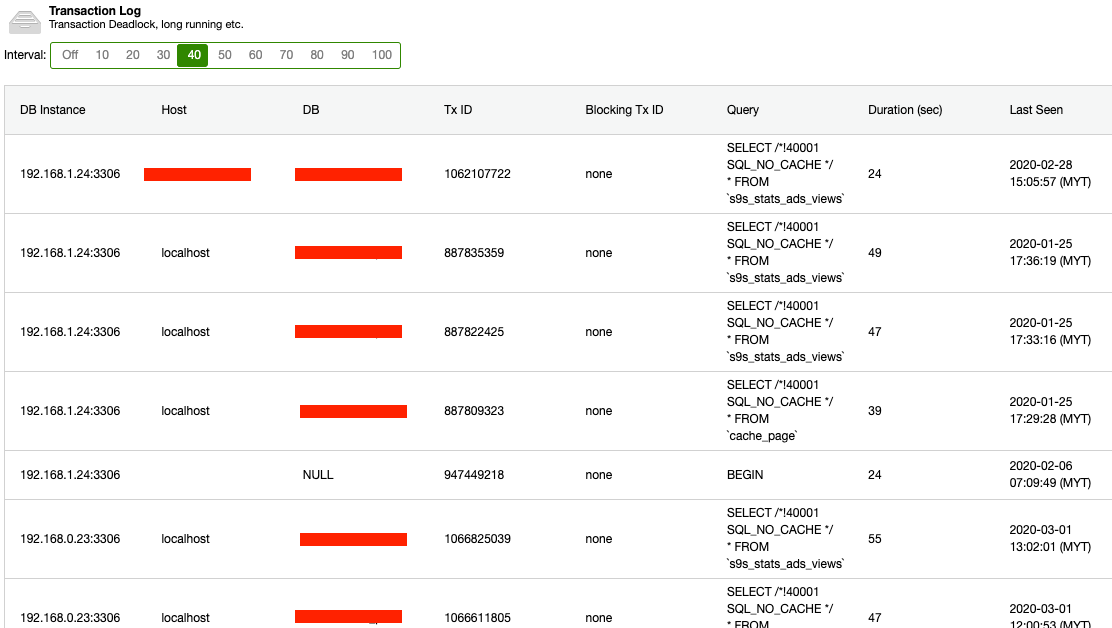
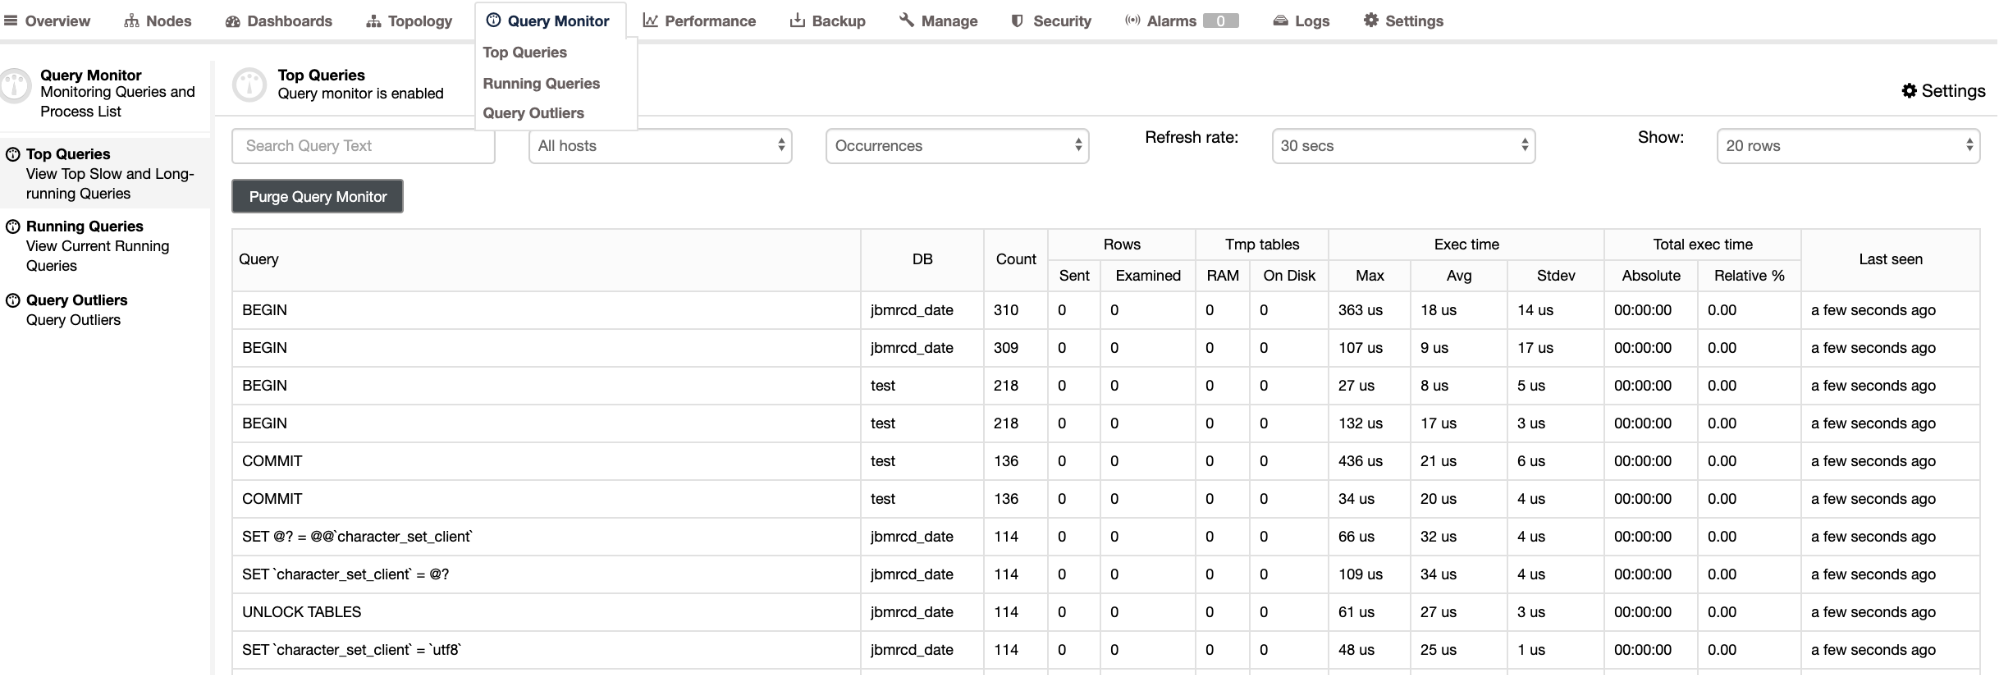
Using ClusterControl offers you a one-stop utility tool where you can also check queries running to determine those processes (queries) that can impact high memory utilization. See below for an example,

Viewing the status variables of MySQL is quiet easy,

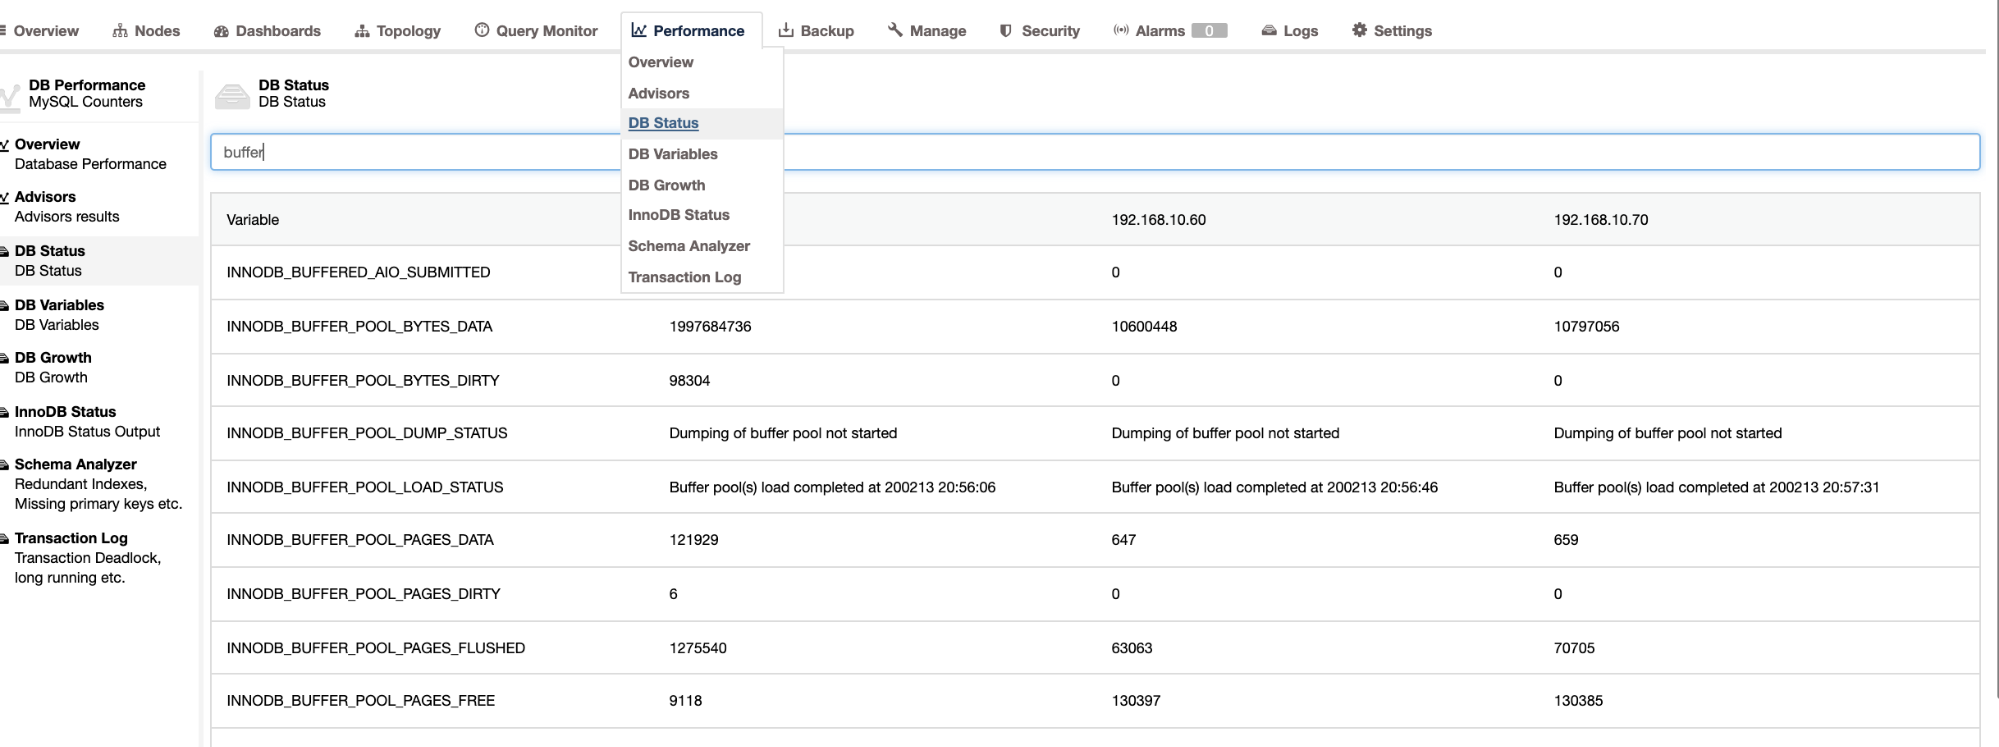
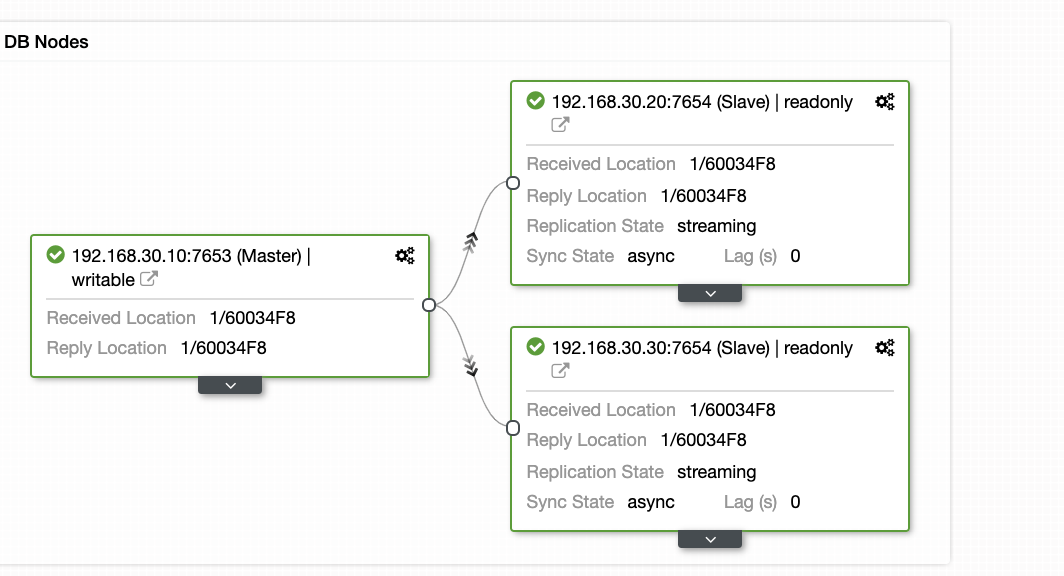
You can even go to Performance -> Innodb Status as well to reveal the current InnoDB status of your database nodes. Also, in ClusterControl, an incident is detected, it will try to collect incident and shows history as a report that provides you InnoDB status as shown in our previous blog about MySQL Freeze Frame.

Summary

Troubleshooting and diagnosing your MySQL database when suspecting high memory utilization isn't that difficult as long as you know the procedures and tools to use. Using the right tool offers you more flexibility and faster productivity to deliver fixes or solutions with a chance of greater result.


My PostgreSQL Database is Out of Disk Space

$
0
0

Disk space is a demanding resource nowadays. You usually will want to store data as long as possible, but this could be a problem if you don’t take the necessary actions to prevent a potential “out of disk space” issue. 

In this blog, we will see how we can detect this issue for PostgreSQL, prevent it, and if it is too late, some options that probably will help you to fix it.

How to Identify PostgreSQL Disk Space Issues

If you, unfortunately, are in this out of disk space situation, you will able to see some errors in the PostgreSQL database logs:

2020-02-20 19:18:18.131 UTC [4400] LOG:  could not close temporary statistics file "pg_stat_tmp/global.tmp": No space left on device

or even in your system log:

Feb 20 19:29:26 blog-pg1 rsyslogd: imjournal: fclose() failed for path: '/var/lib/rsyslog/imjournal.state.tmp': No space left on device [v8.24.0-41.el7_7.2 try http://www.rsyslog.com/e/2027 ]

PostgreSQL can continue works for awhile running read-only queries, but eventually, it will fail trying to write to disk, then you will see something like this in your client session:

WARNING:  terminating connection because of crash of another server process

DETAIL:  The postmaster has commanded this server process to roll back the current transaction and exit, because another server process exited abnormally and possibly corrupted shared memory.

HINT:  In a moment you should be able to reconnect to the database and repeat your command.

server closed the connection unexpectedly

This probably means the server terminated abnormally

before or while processing the request.

The connection to the server was lost. Attempting reset: Failed.

Then, if you take a look at the disk space, you will have this unwanted output…

$ df -h

Filesystem                        Size Used Avail Use% Mounted on

/dev/mapper/pve-vm--125--disk--0   30G 30G 0 100% /

How to Prevent PostgreSQL Disk Space Issues

The main way to prevent this kind of issue is by monitoring the disk space usage, and database or disk usage growth. For this, a graph should be a friendly way to monitor the disk space increment:

PostgreSQL Disk Space - ClusterControl

And the same for the database growth:

PostgreSQL Database Growth - ClusterControl

Another important thing to monitor is the replication status. If you have a replica and, for some reason, this stops working, depending on the configuration, it could be possible that PostgreSQL store all the WAL files to restore the replica when it comes back.

PostgreSQL Topology

All this monitoring system doesn’t make sense without an alerting system to know when you need to take actions:

How to Fix PostgreSQL Disk Space Issues

Well, if you are facing this out of disk space issue even with the monitoring and alerting system implemented (or not), there are many options to try to fix this issue without data lost (or the less as possible).

What is Consuming Your Disk Space?

The first step should be determining where my disk space is. A best practice is having separate partitions, at least one separate partition for your database storage, so you can easily confirm if your database or your system is using excessive disk space. Another advantage of this is to minimize the damage. If your root partition is full, your database can still write in his own partition without issues.

Database Space Usage

Let’s see now some useful commands to check your database disk space usage.

A basic way to check the database space usage is checking the data directory in the filesystem:

$ du -sh /var/lib/pgsql/11/data/

819M /var/lib/pgsql/11/data/

Or if you have a separate partition for your data directory, you can use df -h directly.

The PostgreSQL command “\l+” list the databases adding the size information:

$ postgres=# \l+

                                                               List of databases

   Name    | Owner   | Encoding | Collate | Ctype |   Access privileges | Size | Tablespace

|                Description

-----------+----------+-----------+---------+-------+-----------------------+---------+------------

+--------------------------------------------

 postgres  | postgres | SQL_ASCII | C       | C | | 7965 kB | pg_default

| default administrative connection database

 template0 | postgres | SQL_ASCII | C       | C | =c/postgres +| 7817 kB | pg_default

| unmodifiable empty database

           |          | |         | | postgres=CTc/postgres |         |

|

 template1 | postgres | SQL_ASCII | C       | C | =c/postgres +| 7817 kB | pg_default

| default template for new databases

           |          | |         | | postgres=CTc/postgres |         |

|

 world     | postgres | SQL_ASCII | C       | C | | 8629 kB | pg_default

|

(4 rows)

Using pg_database_size and the database name you can see the database size:

postgres=# SELECT pg_database_size('world');

 pg_database_size

------------------

          8835743

(1 row)

And using the pg_size_pretty to see this value in a human-readable way could be even better:

postgres=# SELECT pg_size_pretty(pg_database_size('world'));

 pg_size_pretty

----------------

 8629 kB

(1 row)

When you know where space is, you can take the corresponding action to fix it. Keep in mind that just deleting rows is not enough to recover the disk space, you will need to run a VACUUM or VACUUM FULL to finish the task. 

Log Files

The easiest way to recover disk space is by deleting log files. You can check the PostgreSQL log directory or even the system logs to verify if you can gain some space from there. If you have something like this:

$ du -sh /var/lib/pgsql/11/data/log/

18G /var/lib/pgsql/11/data/log/

You should check the directory content to see if there is a log rotation/retention problem or something is happening in your database and writing it to the logs.

$ ls -lah /var/lib/pgsql/11/data/log/

total 18G

drwx------  2 postgres postgres 4.0K Feb 21 00:00 .

drwx------ 21 postgres postgres 4.0K Feb 21 00:00 ..

-rw-------  1 postgres postgres  18G Feb 21 14:46 postgresql-Fri.log

-rw-------  1 postgres postgres 9.3K Feb 20 22:52 postgresql-Thu.log

-rw-------  1 postgres postgres 3.3K Feb 19 22:36 postgresql-Wed.log

Before deleting the logs, if you have a huge one, a good practice is to keep the last 100 lines or so, and then delete it. So, you can check what is happening after generating free space.

$ tail -100 postgresql-Fri.log > /tmp/log_temp.log

And then:

$ cat /dev/null > /var/lib/pgsql/11/data/log/postgresql-Fri.log

If you just delete it with “rm” and the log file is being used by the PostgreSQL server (or another service) space won’t be released, so you should truncate this file using this cat /dev/null command instead.

This action is only for PostgreSQL and system log files. Don’t delete the pg_wal content or another PostgreSQL file as it could generate critical damage to your database.

Bloat

In a normal PostgreSQL operation, tuples that are deleted or obsoleted by an update are not physically removed from the table; they are present until a VACUUM is performed. So, it is necessary to do the VACUUM periodically (AUTOVACUUM), especially in frequently-updated tables.

The problem here is space is not returned to the operating system using just VACUUM, it is only available for use in the same table.

VACUUM FULL rewrites the table into a new disk file, returning the unused space to the operating system. Unfortunately, it requires an exclusive lock on each table while it is running.

You should check the tables to see if a VACUUM (FULL) process is required.

Replication Slots

If you are using replication slots, and it is not active for some reason:

postgres=# SELECT slot_name, slot_type, active FROM pg_replication_slots;

 slot_name | slot_type | active

-----------+-----------+--------

 slot1     | physical  | f

(1 row)

It could be a problem for your disk space because it will store the WAL files until they have been received by all the standby nodes.

The way to fix it is recovering the replica (if possible), or deleting the slot:

postgres=# SELECT pg_drop_replication_slot('slot1');

 pg_drop_replication_slot

--------------------------

(1 row)

So, the space used by the WAL files will be released.

Conclusion

As we mentioned, monitoring and alerting systems are the keys to avoiding these kinds of issues. In this way, ClusterControl can help you to have your systems up and running, sending you alarms when needed or even taking recovery action to keep your database cluster working. You can also deploy/import different database technologies and scaling them out if needed.

How to Identify PostgreSQL Performance Issues with Slow Queries

$
0
0

When working with OLTP (OnLine Transaction Processing) databases, query performance is paramount as it directly impacts the user experience. Slow queries mean that the application feels unresponsive and slow and this results in bad conversion rates, unhappy users, and all sets of problems. 

OLTP is one of the common use cases for PostgreSQL therefore you want your queries to run as smooth as possible. In this blog we’d like to talk about how you can identify problems with slow queries in PostgreSQL.

Understanding the Slow Log

Generally speaking, the most typical way of identifying performance problems with PostgreSQL is to collect slow queries. There are a couple of ways you can do it. First, you can enable it on a single database:

pgbench=# ALTER DATABASE pgbench SET log_min_duration_statement=0;

ALTER DATABASE

After this all new connections to ‘pgbench’ database will be logged into PostgreSQL log.

It is also possible to enable this globally by adding:

log_min_duration_statement = 0

to PostgreSQL configuration and then reload config:

pgbench=# SELECT pg_reload_conf();

 pg_reload_conf

----------------

 t

(1 row)

This enables logging of all queries across all of the databases in your PostgreSQL. If you do not see any logs, you may want to enable logging_collector = on as well. The logs will include all of the traffic coming to PostgreSQL system tables, making it more noisy. For our purposes let’s stick to the database level logging.

What you’ll see in the log are entries as below:

2020-02-21 09:45:39.022 UTC [13542] LOG:  duration: 0.145 ms statement: SELECT abalance FROM pgbench_accounts WHERE aid = 29817899;

2020-02-21 09:45:39.022 UTC [13544] LOG:  duration: 0.107 ms statement: SELECT abalance FROM pgbench_accounts WHERE aid = 11782597;

2020-02-21 09:45:39.022 UTC [13529] LOG:  duration: 0.065 ms statement: SELECT abalance FROM pgbench_accounts WHERE aid = 16318529;

2020-02-21 09:45:39.022 UTC [13529] LOG:  duration: 0.082 ms statement: UPDATE pgbench_tellers SET tbalance = tbalance + 3063 WHERE tid = 3244;

2020-02-21 09:45:39.022 UTC [13526] LOG:  duration: 16.450 ms statement: UPDATE pgbench_branches SET bbalance = bbalance + 1359 WHERE bid = 195;

2020-02-21 09:45:39.023 UTC [13523] LOG:  duration: 15.824 ms statement: UPDATE pgbench_accounts SET abalance = abalance + -3726 WHERE aid = 5290358;

2020-02-21 09:45:39.023 UTC [13542] LOG:  duration: 0.107 ms statement: UPDATE pgbench_tellers SET tbalance = tbalance + -2716 WHERE tid = 1794;

2020-02-21 09:45:39.024 UTC [13544] LOG:  duration: 0.112 ms statement: UPDATE pgbench_tellers SET tbalance = tbalance + -3814 WHERE tid = 278;

2020-02-21 09:45:39.024 UTC [13526] LOG:  duration: 0.060 ms statement: INSERT INTO pgbench_history (tid, bid, aid, delta, mtime) VALUES (4876, 195, 39955137, 1359, CURRENT_TIMESTAMP);

2020-02-21 09:45:39.024 UTC [13529] LOG:  duration: 0.081 ms statement: UPDATE pgbench_branches SET bbalance = bbalance + 3063 WHERE bid = 369;

2020-02-21 09:45:39.024 UTC [13523] LOG:  duration: 0.063 ms statement: SELECT abalance FROM pgbench_accounts WHERE aid = 5290358;

2020-02-21 09:45:39.024 UTC [13542] LOG:  duration: 0.100 ms statement: UPDATE pgbench_branches SET bbalance = bbalance + -2716 WHERE bid = 210;

2020-02-21 09:45:39.026 UTC [13523] LOG:  duration: 0.092 ms statement: UPDATE pgbench_tellers SET tbalance = tbalance + -3726 WHERE tid = 67;

2020-02-21 09:45:39.026 UTC [13529] LOG:  duration: 0.090 ms statement: INSERT INTO pgbench_history (tid, bid, aid, delta, mtime) VALUES (3244, 369, 16318529, 3063, CURRENT_TIMESTAMP);

You can see information about the query and its duration. Not much else but it’s definitely a good place to start. The main thing to keep in mind is that not every slow query is a problem. Sometimes queries have to access a significant amount of data and it is expected for them to take longer to access and analyze all of the information user asked for. Another question is what “slow” means? This mostly depends on the application. If we are talking about interactive applications, most likely anything slower than a second is noticeable. Ideally everything is executed within 100 - 200 milliseconds limit.

Developing a Query Execution Plan

Once we determine that given query is indeed something we want to improve, we should take a look at the query execution plan. First of all, it may happen that there’s nothing we can do about it and we’ll have to accept that given query is just slow. Second, query execution plans may change. Optimizers always try to pick the most optimal execution plan but they make their decisions based on just a sample of data therefore it may happen that the query execution plan changes in time. In PostgreSQL you can check the execution plan in two ways. First, the estimated execution plan, using EXPLAIN:

pgbench=# EXPLAIN SELECT abalance FROM pgbench_accounts WHERE aid = 5290358;

                                          QUERY PLAN

----------------------------------------------------------------------------------------------

 Index Scan using pgbench_accounts_pkey on pgbench_accounts  (cost=0.56..8.58 rows=1 width=4)

   Index Cond: (aid = 5290358)

As you can see, we are expected to access data using primary key lookup. If we want to double-check how exactly the query will be executed, we can use EXPLAIN ANALYZE:

pgbench=# EXPLAIN ANALYZE SELECT abalance FROM pgbench_accounts WHERE aid = 5290358;

                                                               QUERY PLAN

----------------------------------------------------------------------------------------------------------------------------------------

 Index Scan using pgbench_accounts_pkey on pgbench_accounts  (cost=0.56..8.58 rows=1 width=4) (actual time=0.046..0.065 rows=1 loops=1)

   Index Cond: (aid = 5290358)

 Planning time: 0.053 ms

 Execution time: 0.084 ms

(4 rows)

Now, PostgreSQL has executed this query and it can tell us not just the estimates but exact numbers when it comes to the execution plan, number of rows accessed and so on. Please keep in mind that logging all of the queries may become a serious overhead on your system. You should also keep an eye on the logs and ensure they are properly rotated.

Pg_stat_statements

Pg_stat_statements is the extension that collects execution statistics for different query types.

pgbench=# select query, calls, total_time, min_time, max_time, mean_time, stddev_time, rows from public.pg_stat_statements order by calls desc LIMIT 10;

                                                query                                                 | calls | total_time | min_time | max_time |     mean_time | stddev_time | rows

------------------------------------------------------------------------------------------------------+-------+------------------+----------+------------+---------------------+---------------------+-------

 UPDATE pgbench_branches SET bbalance = bbalance + $1 WHERE bid = $2                                  | 30437 | 6636.83641200002 | 0.006533 | 83.832148 | 0.218051595492329 | 1.84977058799388 | 30437

 BEGIN                                                                                                | 30437 | 231.095600000001 | 0.000205 | 20.260355 | 0.00759258796859083 | 0.26671126085716 | 0

 END                                                                                                  | 30437 | 229.483213999999 | 0.000211 | 16.980678 | 0.0075396134310215 | 0.223837608828596 | 0

 UPDATE pgbench_accounts SET abalance = abalance + $1 WHERE aid = $2                                  | 30437 | 290021.784321001 | 0.019568 | 805.171845 | 9.52859297305914 | 13.6632712046825 | 30437

 UPDATE pgbench_tellers SET tbalance = tbalance + $1 WHERE tid = $2                                   | 30437 | 6667.27243200002 | 0.00732 | 212.479269 | 0.219051563294674 | 2.13585110968012 | 30437

 SELECT abalance FROM pgbench_accounts WHERE aid = $1                                                 | 30437 | 3702.19730600006 | 0.00627 | 38.860846 | 0.121634763807208 | 1.07735927551245 | 30437

 INSERT INTO pgbench_history (tid, bid, aid, delta, mtime) VALUES ($1, $2, $3, $4, CURRENT_TIMESTAMP) | 30437 | 2349.22475800002 | 0.003218 |  61.372127 | 0.0771831901304325 | 0.971590327400244 | 30437

 SELECT $1                                                                                            | 6847 | 60.785467 | 0.002321 | 7.882384 | 0.00887767883744706 | 0.105198744982906 | 6847

 insert into pgbench_tellers(tid,bid,tbalance) values ($1,$2,$3)                                      | 5000 | 18.592042 | 0.001572 | 0.741427 | 0.0037184084 | 0.0137660355678027 | 5000

 insert into pgbench_tellers(tid,bid,tbalance) values ($1,$2,$3)                                      | 3000 | 7.323788 | 0.001598 | 0.40152 | 0.00244126266666667 | 0.00834442591085048 | 3000

(10 rows)

As you can see on the data above, we have a list of different queries and information about their execution times - this is just a part of the data you can see in the pg_stat_statements but it is enough for us to understand that our primary key lookup takes sometimes almost 39 seconds to complete - this does not look good and it is definitely something we want to investigate.

If you do not have pg_stat_statements enabled, you can do it in a standard way. Either via configuration file and

shared_preload_libraries = 'pg_stat_statements'

Or you can enable it via PostgreSQL command line:

pgbench=# CREATE EXTENSION pg_stat_statements;

CREATE EXTENSION

Using ClusterControl to Eliminate Slow Queries

If you happen to use ClusterControl to manage your PostgreSQL database, you can use it to collect data about slow queries.

As you can see, it collects data about query execution - rows sent and examined, execution time statistics and so on. With it you can easily pinpoint the most expensive queries, and see what the average and maximum execution times looks like. By default ClusterControl collects queries that took longer than 0.5 second to complete, you can change this in the settings:

Conclusion

This short blog by no means covers all of the aspects and tools helpful in identifying and solving query performance problems in PostgreSQL. We hope it is a good start and that it will help you to understand what you can do to pinpoint the root cause of the slow queries.

How to Protect Your MySQL & MariaDB Database Against Cyberattacks When on a Public Network

$
0
0

It is sometimes inevitable to run MySQL database servers on a public or exposed network. This is a common setup in a shared hosting environment, where a server is configured with multiple services and often running within the same server as the database server. For those who have this kind of setup, you should always have some kind of protection against cyberattacks like denial-of-service, hacking, cracking, data breaches; all which can result in data loss. These are things that we always want to avoid for our database server. 

Here are some of the tips that we can do to improve our MySQL or MariaDB security.

Scan Your Database Servers Regularly

Protection against any malicious files in the server is very critical. Scan the server regularly to look for any viruses, spywares, malwares or rootkits especially if the database server is co-located with other services like mail server, HTTP, FTP, DNS, WebDAV, telnet and so on. Commonly, most of the database hacked issues originated from the application tier that is facing the public network. Thus, it's important to scan all files, especially web/application files since they are one of the entry points to get into the server. If those are compromised, the hacker can get into the application directory, and have the ability to read the application files. These might contain sensitive information, for instance, the database login credentials. 

ClamAV is one of the most widely known and widely trusted antivirus solutions for a variety of operating systems, including Linux. It's free and very easy to install and comes with a fairly good detection mechanism to look for unwanted things in your server. Schedule periodic scans in the cron job, for example:

0 3 * * * /bin/freshclam ; /bin/clamscan / --recursive=yes -i > /tmp/clamav.log ; mail -s clamav_log_`hostname` monitor@mydomain.local < /tmp/clamav.log

The above will update the ClamAV virus database, scan all directories and files and send you an email on the status of the execution and report every day at 3 AM.

Use Stricter User Roles and Privileges

When creating a MySQL user, do not allow all hosts to access the MySQL server with wildcard host (%). You should scan your MySQL host and look for any wildcard host value, as shown in the following statement:

mysql> SELECT user,host FROM mysql.user WHERE host = '%';
+---------+------+
| user    | host |
+---------+------+
| myadmin | %    |
| sbtest  | %    |
| user1   | %    |
+---------+------+

From the above output, strict or remove all users that have only '%' value under Host column. Users that need to access the MySQL server remotely can be enforced to use SSH tunnelling method, which does not require remote host configuration for MySQL users. Most of the MySQL administration clients such as MySQL Workbench and HeidiSQL can be configured to connect to a MySQL server via SSH tunelling, therefore it's possible to completely eliminate remote connection for MySQL users.

Also, limit the SUPER privilege to only users from localhost, or connecting via UNIX socket file. Be more cautious when assigning FILE privilege to non-root users since it permits read and write files on the server using theLOAD DATA INFILE and SELECT ... INTO OUTFILE statements. Any user to whom this privilege is granted can also read or write any file that the MySQL server can read or write.

Change the Database Default Settings

By moving away from the default setup, naming and configurations, we can reduce the attack vector to a number of folds. The following actions are some examples on default configurations that DBAs could easily change but commonly overlooked related to MySQL:

  • Change default MySQL port to other than 3306.
  • Rename the MySQL root username to other than "root".
  • Enforce password expiration and reduce the password lifetime for all users.
  • If MySQL is co-located with the application servers, enforce connection through UNIX socket file only, and stop listening on port 3306 for all IP addresses.
  • Enforce client-server encryption and server-server replication encryption.

We actually have covered this in detail in this blog post, How to Secure MySQL/MariaDB Servers.

Setup a Delayed Slave

A delayed slave is just a typical slave, however the slave server intentionally executes transactions later than the master by at least a specified amount of time, available from MySQL 5.6. Basically, an event received from the master is not executed until at least N seconds later than its execution on the master. The result is that the slave will reflect the state of the master some time back in the past.

A delayed slave can be used to recover data, which would be helpful when the problem is found immediately, within the period of delay. Suppose we configured a slave with a 6-hour delay from the master. If our database were modified or deleted (accidentally by a developer or deliberately by a hacker) within this time range, there is a possibility for us to revert to the moment right before it happened by stopping the current master, then bringing the slave server up until certain point with the following command:

# on delayed slave
mysql> STOP SLAVE;
mysql> START SLAVE UNTIL MASTER_LOG_FILE='xxxxx', MASTER_LOG_POS=yyyyyy;

Where 'xxxxx' is the binary log file and 'yyyyy' is the position right before the disaster happens (use mysqlbinlog tool to examine those events). Finally, promote the slave to become the new master and your MySQL service is now back operational as usual. This method is probably the fastest way to recover your MySQL database in production environment without having to reload a backup. Having a number of delayed slaves with different length durations, as shown in this blog, Multiple Delayed Replication Slaves for Disaster Recovery with Low RTO on how to set up a cost-effective delayed replication servers on top of Docker containers.

Enable Binary Logging

Binary logging is generally recommended to be enabled even though you are running on a standalone MySQL/MariaDB server. The binary log contains information about SQL statements that modify database contents. The information is stored in the form of "events" that describe the modifications. Despite performance impact, having binary log allows you to have the possibility to replay your database server to the exact point where you want it to be restored, also known as point-in-time recovery (PITR). Binary logging is also mandatory for replication. 

With binary logging enabled, one has to include the binary log file and position information when taking up a full backup. For mysqldump, using the --master-data flag with value 1 or 2 will print out the necessary information that we can use as a starting point to roll forward the database when replaying the binary logs later on. 

With binary logging enabled, you can use another cool recovery feature called flashback, which is described in the next section.

Enable Flashback

The flashback feature is available in MariaDB, where you can restore back the data to the previous snapshot in a MySQL database or in a table. Flashback uses the mysqlbinlog to create the rollback statements and it needs a FULL binary log row image for that. Thus, to use this feature, the MySQL/MariaDB server must be configured with the following:

[mysqld]
...
binlog_format = ROW
binlog_row_image = FULL

The following architecture diagram illustrates how flashback is configured on one of the slave:

To perform the flashback operation, firstly you have to determine the date and time when you want to "see" the data, or binary log file and position. Then, use the --flashback flag with mysqlbinlog utility to generate SQL statements to rollback the data to that point. In the generated SQL file, you will notice that the DELETE events are converted to INSERTs and vice versa, and also it swaps WHERE and SET parts of the UPDATE events. 

The following command line should be executed on the slave2 (configured with binlog_row_image=FULL):

$ mysqlbinlog --flashback --start-datetime="2020-02-17 01:30:00"  /var/lib/mysql/mysql-bin.000028 -v --database=shop --table=products > flashback_to_2020-02-17_013000.sql

Then, detach slave2 from the replication chain because we are going to break it and use the server to rollback our data:

mysql> STOP SLAVE;
mysql> RESET MASTER;
mysql> RESET SLAVE ALL;

Finally, import the generated SQL file into the MariaDB server for database shop on slave2:

$ mysql -u root -p shop < flashback_to_2020-02-17_013000.sql

When the above is applied, the table "products" will be at the state of 2020-02-17 01:30:00. Technically, the generated SQL file can be applied to both MariaDB and MySQL servers. You could also transfer the mysqlbinlog binary from MariaDB server so you can use the flashback feature on a MySQL server. However, MySQL GTID implementation is different than MariaDB thus restoring the SQL file requires you to disable MySQL GTID.

A couple of advantages using flashback is you do not need to stop the MySQL/MariaDB server to carry out this operation. When the amount of data to revert is small, the flashback process is much faster than recovering the data from a full backup. 

Log All Database Queries

General log basically captures every SQL statement being executed by the client in the MySQL server. However, this might not be a popular decision on a busy production server due to the performance impact and space consumption. If performance matters, binary log has the higher priority to be enabled. General log can be enabled during runtime by running the following commands:

mysql> SET global general_log_file='/tmp/mysql.log'; 
mysql> SET global log_output = 'file';
mysql> SET global general_log = ON;

You can also set the general log output to a table:

mysql> SET global log_output = 'table';

You can then use the standard SELECT statement against the mysql.general_log table to retrieve queries. Do expect a bit more performance impact when running with this configuration as shown in this blog post.

Otherwise, you can use external monitoring tools that can perform query sampling and monitoring so you can filter and audit the queries that come into the server. ClusterControl can be used to collect and summaries all your queries, as shown in the following screenshots where we filter all queries that contain DELETE string:

Similar information is also available under ProxySQL's top queries page (if your application is connecting via ProxySQL):

This can be used to track recent changes that have happened to the database server and can also be used for auditing purposes. 

Conclusion

Your MySQL and MariaDB servers must be well-protected at all times since it usually contains sensitive data that attackers are looking after. You may also use ClusterControl to manage the security aspects of your database servers, as showcased by this blog post, How to Secure Your Open Source Databases with ClusterControl.

What to Look for if Your PostgreSQL Replication is Lagging

$
0
0

Replication lag issues in PostgreSQL is not a widespread issue for most setups. Although, it can occur and when it does it can impact your production setups. PostgreSQL is designed to handle multiple threads, such as query parallelism or deploying worker threads to handle specific tasks based on the assigned values in the configuration. PostgreSQL is designed to handle heavy and stressful loads, but sometimes (due to a bad configuration) your server might still go south.

Identifying the replication lag in PostgreSQL is not a complicated task to do, but there are a few different approaches to look into the problem. In this blog, we'll take a look at what things to look at when your PostgreSQL replication is lagging.

Types of Replication in PostgreSQL

Before diving into the topic, let's see first how replication in PostgreSQL evolves as there are diverse set of approaches and solutions when dealing with replication.

Warm standby for PostgreSQL was implemented in version 8.2 (back in 2006) and was based on the log shipping method. This means that the WAL records are directly moved from one database server to another to be applied, or simply an analogous approach to PITR, or very much like what you are doing with rsync.

This approach, even old, is still used today and some institutions actually prefer this older approach. This approach implements a file-based log shipping by transferring WAL records one file (WAL segment) at a time. Though it has a downside; A major failure on the primary servers, transactions not yet shipped will be lost. There is a window for data loss (you can tune this by using the archive_timeout parameter, which can be set to as low as a few seconds, but such a low setting will substantially increase the bandwidth required for file shipping).

In PostgreSQL version 9.0, Streaming Replication was introduced. This feature allowed us to stay more up-to-date when compared to file-based log shipping. Its approach is by transferring WAL records (a WAL file is composed of WAL records) on the fly (merely a record based log shipping), between a master server and one or several standby servers. This protocol does not need to wait for the WAL file to be filled, unlike file-based log shipping. In practice, a process called WAL receiver, running on the standby server, will connect to the primary server using a TCP/IP connection. In the primary server, another process exists named WAL sender. It's role is in charge of sending the WAL registries to the standby server(s) as they happen.

Asynchronous Replication setups in streaming replication can incur problems such as data loss or slave lag, so version 9.1 introduces synchronous replication. In synchronous replication, each commit of a write transaction will wait until confirmation is received that the commit has been written to the write-ahead log on disk of both the primary and standby server. This method minimizes the possibility of data loss, as for that to happen we will need for both, the master and the standby to fail at the same time. 

The obvious downside of this configuration is that the response time for each write transaction increases, as we need to wait until all parties have responded. Unlike MySQL, there's no support such as in a semi-synchronous environment of MySQL, it will failback to asynchronous if timeout has occurred. So in With PostgreSQL, the time for a commit is (at minimum) the round trip between the primary and the standby. Read-only transactions will not be affected by that.

As it evolves, PostgreSQL is continuously improving and yet its replication is diverse. For example, you can use physical streaming asynchronous replication or use logical streaming replication. Both are monitored differently though use the same approach when sending data over replication, which is still streaming replication. For more details check in the manual for different types of solutions in PostgreSQL when dealing with replication.

Causes of PostgreSQL Replication Lag

As defined in our previous blog, a replication lag is the cost of delay for transaction(s) or operation(s) calculated by its time difference of execution between the primary/master against the standby/slave node.  

Since PostgreSQL is using streaming replication, it's designed to be fast as changes are recorded as a set of sequence of log records (byte-by-byte) as intercepted by the WAL receiver then writes these log records to the WAL file. Then the startup process by PostgreSQL replays the data from that WAL segment and streaming replication begins. In PostgreSQL, a replication lag can occur by these factors:

  • Network issues
  • Not able to find the WAL segment from the primary. Usually, this is due to the checkpointing behavior where WAL segments are rotated or recycled
  • Busy nodes (primary and standby(s)). Can be caused by external processes or some bad queries caused to be a resource intensive
  • Bad hardware or hardware issues causing to take some lag
  • Poor configuration in PostgreSQL such as small numbers of max_wal_senders being set while processing tons of transaction requests (or large volume of changes).

What To Look for With PostgreSQL Replication Lag

PostgreSQL replication is yet diverse but monitoring the replication health is subtle yet not complicated. In this approach we'll showcase are based on a primary-standby setup with asynchronous streaming replication. The logical replication cannot benefit most of the cases we're discussing here but the view pg_stat_subscription can help you collect information. However, we'll not focus on that in this blog.

Using pg_stat_replication View

The most common approach is to run a query referencing this view in the primary node. Remember, you can only harvest information from the primary node using this view. This view contains the following table definition based on PostgreSQL 11 as shown below:

postgres=# \d pg_stat_replication

                    View "pg_catalog.pg_stat_replication"

      Column      | Type           | Collation | Nullable | Default 

------------------+--------------------------+-----------+----------+---------

 pid              | integer           | | | 

 usesysid         | oid           | | | 

 usename          | name           | | | 

 application_name | text                     | | | 

 client_addr      | inet           | | | 

 client_hostname  | text           | | | 

 client_port      | integer           | | | 

 backend_start    | timestamp with time zone |           | | 

 backend_xmin     | xid           | | | 

 state            | text           | | | 

 sent_lsn         | pg_lsn           | | | 

 write_lsn        | pg_lsn           | | | 

 flush_lsn        | pg_lsn           | | | 

 replay_lsn       | pg_lsn           | | | 

 write_lag        | interval           | | | 

 flush_lag        | interval           | | | 

 replay_lag       | interval           | | | 

 sync_priority    | integer           | | | 

 sync_state       | text           | | | 

Where the fields are defined as (includes PG < 10 version),

  • pid: Process id of walsender process
  • usesysid: OID of user which is used for Streaming replication.
  • username: Name of user which is used for Streaming replication
  • application_name: Application name connected to master
  • client_addr: Address of standby/streaming replication
  • client_hostname: Hostname of standby.
  • client_port: TCP port number on which standby communicating with WAL sender
  • backend_start: Start time when SR connected to Master.
  • backend_xmin: standby's xmin horizon reported by hot_standby_feedback.
  • state: Current WAL sender state i.e streaming
  • sent_lsn/sent_location: Last transaction location sent to standby.
  • write_lsn/write_location: Last transaction written on disk at standby
  • flush_lsn/flush_location: Last transaction flush on disk at standby.
  • replay_lsn/replay_location: Last transaction flush on disk at standby.
  • write_lag: Elapsed time during committed WALs from primary to the standby (but not yet committed in the standby)
  • flush_lag: Elapsed time during committed WALs from primary to the standby (WAL's has already been flushed but not yet applied)
  • replay_lag: Elapsed time during committed WALs from primary to the standby (fully committed in standby node)
  • sync_priority: Priority of standby server being chosen as synchronous standby
  • sync_state: Sync State of standby (is it async or synchronous).

A sample query would look as follows in PostgreSQL 9.6,

paultest=# select * from pg_stat_replication;

-[ RECORD 1 ]----+------------------------------

pid              | 7174

usesysid         | 16385

usename          | cmon_replication

application_name | pgsql_1_node_1

client_addr      | 192.168.30.30

client_hostname  | 

client_port      | 10580

backend_start    | 2020-02-20 18:45:52.892062+00

backend_xmin     | 

state            | streaming

sent_location    | 1/9FD5D78

write_location   | 1/9FD5D78

flush_location   | 1/9FD5D78

replay_location  | 1/9FD5D78

sync_priority    | 0

sync_state       | async

-[ RECORD 2 ]----+------------------------------

pid              | 7175

usesysid         | 16385

usename          | cmon_replication

application_name | pgsql_80_node_2

client_addr      | 192.168.30.20

client_hostname  | 

client_port      | 60686

backend_start    | 2020-02-20 18:45:52.899446+00

backend_xmin     | 

state            | streaming

sent_location    | 1/9FD5D78

write_location   | 1/9FD5D78

flush_location   | 1/9FD5D78

replay_location  | 1/9FD5D78

sync_priority    | 0

sync_state       | async

This basically tells you what blocks of location in the WAL segments that have been written, flushed, or applied. It provides you a granular overlook of the replication status.

Queries to Use In the Standby Node

In the standby node, there are functions that are supported for which you can mitigate this into a query and provide you the overview of your standby replication's health. To do this, you can run the following query below (query is based on PG version > 10),

postgres=#  select pg_is_in_recovery(),pg_is_wal_replay_paused(), pg_last_wal_receive_lsn(), pg_last_wal_replay_lsn(), pg_last_xact_replay_timestamp();

-[ RECORD 1 ]-----------------+------------------------------

pg_is_in_recovery             | t

pg_is_wal_replay_paused       | f

pg_last_wal_receive_lsn       | 0/2705BDA0

pg_last_wal_replay_lsn        | 0/2705BDA0

pg_last_xact_replay_timestamp | 2020-02-21 02:18:54.603677+00

In older versions, you can use the following query:

postgres=# select pg_is_in_recovery(),pg_last_xlog_receive_location(), pg_last_xlog_replay_location(), pg_last_xact_replay_timestamp();

-[ RECORD 1 ]-----------------+------------------------------

pg_is_in_recovery             | t

pg_last_xlog_receive_location | 1/9FD6490

pg_last_xlog_replay_location  | 1/9FD6490

pg_last_xact_replay_timestamp | 2020-02-21 08:32:40.485958-06

What does the query tell? Functions are defined accordingly here,

  • pg_is_in_recovery(): (boolean) True if recovery is still in progress.
  • pg_last_wal_receive_lsn()/pg_last_xlog_receive_location():  (pg_lsn) The write-ahead log location received and synced to disk by streaming replication. 
  • pg_last_wal_replay_lsn()/pg_last_xlog_replay_location():  (pg_lsn) The last write-ahead log location replayed during recovery. If recovery is still in progress this will increase monotonically.
  • pg_last_xact_replay_timestamp():  (timestamp with time zone) Get timestamp of last transaction replayed during recovery. 

Using some basic math, you can combine these functions. The most common used function that are used by DBA's are,

SELECT CASE WHEN pg_last_wal_receive_lsn() = pg_last_wal_replay_lsn()

THEN 0

ELSE EXTRACT (EPOCH FROM now() - pg_last_xact_replay_timestamp())

END AS log_delay;

or in versions PG < 10,

SELECT CASE WHEN pg_last_xlog_receive_location() = pg_last_xlog_replay_location()

THEN 0

ELSE EXTRACT (EPOCH FROM now() - pg_last_xact_replay_timestamp())

END AS log_delay;

Although this query has been in-practice and is used by DBA's. Still, it doesn't provide you an accurate view of the lag. Why? Let's discuss this in the next section.

Identifying Lag Caused by WAL Segment's Absence

PostgreSQL standby nodes, which are in recovery mode, does not report to you the exact state of what's happening of your replication. Not unless you view the PG log, you can gather information of what's going on. There's no query you can run to determine this. In most cases, organizations and even small institutions come up with 3rd party softwares to let them be alerted when an alarm is raised. 

One of these is ClusterControl, which offers you observability, sends alerts when alarms are raised or recovers your node in case of disaster or catastrophe happens. Let's take this scenario, my primary-standby async streaming replication cluster has failed. How would you know if something's wrong? Let's combine the following:

Step 1: Determine if There's a Lag

postgres=# SELECT CASE WHEN pg_last_wal_receive_lsn() = pg_last_wal_replay_lsn()

postgres-# THEN 0

postgres-# ELSE EXTRACT (EPOCH FROM now() - pg_last_xact_replay_timestamp())

postgres-# END AS log_delay;

-[ RECORD 1 ]

log_delay | 0

Step 2: Determine the WAL Segments Received From the Primary and Compare with Standby Node

## Get the master's current LSN. Run the query below in the master

postgres=# SELECT pg_current_wal_lsn();

-[ RECORD 1 ]------+-----------

pg_current_wal_lsn | 0/925D7E70

For older versions of PG < 10, use pg_current_xlog_location.

## Get the current WAL segments received (flushed or applied/replayed)

postgres=# select pg_is_in_recovery(),pg_is_wal_replay_paused(), pg_last_wal_receive_lsn(), pg_last_wal_replay_lsn(), pg_last_xact_replay_timestamp();

-[ RECORD 1 ]-----------------+------------------------------

pg_is_in_recovery             | t

pg_is_wal_replay_paused       | f

pg_last_wal_receive_lsn       | 0/2705BDA0

pg_last_wal_replay_lsn        | 0/2705BDA0

pg_last_xact_replay_timestamp | 2020-02-21 02:18:54.603677+00

That seems to look bad. 

Step 3: Determine How Bad it Could Be

Now, let's mix the formula from step #1 and in step #2 and get the diff. How to do this, PostgreSQL has a function called pg_wal_lsn_diff which is defined as,

pg_wal_lsn_diff(lsn pg_lsn, lsn pg_lsn) / pg_xlog_location_diff (location pg_lsn, location pg_lsn):  (numeric) Calculate the difference between two write-ahead log locations

Now, let's use it to determine the lag. You can run it in any PG node, since it's we'll just provide the static values:

postgres=# select pg_wal_lsn_diff('0/925D7E70','0/2705BDA0');                                                                                                                                     -[ RECORD 1 ]---+-----------

pg_wal_lsn_diff | 1800913104

Let's estimate how much is 1800913104, that seems to be about 1.6GiB might have been absent in the standby node,

postgres=# select round(1800913104/pow(1024,3.0),2) missing_lsn_GiB;

-[ RECORD 1 ]---+-----

missing_lsn_gib | 1.68

Lastly, you can proceed or even prior to the query look at the logs like using tail -5f to follow and check what's going on. Do this for both primary/standby nodes. In this example, we'll see that it has a problem,

## Primary

root@debnode4:/var/lib/postgresql/11/main# tail -5f log/postgresql-2020-02-21_033512.log

2020-02-21 16:44:33.574 UTC [25023] ERROR:  requested WAL segment 000000030000000000000027 has already been removed

...


## Standby

root@debnode5:/var/lib/postgresql/11/main# tail -5f log/postgresql-2020-02-21_014137.log 

2020-02-21 16:45:23.599 UTC [26976] LOG:  started streaming WAL from primary at 0/27000000 on timeline 3

2020-02-21 16:45:23.599 UTC [26976] FATAL:  could not receive data from WAL stream: ERROR:  requested WAL segment 000000030000000000000027 has already been removed

...

When encountering this issue, it's better to rebuild your standby nodes. In ClusterControl, it's as easy as one click. Just go to the Nodes/Topology section, and rebuild the node just like below:

Other Things to Check

You can use the same approach in our previous blog (in MySQL), using system tools such as ps, top, iostat, netstat combination. For example, you can also get the current recovered WAL segment from the standby node,

root@debnode5:/var/lib/postgresql/11/main# ps axufwww|egrep "postgre[s].*startup"

postgres  8065 0.0 8.3 715820 170872 ?       Ss 01:41 0:03 \_ postgres: 11/main: startup   recovering 000000030000000000000027

How Can ClusterControl Help?

ClusterControl offers an efficient way on monitoring your database nodes from primary to the slave nodes. When going to the Overview tab, you have already the view of your replication health:

Basically, the two screenshots above displays how's the replication health and what's the current WAL segments. That's not at all. ClusterControl also shows the current activity of what's going on with your Cluster.

Conclusion

Monitoring the replication health in PostgreSQL can end up on a different approach as long as you are able to meet your needs. Using third party tools with observability that can notify you in case of catastrophe is your perfect route, whether an open source or enterprise. The most important thing is, you have your disaster recovery plan and business continuity planned ahead of such trouble.

Senior Engineering Manager

$
0
0

We are looking for a highly motivated, experienced Senior Engineering Manager to work closely with product management and business stakeholders.

Our microservices backend architecture and cloud platform provides an infrastructure to launch new innovative cloud services for the database monitoring and management market. 

You will lead a team of developers (frontend & backend) on our next generation cloud services and the on-premise product ClusterControl which is the leading monitoring and management application for open source databases and used by thousands of companies.

As a key leader on our team, you'll play a crucial role in maintaining and evolving Severalnines engineering culture and coaching individuals to achieve their very best. 

This is a team leadership position.

Key Job Responsibilities

  • Manage a team of developers responsible for Severalnines products
  • Own your team’s technical strategy and roadmap in close collaboration with Product, Design, and Operations
  • Be a visionary and propose, drive improvements to our cloud services and ClusterControl
  • Work with your team to help understand requirements, evaluate new features and architecture and help drive decisions
  • Collaborate with CTO and Product Management to contribute to the strategic direction of the company.
  • Build and foster a high performance culture, mentor team members and provide your team with the tools and motivation to make things happen
  • Attend daily standup meetings, manage releases and patch builds, collaborate with customer support

Essential Qualifications

  • Previously managed teams of engineers with ownership of high scale, cloud based production systems
  • Proven experience managing fully remote technical teams and resolve complex and ambiguous issues both from a business and technical perspective
  • Track record of delivering projects and collaborating with leaders across the organization: including CTO, Product, Design, and Operations
  • Prior domain experience working with cloud services and/or database management solutions
  • Experienced in one or more of the tech stack and tools in use today within the team that includes AWS, Google Cloud, Jenkins/TeamCity CI/CD, Atlassian tools (JIRA/Confluence), gRPC, Go, React, AngularJS, C++, Open-source DBs
  • Expert experience with development processes and methodologies such as Kanban or Scrum
  • Expertise and passion for developing others through regular coaching and mentoring, 1:1s, and performance reviews
  • Excellent communication and written skills
  • A hands-on attitude and a willingness to get things done

Additional Details

We’re a software startup with a globally distributed team. As we don’t have any offices, you will be working remotely; in other words, we all work from our homes. Therefore, a good laptop and access to a reliable, high-speed Internet connection are required. The company is based in Europe and although no travel is required, we do encourage attendance at our annual meeting which rotates cities. Contact us to find out more about the working life at Severalnines!

An Introduction to Percona Server for MongoDB 4.2

$
0
0

When choosing a NoSQL database technology important considerations should be taken into account, such as performance, resilience, reliability, and security. These key factors should also be aligned with achieving business goals, at least as far as the database is concerned. 

Many technologies have come into play to improve these aspects, and it is advisable for an organisation to improve the salient options and try integrating them into the database systems. 

New technologies should ensure maximum performance to enhance achievement of business goals at an affordable operating cost but with more manipulative features such as error detection and alerting systems.

In this blog we will discuss the Percona version of MongoDB and how it expands the power of MongoDB in a variety of ways.

What is Percona Server for MongoDB?

For a database to perform well, there must be an optimally established underlying server for enhancing read and write transactions. Percona Server for MongoDB is a free open-source drop-in replacement for the MongoDB Community Edition, but with additional enterprise-grade functionality. It is designed with some major improvements on the default MongoDB server setup. 

It delivers high performance, improved security, and reliability for optimum performance with reduced expenditure on proprietary software vendor relationships. 

Percona Server for MongoDB Salient Features

MongoDB Community Edition is core to the Percona server considering that it already constitutes important features such as the flexible schema, distributed transactions, familiarity of the JSON documents and native high availability. Besides this, Percona Server for MongoDB integrates the following salient features that enables it to satisfy the aspects we have mentioned above:

  • Hot Backups
  • Data at rest encryption
  • Audit Logging
  • Percona Memory Engine
  • External LDAP Authentication with SASL
  • HashiCorp Vault Integration
  • Enhanced query profiling

Hot Backups 

Percona server for MongoDB creates a physical data backup on a running server in the background without any noticeable operation degradation. This is achievable by running the createBackup command as an administrator on the admin database and specifying the backup directory. 

> use admin

switched to db admin

> db.runCommand({createBackup: 1, backupDir: "/my/backup/data/path"})

{ "ok" : 1 }

When you receive {"ok" : 1 } then the backup was successful. Otherwise, if for example you specify an empty backup directory path, you may receive an error response i.e:

{ "ok" : 0, "errmsg" : "Destination path must be absolute" }

Restoring the backup requires one to first stop the mongod instance, clean the data directory, copy the files from the directory and then restart the mongod service. This can be done by running the command below

$ service mongod stop && rm -rf /var/lib/mongodb/* && cp --recursive /my/backup/data/path /var/lib/mongodb/ && service mongod start

You can also store the backup in archive format if using Percona server for MongoDB 4.2.1-1 

> use admin

> db.runCommand({createBackup: 1, archive: "path/to/archive.tar" })

You can also backup directly to AWS S3 using the default settings or with more configurations. For a default S3 bucket backup:

> db.runCommand({createBackup: 1,  s3: {bucket: "backup", path: "newBackup"}})

Data-at-Rest Encryption

MongoDB version 3.2 introduced data at rest encryption for the WiredTiger storage engine towards ensuring that data files can be decrypted and read by parties with decryption key only. Data encryption at rest in Percona Server for MongoDB was introduced in version 3.6 to go in hand with data encryption at rest interface in MongoDB. However the latest version does not include support for Amazon AWS and KIMP key management services.

The encryption can also be applied to rollback files when data at rest is enabled. Percona Server for MongoDB uses encryptionCipherMode option with 2 selective cipher modes:

  1. AES256-CBC (default cipher mode)
  2. AES256-GCM

You can encrypt data with the command below

$ mongod ... --encryptionCipherMode or 

$ mongod ... --encryptionCipherMode AES256-GCM

We use the --ecryptionKeyFile option to specify the path to a file that contains the encryption key.

$ mongod ... --enableEncryption --encryptionKeyFile <fileName>

Audit Logging

For every database system, administrators have a mandate to keep track on activities taking place. In Percona Server for MongoDB, when auditing is enabled, the server generates an audit log file than constitutes information about different user events such as authorization and authentication. However, starting the server with auditing enabled, the logs won’t be displayed dynamically during runtime. 

The Audit Logging in MongoDB Community Edition can take two data formats that is, JSON and BSON. However, for Percona Server for MongoDB, audit logging is limited to JSON file only. The server also logs only important commands contrary to MongoDB that logs everything. Since the filtering procedure in Percona is so unclear in terms of the filtering syntax, enabling the audit log without filtering would offer more entries from which one can narrow down to own specifications.

Percona Memory Engine

This is a special configuration of the WiredTiger storage engine that does not store user data on disk. The data fully resides and is readily available in the main memory except for diagnostic data that is written to disk. This makes data processing much faster but with a consideration that you must ensure there is enough memory to hold the data set and the server should not shut down. One can select a storage engine to use with the  --storageEngine command. Data created for one storage engine cannot be compatible with other storage engines because each storage engine has its own data model. For instance to select the in-memory storage engine. You first stop any running mongod instance and then issue the commands:

$ service mongod stop

$ mongod --storageEngine inMemory --dbpath <newDataDir>

If you already have some data with your default MongoDB Community edition and you would like to migrate to Percona Memory Engine, just use the mongodumb and mongorestore utilities by issuing the command:

$ mongodump --out <dumpDir>

$ service mongod stop

$ rm -rf /var/lib/mongodb/*

$ sed -i '/engine: .*inMemory/s/#//g' /etc/mongod.conf

$ service mongod start

$ mongorestore <dumpDir>

External LDAP Authentication With SASL

Whenever  clients make either  a read or write request to MongoDB mongod instance, they need to authenticate against the MongoDB server user database first. The external authentication allows the MongoDB server to verify the client credentials (username and password) against a separate service. The external authentication architecture involves:

  1. LDAP Server which remotely stores all user credentials
  2. SASL Daemon that is used as a MongoDB server-local proxy for the remote LDAP service.
  3. SASL Library: creates necessary authentication data for MongoDB client and server.

Authentication session sequence

  • The Client gets connected to a running mongod instance and creates a PLAIN authentication request using the SASL library.
  • The auth request is then sent to the server as a special Mongo command which is then received by the mongod server with its request payload.
  • The server creates some SASL sessions derived with client credentials using its own reference to the SASL library.
  • The mongod server passes the auth payload to the SASL library which hands it over to the saslauthd daemon. The daemon passes it to the LDAP and awaits a YES or NO response upon the authentication request by checking if the user exists and the submitted password is correct.
  • The saslauthd passes this response to the mongod server through the SASL library which then authenticates or rejects the request accordingly.

 Here is an illustration for this process:

To add an external user to a mongod server:

> db.getSiblingDB("$external").createUser( {user : username, roles: [ {role: "read", db: "test"} ]} );

External users however  cannot have roles assigned in the admin database.

HashiCorp Vault Integration

HashCorp Vault is a product designed to manage secrets and protect sensitive data by securely storing and tightly controlling access to confidential information. With the previous Percona version, data at rest encryption key was stored locally on the server inside the key file. The integration with HashCorp Vault secures the encryption key much far better.

Enhanced Query Profiling

Profiling has a degradation impact on the database  performance especially when there are so many queries issued. Percona server for MongoDB comes in hand by limiting the number of queries collected by the database profiler hence decreases its impact on performance.

Conclusion

Percona Server for MongoDB is an enhanced open source and highly scalable database that may act as a compatible drop-in replacement for MongoDB Community Edition but with similar syntax and configuration. It enhances extensive data security especially one at rest and improved database performance through provision of Percona Server engine, limiting on the profiling rate among other features.

Percona Server for MongoDB is fully supported by ClusterControl as an option for deployment.

How to Rebuild an Inconsistent PostgreSQL Slave

$
0
0

PostgreSQL Streaming Replication is a great way of scaling PostgreSQL clusters and doing it adds high availability to them. As with every replication, the idea is that the slave is a copy of the master and that the slave is constantly updated with the changes that happened on the master using some sort of a replication mechanism. 

It may happen that the slave, for some reason, gets out of sync with the master. How can I bring it back to the replication chain? How can I ensure that the slave is again in-sync with the master? Let’s take a look in this short blog post.

What is very helpful, there is no way to write on a slave if it is in the recovery mode. You can test it like that:

postgres=# SELECT pg_is_in_recovery();

 pg_is_in_recovery

-------------------

 t

(1 row)

postgres=# CREATE DATABASE mydb;

ERROR:  cannot execute CREATE DATABASE in a read-only transaction

It still may happen that the slave would go out of sync with the master. Data corruption - neither hardware or software is without bugs and issues. Some problems with the disk drive may trigger data corruption on the slave. Some problems with the “vacuum” process may result in data being altered. How to recover from that state?

Rebuilding the Slave Using pg_basebackup

The main step is to provision the slave using the data from the master. Given that we’ll be using streaming replication, we cannot use logical backup. Luckily there’s a ready tool that can be used to set things up: pg_basebackup. Let’s see what would be the steps we need to take to provision a slave server. To make it clear, we are using PostgreSQL 12 for the purpose of this blog post.

The initial state is simple. Our slave is not replicating from its master. Data it contains is corrupted and can’t be used nor trusted. Therefore the first step we’ll do will be to stop PostgreSQL on our slave and remove the data it contains:

root@vagrant:~# systemctl stop postgresql

Or even:

root@vagrant:~# killall -9 postgres

Now, let’s check the contents of the postgresql.auto.conf file, we can use replication credentials stored in that file later, for pg_basebackup:

root@vagrant:~# cat /var/lib/postgresql/12/main/postgresql.auto.conf

# Do not edit this file manually!

# It will be overwritten by the ALTER SYSTEM command.

promote_trigger_file='/tmp/failover_5432.trigger'

recovery_target_timeline=latest

primary_conninfo='application_name=pgsql_0_node_1 host=10.0.0.126 port=5432 user=cmon_replication password=qZnVoV7LV97CFX9F'

We are interested in the user and password used for setting up the replication.

Finally we are ok to remove the data:

root@vagrant:~# rm -rf /var/lib/postgresql/12/main/*

Once the data is removed, we need to use pg_basebackup to get the data from the master:

root@vagrant:~# pg_basebackup -h 10.0.0.126 -U cmon_replication -Xs -P -R -D /var/lib/postgresql/12/main/

Password:

waiting for checkpoint

The flags that we used have following meaning:

  • -Xs: we would like to stream WAL while the backup is created. This helps avoid problems with removing WAL files when you have a large dataset.
  • -P: we would like to see progress of the backup.
  • -R: we want pg_basebackup to create standby.signal file and prepare postgresql.auto.conf file with connection settings.

pg_basebackup will wait for the checkpoint before starting the backup. If it takes too long, you can use two options. First, it is possible to set checkpoint mode to fast in pg_basebackup using ‘-c fast’ option. Alternatively, you can force checkpointing by executing:

postgres=# CHECKPOINT;

CHECKPOINT

One way or the other, pg_basebackup will start. With the -P flag we can track the progress:

 416906/1588478 kB (26%), 0/1 tablespaceceace

Once the backup is ready, all we have to do is to make sure data directory content has the correct user and group assigned - we executed pg_basebackup as ‘root’ therefore we want to change it to ‘postgres’:

root@vagrant:~# chown -R postgres.postgres /var/lib/postgresql/12/main/

That’s all, we can start the slave and it should start to replicate from the master.

root@vagrant:~# systemctl start postgresql

You can double-check the replication progress by executing following query on the master:

postgres=# SELECT * FROM pg_stat_replication;

  pid  | usesysid |     usename | application_name | client_addr | client_hostname | client_port |         backend_start | backend_xmin | state | sent_lsn | write_lsn | flush_lsn | replay_lsn | write_lag | flush_lag | replay_lag | sync_priority | sync_state |          reply_time

-------+----------+------------------+------------------+-------------+-----------------+-------------+-------------------------------+--------------+-----------+------------+------------+------------+------------+-----------+-----------+------------+---------------+------------+-------------------------------

 23565 |    16385 | cmon_replication | pgsql_0_node_1   | 10.0.0.128 | | 51554 | 2020-02-27 15:25:00.002734+00 |              | streaming | 2/AA5EF370 | 2/AA5EF2B0 | 2/AA5EF2B0 | 2/AA5EF2B0 | | |         | 0 | async | 2020-02-28 13:45:32.594213+00

 11914 |    16385 | cmon_replication | 12/main          | 10.0.0.127 | | 25058 | 2020-02-28 13:42:09.160576+00 |              | streaming | 2/AA5EF370 | 2/AA5EF2B0 | 2/AA5EF2B0 | 2/AA5EF2B0 | | |         | 0 | async | 2020-02-28 13:45:42.41722+00

(2 rows)

As you can see, both slaves are replicating correctly.

Rebuilding the Slave Using ClusterControl

If you are a ClusterControl user you can easily achieve exactly the same just by picking an option from the UI.

The initial situation is that one of the slaves (10.0.0.127) is not working and it is not replicating. We deemed that the rebuild is the best option for us. 

As ClusterControl users all we have to do is to go to the “Nodes” tab and run “Rebuild Replication Slave” job.

Next, we have to pick the node to rebuild slave from and that is all. ClusterControl will use pg_basebackup to set up the replication slave and configure the replication as soon as the data is transferred.

After some time job completes and the slave is back in the replication chain:

As you can see, with just a couple of clicks, thanks to ClusterControl, we managed to rebuild our failed slave and bring it back to the cluster.


How to Enable TimescaleDB on an Existing PostgreSQL Database

$
0
0

If you have a PostgreSQL cluster up-and-running, and you need to handle data that changes with time (like metrics collected from a system) you should consider using a time-series database that is designed to store this kind of data.

TimescaleDB is an open-source time-series database optimized for fast ingest and complex queries that supports full SQL. It is based on PostgreSQL and it offers the best of NoSQL and Relational worlds for Time-series data. 

In this blog, we will see how to manually enable TimescaleDB in an existing PostgreSQL database and how to do the same task using ClusterControl.

Enabling TimescaleDB Manually

For this blog, we will use CentOS 7 as the operating system and PostgreSQL 11 as the database server.

By default, you don’t have TimescaleDB enabled for PostgreSQL:

world=# \dx

                 List of installed extensions

  Name   | Version |   Schema |     Description

---------+---------+------------+------------------------------

 plpgsql | 1.0     | pg_catalog | PL/pgSQL procedural language

(1 row)

So first, you need to add the corresponding repository to install the software:

$ cat /etc/yum.repos.d/timescale_timescaledb.repo

[timescale_timescaledb]

name=timescale_timescaledb

baseurl=https://packagecloud.io/timescale/timescaledb/el/7/\$basearch

repo_gpgcheck=1

gpgcheck=0

enabled=1

gpgkey=https://packagecloud.io/timescale/timescaledb/gpgkey

sslverify=1

sslcacert=/etc/pki/tls/certs/ca-bundle.crt

metadata_expire=300

We will assume you have the PostgreSQL repository in place as this TimescaleDB installation will require dependencies from there.

Next step is to install the package:

$ yum install timescaledb-postgresql-11

And configure it in your current PostgreSQL database. For this, edit your postgresql.conf file and add 'timescaledb' in the shared_preload_libraries parameter:

shared_preload_libraries = 'timescaledb'

Or if you already have something added there:

shared_preload_libraries = 'pg_stat_statements,timescaledb'

You can also configure the max_background_workers for TimescaleDB to specify the max number of background workers.

timescaledb.max_background_workers=4

Keep in mind that this change requires a database service restart:

$ service postgresql-11 restart

And then, you will have your TimescaleDB installed:

postgres=# SELECT * FROM pg_available_extensions WHERE name='timescaledb';

    name     | default_version | installed_version |                              comment


-------------+-----------------+-------------------+-----------------------------------------------

--------------------

 timescaledb | 1.6.0           | | Enables scalable inserts and complex queries f

or time-series data

(1 row)

So now, you need to enable it:

$ psql world

world=# CREATE EXTENSION IF NOT EXISTS timescaledb CASCADE;

WARNING:

WELCOME TO

 _____ _                               _ ____________

|_   _(_)                             | | | _ \ ___ \

  | |  _ _ __ ___   ___ ___ ___ __ _| | ___| | | | |_/ /

  | | | |  _ ` _ \ / _ \/ __|/ __/ _` | |/ _ \ | | | ___ \

  | | | | | | | | |  __/\__ \ (_| (_| | |  __/ |/ /| |_/ /

  |_| |_|_| |_| |_|\___||___/\___\__,_|_|\___|___/ \____/

               Running version 1.6.0

For more information on TimescaleDB, please visit the following links:


 1. Getting started: https://docs.timescale.com/getting-started

 2. API reference documentation: https://docs.timescale.com/api

 3. How TimescaleDB is designed: https://docs.timescale.com/introduction/architecture


Note: TimescaleDB collects anonymous reports to better understand and assist our users.

For more information and how to disable, please see our docs https://docs.timescaledb.com/using-timescaledb/telemetry.


CREATE EXTENSION

Done.

world=# \dx

                                      List of installed extensions

    Name     | Version |   Schema |                         Description


-------------+---------+------------+--------------------------------------------------------------

-----

 plpgsql     | 1.0 | pg_catalog | PL/pgSQL procedural language

 timescaledb | 1.6.0   | public | Enables scalable inserts and complex queries for time-series

data

(2 rows)

Now, let’s see how to enable it using ClusterControl.

Using ClusterControl to Enable TimescaleDB

We will assume you have your PostgreSQL cluster imported in ClusterControl or even deployed using it

To enable TimescaleDB using ClusterControl, you just need to go to your PostgreSQL Cluster Actions and press on the “Enable TimescaleDB” option.

You will receive a warning about the database restart. Confirm it.

You can monitor the task in the ClusterControl Activity section.

Then you will have your TimescaleDB ready to use.

Conclusion

Now you have your TimescaleDB up and running, you can handle your time-series data in a more performant way. For this, you can create new tables or even migrate your current data, and of course, you should know how to use it to take advantage of this new concept.

Using MariaDB Flashback on a MySQL Server

$
0
0

MariaDB has introduced a very cool feature called Flashback. Flashback is a feature that will allow instances, databases or tables to be rolled back to an old snapshot. Traditionally, to perform a point-in-time recovery (PITR), one would restore a database from a backup, and replay the binary logs to roll forward the database state at a certain time or position. 

With Flashback, the database can be rolled back to a point of time in the past, which is way faster if we just want to see the past that just happened not a long time ago. Occasionally, using flashback might be inefficient if you want to see a very old snapshot of your data relative to the current date and time. Restoring from a delayed slave, or from a backup plus replaying the binary log might be the better options. 

This feature is only available in the MariaDB client package, but that doesn't mean we can not use it with our MySQL servers. This blog post showcases how we can use this amazing feature on a MySQL server.

MariaDB Flashback Requirements

For those who want to use MariaDB flashback feature on top of MySQL, we can basically do the following:

  1. Enable binary log with the following setting:
    1. binlog_format = ROW (default since MySQL 5.7.7).
    2. binlog_row_image = FULL (default since MySQL 5.6).
  2. Use msqlbinlog utility from any MariaDB 10.2.4 and later installation.
  3. Flashback is currently supported only over DML statements (INSERT, DELETE, UPDATE). An upcoming version of MariaDB will add support for flashback over DDL statements (DROP, TRUNCATE, ALTER, etc.) by copying or moving the current table to a reserved and hidden database, and then copying or moving back when using flashback.

The flashback is achieved by taking advantage of existing support for full image format binary logs, thus it supports all storage engines. Note that the flashback events will be stored in memory. Therefore, you should make sure your server has enough memory for this feature.

How Does MariaDB Flashback Work?

MariaDB's mysqlbinlog utility comes with two extra options for this purpose:

  • -B, --flashback - Flashback feature can rollback your committed data to a special time point.
  • -T, --table=[name] - List entries for just this table (local log only).

By comparing the mysqlbinlog output with and without the --flashback flag, we can easily understand how it works. Consider the following statement is executed on a MariaDB server:

MariaDB> DELETE FROM sbtest.sbtest1 WHERE id = 1;

Without flashback flag, we will see the actual DELETE binlog event:

$ mysqlbinlog -vv \

--start-datetime="$(date '+%F %T' -d 'now - 10 minutes')" \

--database=sbtest \

--table=sbtest1 \

/var/lib/mysql/binlog.000003

...

# at 453196541

#200227 12:58:18 server id 37001  end_log_pos 453196766 CRC32 0xdaa248ed Delete_rows: table id 238 flags: STMT_END_F


BINLOG '

6rxXXhOJkAAAQwAAAP06AxsAAO4AAAAAAAEABnNidGVzdAAHc2J0ZXN0MQAEAwP+/gTu4P7wAAEB

AAID/P8AFuAQfA==

6rxXXiCJkAAA4QAAAN47AxsAAO4AAAAAAAEAAgAE/wABAAAAVJ4HAHcAODM4Njg2NDE5MTItMjg3

NzM5NzI4MzctNjA3MzYxMjA0ODYtNzUxNjI2NTk5MDYtMjc1NjM1MjY0OTQtMjAzODE4ODc0MDQt

NDE1NzY0MjIyNDEtOTM0MjY3OTM5NjQtNTY0MDUwNjUxMDItMzM1MTg0MzIzMzA7Njc4NDc5Njcz

NzctNDgwMDA5NjMzMjItNjI2MDQ3ODUzMDEtOTE0MTU0OTE4OTgtOTY5MjY1MjAyOTHtSKLa

'/*!*/;

### DELETE FROM `sbtest`.`sbtest1`

### WHERE

###   @1=1 /* INT meta=0 nullable=0 is_null=0 */

###   @2=499284 /* INT meta=0 nullable=0 is_null=0 */

###   @3='83868641912-28773972837-60736120486-75162659906-27563526494-20381887404-41576422241-93426793964-56405065102-33518432330' /* STRING(480) meta=61152 nullable=0 is_null=0 */

###   @4='67847967377-48000963322-62604785301-91415491898-96926520291' /* STRING(240) meta=65264 nullable=0 is_null=0 */

...

By extending the above mysqlbinlog command with --flashback, we can see the DELETE event is converted to an INSERT event and similarly to the respective WHERE and SET clauses:

$ mysqlbinlog -vv \

--start-datetime="$(date '+%F %T' -d 'now - 10 minutes')" \

--database=sbtest \

--table=sbtest1 \

/var/lib/mysql/binlog.000003 \

--flashback

...

BINLOG '

6rxXXhOJkAAAQwAAAP06AxsAAO4AAAAAAAEABnNidGVzdAAHc2J0ZXN0MQAEAwP+/gTu4P7wAAEB

AAID/P8AFuAQfA==

6rxXXh6JkAAA4QAAAN47AxsAAO4AAAAAAAEAAgAE/wABAAAAVJ4HAHcAODM4Njg2NDE5MTItMjg3

NzM5NzI4MzctNjA3MzYxMjA0ODYtNzUxNjI2NTk5MDYtMjc1NjM1MjY0OTQtMjAzODE4ODc0MDQt

NDE1NzY0MjIyNDEtOTM0MjY3OTM5NjQtNTY0MDUwNjUxMDItMzM1MTg0MzIzMzA7Njc4NDc5Njcz

NzctNDgwMDA5NjMzMjItNjI2MDQ3ODUzMDEtOTE0MTU0OTE4OTgtOTY5MjY1MjAyOTHtSKLa

'/*!*/;

### INSERT INTO `sbtest`.`sbtest1`

### SET

###   @1=1 /* INT meta=0 nullable=0 is_null=0 */

###   @2=499284 /* INT meta=0 nullable=0 is_null=0 */

###   @3='83868641912-28773972837-60736120486-75162659906-27563526494-20381887404-41576422241-93426793964-56405065102-33518432330' /* STRING(480) meta=61152 nullable=0 is_null=0 */

###   @4='67847967377-48000963322-62604785301-91415491898-96926520291' /* STRING(240) meta=65264 nullable=0 is_null=0 */

...

In row-based replication (binlog_format=ROW), each row change event contains two images, a “before” image (except INSERT) whose columns are matched against when searching for the row to be updated, and an “after” image (except DELETE) containing the changes. With binlog_row_image = FULL, MariaDB logs full rows (that is, all columns) for both the before and after images.

The following example shows binary log events for UPDATE. Consider the following statement is executed on a MariaDB server:

MariaDB> UPDATE sbtest.sbtest1 SET k = 0 WHERE id = 5;

When looking at the binlog event for the above statement, we will see something like this:

$ mysqlbinlog -vv \

--start-datetime="$(date '+%F %T' -d 'now - 5 minutes')" \

--database=sbtest \

--table=sbtest1 \

/var/lib/mysql/binlog.000001 

...

### UPDATE `sbtest`.`sbtest1`

### WHERE

###   @1=5 /* INT meta=0 nullable=0 is_null=0 */

###   @2=499813 /* INT meta=0 nullable=0 is_null=0 */

###   @3='44257470806-17967007152-32809666989-26174672567-29883439075-95767161284-94957565003-35708767253-53935174705-16168070783' /* STRING(480) meta=61152 nullable=0 is_null=0 */

###   @4='34551750492-67990399350-81179284955-79299808058-21257255869' /* STRING(240) meta=65264 nullable=0 is_null=0 */

### SET

###   @1=5 /* INT meta=0 nullable=0 is_null=0 */

###   @2=0 /* INT meta=0 nullable=0 is_null=0 */

###   @3='44257470806-17967007152-32809666989-26174672567-29883439075-95767161284-94957565003-35708767253-53935174705-16168070783' /* STRING(480) meta=61152 nullable=0 is_null=0 */

###   @4='34551750492-67990399350-81179284955-79299808058-21257255869' /* STRING(240) meta=65264 nullable=0 is_null=0 */

# Number of rows: 1

...

With the --flashback flag, the "before" image is swapped with the "after" image of the existing row:

$ mysqlbinlog -vv \

--start-datetime="$(date '+%F %T' -d 'now - 5 minutes')" \

--database=sbtest \

--table=sbtest1 \

/var/lib/mysql/binlog.000001 \

 --flashback

...

### UPDATE `sbtest`.`sbtest1`

### WHERE

###   @1=5 /* INT meta=0 nullable=0 is_null=0 */

###   @2=0 /* INT meta=0 nullable=0 is_null=0 */

###   @3='44257470806-17967007152-32809666989-26174672567-29883439075-95767161284-94957565003-35708767253-53935174705-16168070783' /* STRING(480) meta=61152 nullable=0 is_null=0 */

###   @4='34551750492-67990399350-81179284955-79299808058-21257255869' /* STRING(240) meta=65264 nullable=0 is_null=0 */

### SET

###   @1=5 /* INT meta=0 nullable=0 is_null=0 */

###   @2=499813 /* INT meta=0 nullable=0 is_null=0 */

###   @3='44257470806-17967007152-32809666989-26174672567-29883439075-95767161284-94957565003-35708767253-53935174705-16168070783' /* STRING(480) meta=61152 nullable=0 is_null=0 */

###   @4='34551750492-67990399350-81179284955-79299808058-21257255869' /* STRING(240) meta=65264 nullable=0 is_null=0 */

...

We can then redirect the flashback output to the MySQL client, thus rolling back the database or table to the point of time that we want. More examples are shown in the next sections.

MariaDB has a dedicated knowledge base page for this feature. Check out MariaDB Flashback knowledge base page.

MariaDB Flashback With MySQL

To have the flashback ability for MySQL, one has to do the following:

  • Copy the mysqlbinlog utility from any MariaDB server (10.2.4 or later).
  • Disable MySQL GTID before applying the flashback SQL file. Global variables gtid_mode and enforce_gtid_consistency can be set in runtime since MySQL 5.7.5.

Suppose we are having the following simple MySQL 8.0 replication topology:

In this example, we copied mysqlbinlog utility from the latest MariaDB 10.4 on one of our MySQL 8.0 slave (slave2):

(mariadb-server)$ scp /bin/mysqlbinlog root@slave2-mysql:/root/

(slave2-mysql8)$ ls -l /root/mysqlbinlog

-rwxr-xr-x. 1 root root 4259504 Feb 27 13:44 /root/mysqlbinlog

Our MariaDB's mysqlbinlog utility is now located at /root/mysqlbinlog on slave2. On the MySQL master, we executed the following disastrous statement:

mysql> DELETE FROM sbtest1 WHERE id BETWEEN 5 AND 100;

Query OK, 96 rows affected (0.01 sec)

96 rows were deleted in the above statement. Wait a couple of seconds to let the events replicate from master to all slaves before we can try to find the binlog position of the disastrous event on the slave server. The first step is to retrieve all the binary logs on that server:

mysql> SHOW BINARY LOGS;

+---------------+-----------+-----------+

| Log_name      | File_size | Encrypted |

+---------------+-----------+-----------+

| binlog.000001 |       850 | No |

| binlog.000002 |     18796 | No |

+---------------+-----------+-----------+

Our disastrous event should exist inside binlog.000002, the latest binary log in this server. We can then use the MariaDB's mysqlbinlog utility to retrieve all binlog events for table sbtest1 since 10 minutes ago:

(slave2-mysql8)$ /root/mysqlbinlog -vv \

--start-datetime="$(date '+%F %T' -d 'now - 10 minutes')" \

--database=sbtest \

--table=sbtest1 \

/var/lib/mysql/binlog.000002

...

# at 195

#200228 15:09:45 server id 37001  end_log_pos 281 CRC32 0x99547474 Ignorable

# Ignorable event type 33 (MySQL Gtid)

# at 281

#200228 15:09:45 server id 37001  end_log_pos 353 CRC32 0x8b12bd3c Query thread_id=19 exec_time=0 error_code=0

SET TIMESTAMP=1582902585/*!*/;

SET @@session.pseudo_thread_id=19/*!*/;

SET @@session.foreign_key_checks=1, @@session.sql_auto_is_null=0, @@session.unique_checks=1, @@session.autocommit=1, @@session.check_constraint_che

cks=1/*!*/;

SET @@session.sql_mode=524288/*!*/;

SET @@session.auto_increment_increment=1, @@session.auto_increment_offset=1/*!*/;

SET @@session.character_set_client=255,@@session.collation_connection=255,@@session.collation_server=255/*!*/;

SET @@session.lc_time_names=0/*!*/;

SET @@session.collation_database=DEFAULT/*!*/;

BEGIN

/*!*/;

# at 353

#200228 15:09:45 server id 37001  end_log_pos 420 CRC32 0xe0e44a1b Table_map: `sbtest`.`sbtest1` mapped to number 92

# at 420

# at 8625

# at 16830

#200228 15:09:45 server id 37001  end_log_pos 8625 CRC32 0x99b1a8fc Delete_rows: table id 92

#200228 15:09:45 server id 37001  end_log_pos 16830 CRC32 0x89496a07 Delete_rows: table id 92

#200228 15:09:45 server id 37001  end_log_pos 18765 CRC32 0x302413b2 Delete_rows: table id 92 flags: STMT_END_F

To easily look up for the binlog position number, pay attention on the lines that start with "# at ". From the above lines, we can see the DELETE event was happening at position 281 inside binlog.000002 (starts at "# at 281"). We can also retrieve the binlog events directly inside a MySQL server:

mysql> SHOW BINLOG EVENTS IN 'binlog.000002';

+---------------+-------+----------------+-----------+-------------+-------------------------------------------------------------------+

| Log_name      | Pos | Event_type     | Server_id | End_log_pos | Info                                                              |

+---------------+-------+----------------+-----------+-------------+-------------------------------------------------------------------+

| binlog.000002 |     4 | Format_desc |   37003 | 124 | Server ver: 8.0.19, Binlog ver: 4                                 |

| binlog.000002 |   124 | Previous_gtids |     37003 | 195 | 0d98d975-59f8-11ea-bd30-525400261060:1                            |

| binlog.000002 |   195 | Gtid |     37001 | 281 | SET @@SESSION.GTID_NEXT= '0d98d975-59f8-11ea-bd30-525400261060:2' |

| binlog.000002 |   281 | Query |     37001 | 353 | BEGIN                                                             |

| binlog.000002 |   353 | Table_map |     37001 | 420 | table_id: 92 (sbtest.sbtest1)                                     |

| binlog.000002 |   420 | Delete_rows |     37001 | 8625 | table_id: 92                                                      |

| binlog.000002 |  8625 | Delete_rows   | 37001 | 16830 | table_id: 92                                                      |

| binlog.000002 | 16830 | Delete_rows    | 37001 | 18765 | table_id: 92 flags: STMT_END_F                                    |

| binlog.000002 | 18765 | Xid            | 37001 | 18796 | COMMIT /* xid=171006 */                                           |

+---------------+-------+----------------+-----------+-------------+-------------------------------------------------------------------+

9 rows in set (0.00 sec)

We can now confirm that position 281 is where we want our data to revert to. We can then use the --start-position flag to generate accurate flashback events. Notice that we omit the "-vv" flag and add the --flashback flag:

(slave2-mysql8)$ /root/mysqlbinlog \

--start-position=281 \

--database=sbtest \

--table=sbtest1 \

/var/lib/mysql/binlog.000002 \

--flashback > /root/flashback.binlog

The flashback.binlog contains all the required events to undo all changes happened on table sbtest1 on this MySQL server. Since this is a slave node of a replication cluster, we have to break the replication on the chosen slave (slave2) in order to use it for flashback purposes. To do this, we have to stop the replication on the chosen slave, set MySQL GTID to ON_PERMISSIVE and make the slave writable:

(slave2-mysql)$ mysql -uroot -p

mysql> STOP SLAVE; 

SET GLOBAL gtid_mode = ON_PERMISSIVE; 

SET GLOBAL enforce_gtid_consistency = OFF; 

SET GLOBAL read_only = OFF;

At this point, slave2 is not part of the replication and our topology is looking like this:

Import the flashback via mysql client and we do not want this change to be recorded in MySQL binary log:

(slave2-mysql8)$ mysql -uroot -p --init-command='SET sql_log_bin=0' sbtest < /root/flashback.binlog

We can then see all the deleted rows, as proven by the following statement:

mysql> SELECT COUNT(id) FROM sbtest1 WHERE id BETWEEN 5 and 100;

+-----------+

| COUNT(id) |

+-----------+

|        96 |

+-----------+

1 row in set (0.00 sec)

We can then create an SQL dump file for table sbtest1 for our reference:

(slave2-mysql8)$ mysqldump -uroot -p --single-transaction sbtest sbtest1 > sbtest1_flashbacked.sql

Once the flashback operation completes, we can rejoin the slave node back into the replication chain. But firstly, we have to bring back the database into a consistent state, by replaying all events starting from the position we had flashbacked. Don't forget to skip binary logging as we do not want to "write" onto the slave and risking ourselves with errant transactions:

(slave2-mysql8)$ /root/mysqlbinlog \

--start-position=281 \

--database=sbtest \

--table=sbtest1 \

/var/lib/mysql/binlog.000001 | mysql -uroot -p --init-command='SET sql_log_bin=0' sbtest

Finally, prepare the node back to its role as MySQL slave and start the replication:

mysql> SET GLOBAL read_only = ON;

SET GLOBAL enforce_gtid_consistency = ON; 

SET GLOBAL gtid_mode = ON; 

START SLAVE; 

Verify that the slave node is replicating correctly:

mysql> SHOW SLAVE STATUS\G

...

             Slave_IO_Running: Yes

            Slave_SQL_Running: Yes

...

At this point, we have re-joined the slave back into the replication chain and our topology is now back to its original state:

Shout out to the MariaDB team for introducing this astounding feature!

Setting Up a Geo-Location Database Cluster Using MySQL Replication

$
0
0

A single point of failure (SPOF)  is a common reason why organizations are working towards distributing the presence of their database environments to another location geographically. It's part of the Disaster Recovery and Business Continuity strategic plans. 

Disaster Recovery (DR) planning embodies technical procedures which cover the preparation for unanticipated issues such as natural disasters, accidents (such as human error), or incidents (such as criminal acts). 

For the past decade, distributing your database environment across multiple geographical locations has been a pretty common setup, as public clouds offer a lot of ways to deal with this. The challenge comes in setting up database environments. It creates challenges when you try to manage the database(s), move your data to another geo-location, or apply security with a high level of observability.

In this blog, we'll showcase how you can do this using MySQL Replication. We'll cover how you are able to copy your data to another database node located in a different country distant from the current geography of the MySQL cluster. For this example, our target region is based on us-east, while my on-prem is in Asia located in the Philippines.

Why Do I Need A Geo-Location Database Cluster?

Even Amazon AWS, the top public cloud provider, claims they suffer from downtime or unintended outages (like the one that happened in 2017). Let's say you are using AWS as your secondary datacenter aside from your on-prem. You cannot have any internal access to its underlying hardware or to those internal networks that are managing your compute nodes. These are fully managed services which you paid for, but you cannot avoid the fact that it can suffer from an outage anytime. If such a geographic location suffers an outage then you can have a long downtime. 

This type of problem must be foreseen during your business continuity planning. It must have been analyzed and implemented based on what has been defined. Business continuity for your MySQL databases should include high uptime. Some environments are doing benchmarks and set a high bar of rigorous tests including the weak side in order to expose any vulnerability, how resilient it can be, and how scalable your technology architecture including your database infrastructure. For business especially those handling high transactions, it is imperative to ensure that production databases are available for the applications all the time even when catastrophe occurs. Otherwise, downtime can be experienced and it might cost you a large amount of money.

With these identified scenarios, organizations start extending their infrastructure to different cloud  providers and putting nodes to different geo-location to have more high uptime (if possible at 99.99999999999), lower RPO, and has no SPOF.

To ensure production databases survive a disaster, a Disaster Recovery (DR) site must be configured. Production and DR sites must be part of two geographically distant datacenters. This means, a standby database must be configured at the DR site for every production database so that, the data changes occurring on production database are immediately synced across to the standby database via transaction logs. Some setups also use their DR nodes to handle reads so as to provide load balancing between application and the data layer.

The Desired Architectural Setup

In this blog, the desired setup is simple and yet very common implementation nowadays. See below on the desired architectural setup for this blog:

In this blog, I choose Google Cloud Platform (GCP) as the public cloud provider, and using my local network as my on-prem database environment.

It is a must that when using this type of design, you always need both environment or platform to communicate in a very secure manner. Using VPN or using alternatives such as AWS Direct Connect. Although these public clouds nowadays offer managed VPN services which you can use. But for this setup, we'll be using OpenVPN since I don't need sophisticated hardware or service for this blog.

Best and Most Efficient Way

For MySQL/Percona/MariaDB database environments, the best and efficient way is to take a backup copy of your database, send to the target node to be deployed or instantiated. There are different ways to use this approach either you can use mysqldump, mydumper, rsync, or use Percona XtraBackup/Mariabackup and stream the data going to your target node.

Using mysqldump

mysqldump creates a logical backup of your whole database or you can selectively choose a list of databases, tables, or even specific records that you wanted to dump. 

A simple command that you can use to take a full backup can be,

$ mysqldump --single-transaction --all-databases --triggers --routines --events --master-data | mysql -h <target-host-db-node -u<user> -p<password> -vvv --show-warnings

With this simple command, it will directly run the MySQL statements to the target database node, for example your target database node on a Google Compute Engine. This can be efficient when data is smaller or you have a fast bandwidth. Otherwise, packing your database to a file then send it to the target node can be your option.

$ mysqldump --single-transaction --all-databases --triggers --routines --events --master-data | gzip > mydata.db

$ scp mydata.db <target-host>:/some/path

Then run mysqldump to the target database node as such,

zcat mydata.db | mysql

The downside with using logical backup using mysqldump is it's slower and consumes disk space. It also uses a single thread so you cannot run this in parallel. Optionally, you can use mydumper especially when your data is too huge. mydumper can be run in parallel but it's not as flexible compared to mysqldump.

Using xtrabackup

xtrabackup is a physical backup where you can send the streams or binary to the target node. This is very efficient and is mostly used when streaming a backup over the network especially when the target node is of different geography or different region. ClusterControl uses xtrabackup when provisioning or instantiating a new slave regardless where it is located as long as access and permission has been setup prior to the action.

If you are using xtrabackup to run it manually, you can run the command as such,

## Target node

$  socat -u tcp-listen:9999,reuseaddr stdout 2>/tmp/netcat.log | xbstream -x -C /var/lib/mysql

## Source node

$ innobackupex --defaults-file=/etc/my.cnf --stream=xbstream --socket=/var/lib/mysql/mysql.sock  --host=localhost --tmpdir=/tmp /tmp | socat -u stdio TCP:192.168.10.70:9999

To elaborate those two commands,the first command has to be executed or run first on the target node. The target node command does listen on port 9999 and will write any stream that is received from port 9999 in the target node. It is dependent on commands socat and xbstream which means you must ensure you have these packages installed.

On the source node, it executes the innobackupex perl script which invokes xtrabackup in the background and uses xbstream to stream the data that will be sent over the network. The socat command opens the port 9999 and sends its data to the desired host, which is 192.168.10.70 in this example. Still, ensure that you have socat and xbstream installed when using this command. Alternative way of using socat is nc but socat offers more advanced features compared to nc such as serialization like multiple clients can listen on a port. 

ClusterControl uses this command when rebuilding a slave or building a new slave.  It is fast and guarantees the exact copy of your source data will be copied to your target node. When provisioning a new database into a separate geo-location, using this approach offers more efficiency and offers you more speed to finish the job. Although there can be pros and cons when using logical or binary backup when streamed through the wire. Using this method is a very common approach when setting up a new geo-location database cluster to a different region and create an exact copy of your database environment.

Efficiency, Observability, and Speed

Questions left by most people who are not familiar with this approach always covers the "HOW, WHAT, WHERE" problems. In this section, we'll cover how you can efficiently setup your geo-location database with less work to deal with and with observability why it fails. Using ClusterControl is very efficient. In this current setup I have, the following environment as initially implemented:

Extending Node to GCP

Starting to setup your geo-Location database cluster, to extend your cluster and create a snapshot copy of your cluster, you can add a new slave. As mentioned earlier, ClusterControl will use xtrabackup (mariabackup for MariaDB 10.2 onwards) and deploy a new node within your cluster. Before you can register your GCP compute nodes as your target nodes, you need to setup first the appropriate system user the same as the system user you registered in ClusterControl. You can verify this in your /etc/cmon.d/cmon_X.cnf, where X is the cluster_id. For example, see below:

# grep 'ssh_user' /etc/cmon.d/cmon_27.cnf 

ssh_user=maximus

maximus(in this example) must be present in your GCP compute nodes. The user in your GCP nodes must have the sudo or super admin privileges. It must also be setup with a password-less SSH access. Please read our documentation more about the system user and it's required privileges.

Let's have an example list of servers below (from GCP console: Compute Engine dashboard):

In the screenshot above, our target region is based on the us-east region. As noted earlier, my local network is setup over a secure layer going through GCP (vice-versa) using OpenVPN. So communication from GCP going to my local network is also encapsulated over the VPN tunnel.

Add a Slave Node To GCP

The screenshot below reveals how you can do this. See images below:

As seen in the second screenshot, we're targeting node 10.142.0.12 and its source master is 192.168.70.10. ClusterControl is smart enough to determine firewalls, security modules, packages, configuration, and setup that needs to be done. See below an example of job activity log:

Quite a simple task, isn't it?

Complete The GCP MySQL Cluster

We need to add two nodes more to the GCP cluster to have a balance topology as we did have in the local network. For the second and third node, ensure that the master must be pointing to your GCP node. In this example, the master is 10.142.0.12. See below how to do this,

As seen in the screenshot above, I selected the 10.142.0.12 (slave) which is the first node we have added into the cluster. The complete result shows as follows,

Your Final Setup of Geo-Location Database Cluster

From the last screenshot, this kind of topology might not be your ideal setup. Mostly, it has to be a multi-master setup, where your DR cluster serves as the standby cluster, where as your on-prem serves as the primary active cluster. To do this, it's quite simple in ClusterControl. See the following screenshots to achieve this goal.

You can just drag your current master to the target master that has to be setup as a primary-standby writer just in case your on-prem in harm. In this example, we drag targeting host 10.142.0.12 (GCP compute node). The end result is shown below:

Then it achieves the desired result. Easy, and very quick to spawn your Geo-Location Database cluster using MySQL Replication.

Conclusion

Having a Geo-Location Database Cluster is not new. It has been a desired setup for companies and organizations avoiding SPOF who want resilience and a lower RPO. 

The main takeaways for this setup are security, redundancy, and resilience. It also covers how feasible and efficient you can deploy your new cluster to a different geographic region. While ClusterControl can offer this, expect we can have more improvement on this sooner where you can create efficiently from a backup and spawn your new different cluster in ClusterControl, so stay tuned.

How to Easy Manage Database Updates and Security Patches

$
0
0

Database security requires careful planning, but it is important to remember that security is not a state, it is a process. Once the database is in place, monitoring, alerting and reporting on changes are an integral part of the ongoing management. Also, security efforts need to be aligned with business needs.

Database vendors regularly issue critical patch updates to address software bugs or known vulnerabilities, but for a variety of reasons, organizations are often unable to install them in a timely manner, if at all. Evidence suggests that companies are actually getting worse at patching databases, with an increased number violating compliance standards and governance policies. Patching that requires database downtime would be of extreme concern in a 24/7 environment, however, most cluster upgrades can be performed online. 

ClusterControl is able to perform a rolling upgrade of a distributed environment, upgrading and restarting one node at a time. The logical upgrade steps might slightly differ between the different cluster types. Load balancers would automatically blacklist unavailable nodes that are currently being upgraded, so that applications are not affected. 

Operational Reporting on Version Upgrades and Patches is an area that requires constant attention, especially with the proliferation of open source databases in many organizations and more database environments being distributed for high availability.

ClusterControl provides a solid operational reporting framework and can help answer simple questions like 

  • What versions of the software are running across the environment?
  • Which servers should be upgraded?
  • Which servers are missing critical updates?

Automatic Database Patching

ClusterControl provides the ability for automatic rolling upgrades for MySQL& MariaDB to ensure that your databases always use the latest patches and fixes. 

Upgrades are online and are performed on one node at a time. The node will be stopped, then software will be updated, and then the node will be started again. If a node fails to upgrade, the upgrade process is aborted. 

Rolling MySQL Database Upgrades

ClusterControl provides the ability for automatic rolling upgrades for MySQL-based database clusters by automatically applying the upgrade one node at a time which results in zero downtime.

After successfully installing the selected version you must perform a rolling restart - the nodes restart one by one.

ClusterControl supports you in that step making sure nodes are responding properly during the node restart.

Database Upgrade Assistance

ClusterControl makes it easy to upgrade your MongoDB and PostgreSQL databases by, with a simple click, promoting a slave or replica to allow you to upgrade the Master and vice versa.

Database Package Summary Operational Report

ClusterControl provides the Package Summary Operational Report that shows you how many technology and security patches are available to upgrade.

You can generate it ad-hoc and view in the UI, send it via email or you can schedule such a report to be delivered to you for example once per week.

As you can see, the Upgrade Report contains information about different hosts in the cluster, which database has been installed on them and in which version. It also contains information about how many other packages installed are not up to date. You can see the total number, how many are related to database services, how many are providing security updates and the rest of them. 

The Upgrade Report lists all of the not-up-to-date packages on a per-host basis. In the screenshot above you can see that the node 10.0.3.10 has two MongoDB util packages not up to date (those are the 2 DB packages mentioned in the summary). Then there is a list of security packages and all other packages which are not up to date.

Conclusion

ClusterControl goes an extra mile to make sure you are covered regarding the security (and other) updates. As you have seen, it is very easy to know if your systems are up to date. ClusterControl can also assist in performing the upgrade of the database nodes.

How to Rebuild an Inconsistent MySQL Slave?

$
0
0

MySQL slaves may become inconsistent. You can try to avoid it, but it’s really hard. Setting super_read_only and using row-based replication can help a lot, but no matter what you do, it is still possible that your slave will become inconsistent. 

What can be done to rebuild an inconsistent MySQL slave? In this blog post we’ll take a look at this problem.

First off, let’s discuss what has to happen in order to rebuild a slave. To bring a node into MySQL Replication, it has to be provisioned with data from one of the nodes in the replication topology. This data has to be consistent at the point in time when it was collected. You cannot take it on a table by table or schema by schema basis, because this will make the provisioned node inconsistent internally. Meaning some data would be older than some other part of the dataset. 

In addition to data consistency, it should also be possible to collect information about the relationship between the data and the state of replication. You want to have either binary log position at which the collected data is consistent or Global Transaction ID of the transaction which was the last one executed on the node that is the source of the data.

This leads us to the following considerations. You can rebuild a slave using any backup tool as long as this tool can generate consistent backup and it includes replication coordinates for the point-in-time in which the backup is consistent. This allows us to pick from a couple of options.

Using Mysqldump to Rebuild an Inconsistent MySQL Slave

Mysqldump is the most basic tool that we have to achieve this. It allows us to create a logical backup in, among others, the form of SQL statements. What is important, while being basic, it still allows us to take a consistent backup: it can use transaction to ensure that the data is consistent at the beginning of the transaction. It can also write down replication coordinates for that point, even a whole CHANGE MASTER statement, making it easy to start the replication using the backup.

Using Mydumper to Rebuild an Inconsistent MySQL Slave

Another option is to use mydumper - this tool, just like mysqldump, generates a logical backup and, just like mysqldump, can be used to create a consistent backup of the database. The main difference between mydumper and mysqldump is that mydumper, when paired with myloader, can dump and restore data in parallel, improving the dump and, especially, restore time.

Using a Snapshot to Rebuild an Inconsistent MySQL Slave

For those who use cloud providers, a possibility is to take a snapshot of the underlying block storage. Snapshots generate a point-in-time view of the data. This process is quite tricky though, as the consistency of the data and the ability to restore it depends mostly on the MySQL configuration. 

You should ensure that the database works in a durable mode (it is configured in a way that crash of the MySQL will not result in any data loss). This is because (from a MySQL standpoint) taking a volume snapshot and then starting another MySQL instance off the data stored in it is, basically, the same process like if you would kill -9 the mysqld and then start it again. The InnoDB recovery has to happen, replay transactions that have been stored in binary logs, rollback transactions that haven’t completed before the crash and so on. 

The downside of snapshot-based rebuild process is that it is strongly tied to the current vendor. You cannot easily copy the snapshot data from one cloud provider to another one. You may be able to move it between different regions but it will still be the same provider.

Using a Xtrabackup or Mariabackup to Rebuild an Inconsistent MySQL Slave

Finally, xtrabackup/mariabackup - this is a tool written by Percona and forked by MariaDB that allows to generate a physical backup. It is way faster than logical backups - it’s limited mostly by the hardware performance - disk or network being the most probable bottlenecks.  Most of the workload is related to copying files from MySQL data directory to another location (on the same host or over the network). 

While not nearly as fast as block storage snapshots, xtrabackup is way more flexible and can be used in any environment. The backup it produces consists of files, therefore it is perfectly possible to copy the backup to any location you like. Another cloud provider, your local datacenter, it doesn’t matter as long as you can transfer files from your current location. 

It doesn’t even have to have network connectivity - you can as well just copy the backup to some “transferable” device like USB SSD or even USB stick, as long as it can contain all of the data and store it in your pocket while you relocate from one datacenter to another.

How to Rebuild a MySQL Slave Using Xtrabackup?

We decided to focus on xtrabackup, given its flexibility and ability to work in most of the environments where MySQL can exist. How do you rebuild your slave using xtrabackup? Let’s take a look.

Initially, we have a master and a slave, which suffered from some replication issues:

mysql> SHOW SLAVE STATUS\G

*************************** 1. row ***************************

               Slave_IO_State: Waiting for master to send event

                  Master_Host: 10.0.0.141

                  Master_User: rpl_user

                  Master_Port: 3306

                Connect_Retry: 10

              Master_Log_File: binlog.000004

          Read_Master_Log_Pos: 386

               Relay_Log_File: relay-bin.000008

                Relay_Log_Pos: 363

        Relay_Master_Log_File: binlog.000004

             Slave_IO_Running: Yes

            Slave_SQL_Running: No

              Replicate_Do_DB:

          Replicate_Ignore_DB:

           Replicate_Do_Table:

       Replicate_Ignore_Table:

      Replicate_Wild_Do_Table:

  Replicate_Wild_Ignore_Table:

                   Last_Errno: 1007

                   Last_Error: Error 'Can't create database 'mytest'; database exists' on query. Default database: 'mytest'. Query: 'create database mytest'

                 Skip_Counter: 0

          Exec_Master_Log_Pos: 195

              Relay_Log_Space: 756

              Until_Condition: None

               Until_Log_File:

                Until_Log_Pos: 0

           Master_SSL_Allowed: No

           Master_SSL_CA_File:

           Master_SSL_CA_Path:

              Master_SSL_Cert:

            Master_SSL_Cipher:

               Master_SSL_Key:

        Seconds_Behind_Master: NULL

Master_SSL_Verify_Server_Cert: No

                Last_IO_Errno: 0

                Last_IO_Error:

               Last_SQL_Errno: 1007

               Last_SQL_Error: Error 'Can't create database 'mytest'; database exists' on query. Default database: 'mytest'. Query: 'create database mytest'

  Replicate_Ignore_Server_Ids:

             Master_Server_Id: 1001

                  Master_UUID: 53d96192-53f7-11ea-9c3c-080027c5bc64

             Master_Info_File: mysql.slave_master_info

                    SQL_Delay: 0

          SQL_Remaining_Delay: NULL

      Slave_SQL_Running_State:

           Master_Retry_Count: 86400

                  Master_Bind:

      Last_IO_Error_Timestamp:

     Last_SQL_Error_Timestamp: 200306 11:47:42

               Master_SSL_Crl:

           Master_SSL_Crlpath:

           Retrieved_Gtid_Set: 53d96192-53f7-11ea-9c3c-080027c5bc64:9

            Executed_Gtid_Set: 53d96192-53f7-11ea-9c3c-080027c5bc64:1-8,

ce7d0c38-53f7-11ea-9f16-080027c5bc64:1-3

                Auto_Position: 1

         Replicate_Rewrite_DB:

                 Channel_Name:

           Master_TLS_Version:

       Master_public_key_path:

        Get_master_public_key: 0

            Network_Namespace:

1 row in set (0.00 sec)

As you can see, there is a problem with one of the schemas. Let’s assume we have to rebuild this node to bring it back into the replication. Here are the steps we have to perform.

First, we have to make sure xtrabackup is installed. In our case we use MySQL 8.0 therefore we have to use xtrabackup in version 8 to ensure compatibility:

root@master:~# apt install percona-xtrabackup-80

Reading package lists... Done

Building dependency tree

Reading state information... Done

percona-xtrabackup-80 is already the newest version (8.0.9-1.bionic).

0 upgraded, 0 newly installed, 0 to remove and 143 not upgraded.

Xtrabackup is provided by Percona repository and the guide to installing it can be found here:

https://www.percona.com/doc/percona-xtrabackup/8.0/installation/apt_repo.html

The tool has to be installed on both master and the slave that we want to rebuild.

As a next step we will remove all the data from the “broken” slave:

root@slave:~# service mysql stop

root@slave:~# rm -rf /var/lib/mysql/*

Next, we will take the backup on the master and stream it to the slave. Please keep in mind this particular one-liner requires passwordless SSH root connectivity from the master to the slave:

root@master:~# xtrabackup --backup --compress --stream=xbstream --target-dir=./ | ssh root@10.0.0.142 "xbstream -x --decompress -C /var/lib/mysql/"

At the end you should see an important line:

200306 12:10:40 completed OK!

This is an indicator that the backup completed OK. Couple of things may still go wrong but at least we got the data right. Next, on the slave, we have to prepare the backup.

root@slave:~# xtrabackup --prepare --target-dir=/var/lib/mysql/

.

.

.

200306 12:16:07 completed OK!

You should see, again, that the process completed OK. You may want now to copy the data back to the MySQL data directory. We don’t have to do that as we stored the streaming backup directly in /var/lib/mysql. What we want to do, though, is to ensure correct ownership of the files:

root@slave:~# chown -R mysql.mysql /var/lib/mysql

Now, let’s check the GTID coordinates of the backup. We will use them later when setting up the replication.

root@slave:~# cat /var/lib/mysql/xtrabackup_binlog_info

binlog.000007 195 53d96192-53f7-11ea-9c3c-080027c5bc64:1-9

Ok, all seems to be good, let’s start MySQL and proceed with configuring the replication:

root@slave:~# service mysql start

root@slave:~# mysql -ppass

mysql: [Warning] Using a password on the command line interface can be insecure.

Welcome to the MySQL monitor.  Commands end with ; or \g.

Your MySQL connection id is 8

Server version: 8.0.18-9 Percona Server (GPL), Release '9', Revision '53e606f'


Copyright (c) 2009-2019 Percona LLC and/or its affiliates

Copyright (c) 2000, 2019, Oracle and/or its affiliates. All rights reserved.


Oracle is a registered trademark of Oracle Corporation and/or its

affiliates. Other names may be trademarks of their respective

owners.


Type 'help;' or '\h' for help. Type '\c' to clear the current input statement.


mysql>

Now we have to set the gtid_purged to the GTID set that we found in the backup. Those are GTID that have been “covered” by our backup. Only new GTID should replicate from the master.

mysql> SET GLOBAL gtid_purged='53d96192-53f7-11ea-9c3c-080027c5bc64:1-9';

Query OK, 0 rows affected (0.00 sec)

Now we can start the replication:

mysql> CHANGE MASTER TO MASTER_HOST='10.0.0.141', MASTER_USER='rpl_user', MASTER_PASSWORD='yIPpgNE4KE', MASTER_AUTO_POSITION=1;

Query OK, 0 rows affected, 2 warnings (0.02 sec)


mysql> START SLAVE;

Query OK, 0 rows affected (0.00 sec)

mysql> SHOW SLAVE STATUS\G

*************************** 1. row ***************************

               Slave_IO_State: Waiting for master to send event

                  Master_Host: 10.0.0.141

                  Master_User: rpl_user

                  Master_Port: 3306

                Connect_Retry: 60

              Master_Log_File: binlog.000007

          Read_Master_Log_Pos: 380

               Relay_Log_File: relay-bin.000002

                Relay_Log_Pos: 548

        Relay_Master_Log_File: binlog.000007

             Slave_IO_Running: Yes

            Slave_SQL_Running: Yes

              Replicate_Do_DB:

          Replicate_Ignore_DB:

           Replicate_Do_Table:

       Replicate_Ignore_Table:

      Replicate_Wild_Do_Table:

  Replicate_Wild_Ignore_Table:

                   Last_Errno: 0

                   Last_Error:

                 Skip_Counter: 0

          Exec_Master_Log_Pos: 380

              Relay_Log_Space: 750

              Until_Condition: None

               Until_Log_File:

                Until_Log_Pos: 0

           Master_SSL_Allowed: No

           Master_SSL_CA_File:

           Master_SSL_CA_Path:

              Master_SSL_Cert:

            Master_SSL_Cipher:

               Master_SSL_Key:

        Seconds_Behind_Master: 0

Master_SSL_Verify_Server_Cert: No

                Last_IO_Errno: 0

                Last_IO_Error:

               Last_SQL_Errno: 0

               Last_SQL_Error:

  Replicate_Ignore_Server_Ids:

             Master_Server_Id: 1001

                  Master_UUID: 53d96192-53f7-11ea-9c3c-080027c5bc64

             Master_Info_File: mysql.slave_master_info

                    SQL_Delay: 0

          SQL_Remaining_Delay: NULL

      Slave_SQL_Running_State: Slave has read all relay log; waiting for more updates

           Master_Retry_Count: 86400

                  Master_Bind:

      Last_IO_Error_Timestamp:

     Last_SQL_Error_Timestamp:

               Master_SSL_Crl:

           Master_SSL_Crlpath:

           Retrieved_Gtid_Set: 53d96192-53f7-11ea-9c3c-080027c5bc64:10

            Executed_Gtid_Set: 53d96192-53f7-11ea-9c3c-080027c5bc64:1-10

                Auto_Position: 1

         Replicate_Rewrite_DB:

                 Channel_Name:

           Master_TLS_Version:

       Master_public_key_path:

        Get_master_public_key: 0

            Network_Namespace:

1 row in set (0.00 sec)

As you can see, our slave is replicating from its master.

How to Rebuild a MySQL Slave Using ClusterControl?

If you are a ClusterControl user, instead of going through this process you can rebuild the slave in just a couple of clicks. Initially we have a clear issue with the replication:

Our slave is not replicating properly due to an error.

All we have to do is to run the “Rebuild Replication Slave” job.

You will be presented with a dialog where you should pick a master node for the slave that you want to rebuild. Then, click on Proceed and you are all set. ClusterControl will rebuild the slave and set up the replication for you.

Shortly, based on the data set size, you should see working slave:

As you can see, with just a couple of clicks ClusterControl accomplished the task of rebuilding the inconsistent replication slave.

How High CPU Utilization Effects Database Performance

$
0
0

One of the indicators to see if our database is experiencing performance issues is by looking at the CPU utilization. High CPU usage is directly proportional to disk I/O (where data is either read or written to the disk). In this blog we will take a close look at some of the parameters in the database and how they are related to the CPU core of the server. 

How to Confirm if Your CPU Utilization is High

If you think you are experiencing high CPU utilization, you should check the process in the Operating System to determine what is causing the issue. To do this, you can utilize the htop / top command in the operating system. 

[root@n1]# top

top - 14:10:35 up 39 days, 20:20,  2 users, load average: 0.30, 0.68, 1.13

Tasks: 461 total,   2 running, 459 sleeping,   0 stopped, 0 zombie

%Cpu(s):  0.7 us, 0.6 sy,  0.0 ni, 98.5 id, 0.1 wa,  0.0 hi, 0.0 si, 0.0 st

KiB Mem : 13145656+total,   398248 free, 12585008+used, 5208240 buff/cache

KiB Swap: 13421772+total, 11141702+free, 22800704 used.  4959276 avail Mem


  PID USER      PR NI VIRT    RES SHR S %CPU %MEM     TIME+ COMMAND

15799 mysql     20 0 145.6g 118.2g   6212 S 87.4 94.3 7184:35 mysqld

21362 root      20 0 36688 15788   2924 S 15.2 0.0 5805:21 node_exporter

From above top command, the highest CPU utilization came from mysqld daemon.  You can check inside the database itself, what’s process is running :

​mysql> show processlist;

+-----+----------+-------------------+--------------------+------------------+------+---------------------------------------------------------------+------------------------------------------------------------------------+-----------+---------------+

| Id  | User     | Host         | db | Command          | Time | State                               | Info   | Rows_sent | Rows_examined |

+-----+----------+-------------------+--------------------+------------------+------+---------------------------------------------------------------+------------------------------------------------------------------------+-----------+---------------+

|  32 | rpl_user | 10.10.10.18:45338 | NULL               | Binlog Dump GTID | 4134 | Master has sent all binlog to slave; waiting for more updates | NULL                                                                   | 0 | 0 |

|  47 | cmon     | 10.10.10.10:37214 | information_schema | Sleep            | 1 |           | NULL   | 492 | 984 |

|  50 | cmon     | 10.10.10.10:37390 | information_schema | Sleep            | 0 |           | NULL   | 0 | 0 |

|  52 | cmon     | 10.10.10.10:37502 | information_schema | Sleep            | 2 |           | NULL   | 1 | 599 |

| 429 | root     | localhost   | item | Query            | 4 | Creating sort index                               | select * from item where i_data like '%wjf%' order by i_data   | 0 | 0 |

| 443 | root     | localhost   | item | Query            | 2 | Creating sort index                               | select * from item where i_name like 'item-168%' order by i_price desc |         0 | 0 |

| 471 | root     | localhost   | NULL | Query            | 0 | starting                               | show processlist   | 0 | 0 |

+-----+----------+-------------------+--------------------+------------------+------+---------------------------------------------------------------+------------------------------------------------------------------------+-----------+---------------+

7 rows in set (0.00 sec)

There are some running queries (as shown above) and it’s the SELECT query to the table item with state Creating sort index. The meaning of the creating sort index state is where the database is figuring out the order of returned values based on the order clause, the constraint with availability of CPU speed. So if you have limited CPU cores, this will impact the query. 

Enabling a slow query log is beneficial to check if there’s an issue from the application side. You can enable the slow query by setting two parameters in the database, which is slow_query_log and long_query_time. Parameter slow_query_log must be set to ON to enable the slow query log, and long_query_time parameter is used for the threshold alert of long running query. There is also one parameter related to location of slow query file, slow_query_log_file can be set to any path to store the slow query log file. 

mysql> explain select * from item where i_data like '%wjf%' order by i_data;

+----+-------------+-------+------------+------+---------------+------+---------+------+---------+----------+-----------------------------+

| id | select_type | table | partitions | type | possible_keys | key  | key_len | ref | rows | filtered | Extra |

+----+-------------+-------+------------+------+---------------+------+---------+------+---------+----------+-----------------------------+

|  1 | SIMPLE      | item | NULL     | ALL | NULL   | NULL | NULL | NULL | 9758658 |    11.11 | Using where; Using filesort |

+----+-------------+-------+------------+------+---------------+------+---------+------+---------+----------+-----------------------------+

1 row in set, 1 warning (0.00 sec)

The long running queries (as shown above) were using a full table scan as the access method, you can see by checking the value of the column type, in this case it’s  ALL. It means it will scan all the rows in the table to produce the data. The number of rows examined by the query is also quite large, around 9758658 rows, of course it will take more CPU time to spend on the query.

How ClusterControl Dashboards Identify is Running CPU High

ClusterControl helps with your daily routine and tasks and let’s you know if there’s something happening in your system, such as a high CPU. You can check the dashboard directly regarding CPU utilization. 

As you can see on the screenshot above, we can clearly tell that CPU utilisation is quite high and there are significant spikes even up to 87%. The graph do not tell more, but you can always check the ‘top’ command in the shell or you can dig up what are currently running processes in the server from Top dashboard, as shown below :

If you see from the top dashboard, most of the CPU resources are taken by the mysqld daemon process. This mysqld process is the suspect who consumes a lot of CPU resources. You can dig inside the database more to check what is running, you also can check the running queries and top queries in the database through dashboard as shown below 

Running Queries Dashboard

From the Running Queries dashboard, you can see the query executed, time spent of the query, state of the query itself. User and db info is related to the user who executed the query in which database.

Top Queries Dashboard

From the Top Queries dashboard, we can see the query that is causing the problem. The query scans 10614051 rows in the item table. The average execution time of the query is around 12.4 seconds, which is quite long for the query. 

Conclusion

Troubleshooting CPU high is not so difficult, you just need to know what is currently running in the database server, with the help of the right tool, you can fix the problem immediately.


How to Fix a Lock Wait Timeout Exceeded Error in MySQL

$
0
0

One of the most popular InnoDB's errors is InnoDB lock wait timeout exceeded, for example:

SQLSTATE[HY000]: General error: 1205 Lock wait timeout exceeded; try restarting transaction

The above simply means the transaction has reached the innodb_lock_wait_timeout while waiting to obtain an exclusive lock which defaults to 50 seconds. The common causes are:

  1. The offensive transaction is not fast enough to commit or rollback the transaction within innodb_lock_wait_timeout duration.
  2. The offensive transaction is waiting for row lock to be released by another transaction.

The Effects of a InnoDB Lock Wait Timeout

InnoDB lock wait timeout can cause two major implications:

  • The failed statement is not being rolled back by default.
  • Even if innodb_rollback_on_timeout is enabled, when a statement fails in a transaction, ROLLBACK is still a more expensive operation than COMMIT.

Let's play around with a simple example to better understand the effect. Consider the following two tables in database mydb:

mysql> CREATE SCHEMA mydb;
mysql> USE mydb;

The first table (table1):

mysql> CREATE TABLE table1 ( id INT PRIMARY KEY AUTO_INCREMENT, data VARCHAR(50));
mysql> INSERT INTO table1 SET data = 'data #1';

The second table (table2):

mysql> CREATE TABLE table2 LIKE table1;
mysql> INSERT INTO table2 SET data = 'data #2';

We executed our transactions in two different sessions in the following order:

Ordering

Transaction #1 (T1)

Transaction #2 (T2)

1

SELECT * FROM table1;

(OK)

SELECT * FROM table1;

(OK)

2

UPDATE table1 SET data = 'T1 is updating the row' WHERE id = 1;  

(OK)


3


UPDATE table2 SET data = 'T2 is updating the row' WHERE id = 1; 

(OK)

4


UPDATE table1 SET data = 'T2 is updating the row' WHERE id = 1; 

(Hangs for a while and eventually returns an error "Lock wait timeout exceeded; try restarting transaction")

5

COMMIT;

(OK)


6


COMMIT;

(OK)

However, the end result after step #6 might be surprising if we did not retry the timed out statement at step #4:
mysql> SELECT * FROM table1 WHERE id = 1;
+----+-----------------------------------+
| id | data                              |
+----+-----------------------------------+
| 1  | T1 is updating the row            |
+----+-----------------------------------+


mysql> SELECT * FROM table2 WHERE id = 1;
+----+-----------------------------------+
| id | data                              |
+----+-----------------------------------+
| 1  | T2 is updating the row            |
+----+-----------------------------------+

After T2 was successfully committed, one would expect to get the same output "T2 is updating the row" for both table1 and table2 but the results show that only table2 was updated. One might think that if any error encounters within a transaction, all statements in the transaction would automatically get rolled back, or if a transaction is successfully committed, the whole statements were executed atomically. This is true for deadlock, but not for InnoDB lock wait timeout.

Unless you set innodb_rollback_on_timeout=1 (default is 0 - disabled), automatic rollback is not going to happen for InnoDB lock wait timeout error. This means, by following the default setting, MySQL is not going to fail and rollback the whole transaction, nor retrying again the timed out statement and just process the next statements until it reaches COMMIT or ROLLBACK. This explains why transaction T2 was partially committed!

The InnoDB documentation clearly says "InnoDB rolls back only the last statement on a transaction timeout by default". In this case, we do not get the transaction atomicity offered by InnoDB. The atomicity in ACID compliant is either we get all or nothing of the transaction, which means partial transaction is merely unacceptable.

Dealing With a InnoDB Lock Wait Timeout

So, if you are expecting a transaction to auto-rollback when encounters an InnoDB lock wait error, similarly as what would happen in deadlock, set the following option in MySQL configuration file:

innodb_rollback_on_timeout=1

A MySQL restart is required. When deploying a MySQL-based cluster, ClusterControl will always set innodb_rollback_on_timeout=1 on every node. Without this option, your application has to retry the failed statement, or perform ROLLBACK explicitly to maintain the transaction atomicity.

To verify if the configuration is loaded correctly:

mysql> SHOW GLOBAL VARIABLES LIKE 'innodb_rollback_on_timeout';
+----------------------------+-------+
| Variable_name              | Value |
+----------------------------+-------+
| innodb_rollback_on_timeout | ON    |
+----------------------------+-------+

To check whether the new configuration works, we can track the com_rollback counter when this error happens:

mysql> SHOW GLOBAL STATUS LIKE 'com_rollback';
+---------------+-------+
| Variable_name | Value |
+---------------+-------+
| Com_rollback  | 1     |
+---------------+-------+

Tracking the Blocking Transaction

There are several places that we can look to track the blocking transaction or statements. Let's start by looking into InnoDB engine status under TRANSACTIONS section:

mysql> SHOW ENGINE INNODB STATUS\G
------------
TRANSACTIONS
------------

...

---TRANSACTION 3100, ACTIVE 2 sec starting index read
mysql tables in use 1, locked 1
LOCK WAIT 2 lock struct(s), heap size 1136, 1 row lock(s)
MySQL thread id 50, OS thread handle 139887555282688, query id 360 localhost ::1 root updating
update table1 set data = 'T2 is updating the row' where id = 1

------- TRX HAS BEEN WAITING 2 SEC FOR THIS LOCK TO BE GRANTED:
RECORD LOCKS space id 6 page no 4 n bits 72 index PRIMARY of table `mydb`.`table1` trx id 3100 lock_mode X locks rec but not gap waiting
Record lock, heap no 2 PHYSICAL RECORD: n_fields 4; compact format; info bits 0
 0: len 4; hex 80000001; asc     ;;
 1: len 6; hex 000000000c19; asc       ;;
 2: len 7; hex 020000011b0151; asc       Q;;
 3: len 22; hex 5431206973207570646174696e672074686520726f77; asc T1 is updating the row;;
------------------

---TRANSACTION 3097, ACTIVE 46 sec
2 lock struct(s), heap size 1136, 1 row lock(s), undo log entries 1
MySQL thread id 48, OS thread handle 139887556167424, query id 358 localhost ::1 root
Trx read view will not see trx with id >= 3097, sees < 3097

From the above information, we can get an overview of the transactions that are currently active in the server. Transaction 3097 is currently locking a row that needs to be accessed by transaction 3100. However, the above output does not tell us the actual query text that could help us figuring out which part of the query/statement/transaction that we need to investigate further. By using the blocker MySQL thread ID 48, let's see what we can gather from MySQL processlist:

mysql> SHOW FULL PROCESSLIST;
+----+-----------------+-----------------+--------------------+---------+------+------------------------+-----------------------+
| Id | User            | Host            | db                 | Command | Time | State                  | Info                  |
+----+-----------------+-----------------+--------------------+---------+------+------------------------+-----------------------+
| 4  | event_scheduler | localhost       | <null>             | Daemon  | 5146 | Waiting on empty queue | <null>                |
| 10 | root            | localhost:56042 | performance_schema | Query   | 0    | starting               | show full processlist |
| 48 | root            | localhost:56118 | mydb               | Sleep   | 145  |                        | <null>                |
| 50 | root            | localhost:56122 | mydb               | Sleep   | 113  |                        | <null>                |
+----+-----------------+-----------------+--------------------+---------+------+------------------------+-----------------------+

Thread ID 48 shows the command as 'Sleep'. Still, this does not help us much to know which statements that block the other transaction. This is because the statement in this transaction has been executed and this open transaction is basically doing nothing at the moment. We need to dive further down to see what is going on with this thread.

For MySQL 8.0, the InnoDB lock wait instrumentation is available under data_lock_waits table inside performance_schema database (or innodb_lock_waits table inside sys database). If a lock wait event is happening, we should see something like this:

mysql> SELECT * FROM performance_schema.data_lock_waits\G
***************************[ 1. row ]***************************
ENGINE                           | INNODB
REQUESTING_ENGINE_LOCK_ID        | 139887595270456:6:4:2:139887487554680
REQUESTING_ENGINE_TRANSACTION_ID | 3100
REQUESTING_THREAD_ID             | 89
REQUESTING_EVENT_ID              | 8
REQUESTING_OBJECT_INSTANCE_BEGIN | 139887487554680
BLOCKING_ENGINE_LOCK_ID          | 139887595269584:6:4:2:139887487548648
BLOCKING_ENGINE_TRANSACTION_ID   | 3097
BLOCKING_THREAD_ID               | 87
BLOCKING_EVENT_ID                | 9
BLOCKING_OBJECT_INSTANCE_BEGIN   | 139887487548648

Note that in MySQL 5.6 and 5.7, the similar information is stored inside innodb_lock_waits table under information_schema database. Pay attention to the BLOCKING_THREAD_ID value. We can use the this information to look for all statements being executed by this thread in events_statements_history table:

mysql> SELECT * FROM performance_schema.events_statements_history WHERE `THREAD_ID` = 87;
0 rows in set

It looks like the thread information is no longer there. We can verify by checking the minimum and maximum value of the thread_id column in events_statements_history table with the following query:

mysql> SELECT min(`THREAD_ID`), max(`THREAD_ID`) FROM performance_schema.events_statements_history;
+------------------+------------------+
| min(`THREAD_ID`) | max(`THREAD_ID`) |
+------------------+------------------+
| 98               | 129              |
+------------------+------------------+

The thread that we were looking for (87) has been truncated from the table. We can confirm this by looking at the size of event_statements_history table:

mysql> SELECT @@performance_schema_events_statements_history_size;
+-----------------------------------------------------+
| @@performance_schema_events_statements_history_size |
+-----------------------------------------------------+
| 10                                                  |
+-----------------------------------------------------+

The above means the events_statements_history can only store the last 10 threads. Fortunately, performance_schema has another table to store more rows called events_statements_history_long, which stores similar information but for all threads and it can contain way more rows:

mysql> SELECT @@performance_schema_events_statements_history_long_size;
+----------------------------------------------------------+
| @@performance_schema_events_statements_history_long_size |
+----------------------------------------------------------+
| 10000                                                    |
+----------------------------------------------------------+

However, you will get an empty result if you try to query the events_statements_history_long table for the first time. This is expected because by default, this instrumentation is disabled in MySQL as we can see in the following setup_consumers table:

mysql> SELECT * FROM performance_schema.setup_consumers;
+----------------------------------+---------+
| NAME                             | ENABLED |
+----------------------------------+---------+
| events_stages_current            | NO      |
| events_stages_history            | NO      |
| events_stages_history_long       | NO      |
| events_statements_current        | YES     |
| events_statements_history        | YES     |
| events_statements_history_long   | NO      |
| events_transactions_current      | YES     |
| events_transactions_history      | YES     |
| events_transactions_history_long | NO      |
| events_waits_current             | NO      |
| events_waits_history             | NO      |
| events_waits_history_long        | NO      |
| global_instrumentation           | YES     |
| thread_instrumentation           | YES     |
| statements_digest                | YES     |
+----------------------------------+---------+

To activate table events_statements_history_long, we need to update the setup_consumers table as below:

mysql> UPDATE performance_schema.setup_consumers SET enabled = 'YES' WHERE name = 'events_statements_history_long';

Verify if there are rows in the events_statements_history_long table now:

mysql> SELECT count(`THREAD_ID`) FROM performance_schema.events_statements_history_long;
+--------------------+
| count(`THREAD_ID`) |
+--------------------+
| 4                  |
+--------------------+

Cool. Now we can wait until the InnoDB lock wait event raises again and when it is happening, you should see the following row in the data_lock_waits table:

mysql> SELECT * FROM performance_schema.data_lock_waits\G
***************************[ 1. row ]***************************
ENGINE                           | INNODB
REQUESTING_ENGINE_LOCK_ID        | 139887595270456:6:4:2:139887487555024
REQUESTING_ENGINE_TRANSACTION_ID | 3083
REQUESTING_THREAD_ID             | 60
REQUESTING_EVENT_ID              | 9
REQUESTING_OBJECT_INSTANCE_BEGIN | 139887487555024
BLOCKING_ENGINE_LOCK_ID          | 139887595269584:6:4:2:139887487548648
BLOCKING_ENGINE_TRANSACTION_ID   | 3081
BLOCKING_THREAD_ID               | 57
BLOCKING_EVENT_ID                | 8
BLOCKING_OBJECT_INSTANCE_BEGIN   | 139887487548648

Again, we use the BLOCKING_THREAD_ID value to filter all statements that have been executed by this thread against events_statements_history_long table: 

mysql> SELECT `THREAD_ID`,`EVENT_ID`,`EVENT_NAME`, `CURRENT_SCHEMA`,`SQL_TEXT` FROM events_statements_history_long 
WHERE `THREAD_ID` = 57
ORDER BY `EVENT_ID`;
+-----------+----------+-----------------------+----------------+----------------------------------------------------------------+
| THREAD_ID | EVENT_ID | EVENT_NAME            | CURRENT_SCHEMA | SQL_TEXT                                                       |
+-----------+----------+-----------------------+----------------+----------------------------------------------------------------+
| 57        | 1        | statement/sql/select  | <null>         | select connection_id()                                         |
| 57        | 2        | statement/sql/select  | <null>         | SELECT @@VERSION                                               |
| 57        | 3        | statement/sql/select  | <null>         | SELECT @@VERSION_COMMENT                                       |
| 57        | 4        | statement/com/Init DB | <null>         | <null>                                                         |
| 57        | 5        | statement/sql/begin   | mydb           | begin                                                          |
| 57        | 7        | statement/sql/select  | mydb           | select 'T1 is in the house'                                    |
| 57        | 8        | statement/sql/select  | mydb           | select * from table1                                           |
| 57        | 9        | statement/sql/select  | mydb           | select 'some more select'                                      |
| 57        | 10       | statement/sql/update  | mydb           | update table1 set data = 'T1 is updating the row' where id = 1 |
+-----------+----------+-----------------------+----------------+----------------------------------------------------------------+

Finally, we found the culprit. We can tell by looking at the sequence of events of thread 57 where the above transaction (T1) still has not finished yet (no COMMIT or ROLLBACK), and we can see the very last statement has obtained an exclusive lock to the row for update operation which needed by the other transaction (T2) and just hanging there. That explains why we see 'Sleep' in the MySQL processlist output.

As we can see, the above SELECT statement requires you to get the thread_id value beforehand. To simplify this query, we can use IN clause and a subquery to join both tables. The following query produces an identical result like the above:

mysql> SELECT `THREAD_ID`,`EVENT_ID`,`EVENT_NAME`, `CURRENT_SCHEMA`,`SQL_TEXT` from events_statements_history_long WHERE `THREAD_ID` IN (SELECT `BLOCKING_THREAD_ID` FROM data_lock_waits) ORDER BY `EVENT_ID`;
+-----------+----------+-----------------------+----------------+----------------------------------------------------------------+
| THREAD_ID | EVENT_ID | EVENT_NAME            | CURRENT_SCHEMA | SQL_TEXT                                                       |
+-----------+----------+-----------------------+----------------+----------------------------------------------------------------+
| 57        | 1        | statement/sql/select  | <null>         | select connection_id()                                         |
| 57        | 2        | statement/sql/select  | <null>         | SELECT @@VERSION                                               |
| 57        | 3        | statement/sql/select  | <null>         | SELECT @@VERSION_COMMENT                                       |
| 57        | 4        | statement/com/Init DB | <null>         | <null>                                                         |
| 57        | 5        | statement/sql/begin   | mydb           | begin                                                          |
| 57        | 7        | statement/sql/select  | mydb           | select 'T1 is in the house'                                    |
| 57        | 8        | statement/sql/select  | mydb           | select * from table1                                           |
| 57        | 9        | statement/sql/select  | mydb           | select 'some more select'                                      |
| 57        | 10       | statement/sql/update  | mydb           | update table1 set data = 'T1 is updating the row' where id = 1 |
+-----------+----------+-----------------------+----------------+----------------------------------------------------------------+

However, it is not practical for us to execute the above query whenever InnoDB lock wait event occurs. Apart from the error from the application, how would you know that the lock wait event is happening? We can automate this query execution with the following simple Bash script, called track_lockwait.sh:

$ cat track_lockwait.sh
#!/bin/bash
## track_lockwait.sh
## Print out the blocking statements that causing InnoDB lock wait

INTERVAL=5
DIR=/root/lockwait/

[ -d $dir ] || mkdir -p $dir

while true; do
  check_query=$(mysql -A -Bse 'SELECT THREAD_ID,EVENT_ID,EVENT_NAME,CURRENT_SCHEMA,SQL_TEXT FROM events_statements_history_long WHERE THREAD_ID IN (SELECT BLOCKING_THREAD_ID FROM data_lock_waits) ORDER BY EVENT_ID')

  # if $check_query is not empty
  if [[ ! -z $check_query ]]; then
    timestamp=$(date +%s)
    echo $check_query > $DIR/innodb_lockwait_report_${timestamp}
  fi

  sleep $INTERVAL
done

Apply executable permission and daemonize the script in the background:

$ chmod 755 track_lockwait.sh
$ nohup ./track_lockwait.sh &

Now, we just need to wait for the reports to be generated under the /root/lockwait directory. Depending on the database workload and row access patterns, you might probably see a lot of files under this directory. Monitor the directory closely otherwise it would be flooded with too many report files.

If you are using ClusterControl, you can enable the Transaction Log feature under Performance -> Transaction Log where ClusterControl will provide a report on deadlocks and long-running transactions which will ease up your life in finding the culprit.

Conclusion

It is really important to enable innodb_rollback_on_timeout if your application does not handle the InnoDB lock wait timeout error properly. Otherwise, you might lose the transaction atomicity, and tracking down the culprit is not a straightforward task.


An Overview of Generated Columns for PostgreSQL

$
0
0

PostgreSQL 12 comes with a great new feature, Generated Columns. The functionality isn’t exactly anything new, but the standardization, ease of use, accessibility, and performance has been improved in this new version.

A Generated Column is a special column in a table that contains data automatically generated from other data within the row. The content of the generated column is automatically populated and updated whenever the source data, such as any other columns in the row, are changed themselves.

Generated Columns in PostgreSQL 12+

In recent versions of PostgreSQL, generated columns are a built-in feature allowing the CREATE TABLE or ALTER TABLE statements to add a column in which the content is automatically ‘generated’ as a result of an expression. These expressions could be simple mathematical operations from other columns, or a more advanced immutable function.Some benefits of implementing a generated column into a database design include:

  • The ability to add a column to a table containing computed data without need of updating application code to generate the data to then include it within INSERT and UPDATE operations. 
  • Reducing processing time on extremely frequent SELECT statements that would process the data on the fly. Since the processing of the data is done at the time of INSERT or UPDATE, the data is generated once and the SELECT statements only need to retrieve the data. In heavy read environments, this may be preferable, as long as the extra data storage used is acceptable. 
  • Since generated columns are updated automatically when the source data itself is updated, adding a generated column will add an assumed guarantee that the data in the generated column is always correct. 

In PostgreSQL 12, only the ‘STORED’ type of generated column is available. In other database systems, a generated column with a type ‘VIRTUAL’ is available, which acts more like a view where the result is calculated on the fly when the data is retrieved. Since the functionality is so similar to views, and simply writing the operation into a select statement, the functionality isn’t as beneficial as the ‘STORED’ functionality discussed here, but there’s a chance future versions will include the feature. 

Creating a Table With a Generated Column is done when defining the column itself. In this example, the generated column is ‘profit’, and is automatically generated by subtracting the purchase_price from the sale_price columns, then multiplied by the quantity_sold column. 

CREATE TABLE public.transactions (

    transactions_sid serial primary key,

    transaction_date timestamp with time zone DEFAULT now() NOT NULL,

    product_name character varying NOT NULL,

    purchase_price double precision NOT NULL,

    sale_price double precision NOT NULL,

    quantity_sold integer NOT NULL,

    profit double precision NOT NULL GENERATED ALWAYS AS  ((sale_price - purchase_price) * quantity_sold) STORED

);

In this example, a ‘transactions’ table is created to track some basic transactions and profits of an imaginary coffee shop. Inserting data into this table will show some immediate results.

​severalnines=# INSERT INTO public.transactions (product_name, purchase_price, sale_price, quantity_sold) VALUES ('House Blend Coffee', 5, 11.99, 1);

severalnines=# INSERT INTO public.transactions (product_name, purchase_price, sale_price, quantity_sold) VALUES ('French Roast Coffee', 6, 12.99, 4);

severalnines=# INSERT INTO public.transactions (product_name, purchase_price, sale_price, quantity_sold) VALUES ('BULK: House Blend Coffee, 10LB', 40, 100, 6);


severalnines=# SELECT * FROM public.transactions;

 transactions_sid |       transaction_date |          product_name | purchase_price | sale_price | quantity_sold | profit

------------------+-------------------------------+--------------------------------+----------------+------------+---------------+--------

                1 | 2020-02-28 04:50:06.626371+00 | House Blend Coffee             | 5 | 11.99 | 1 | 6.99

                2 | 2020-02-28 04:50:53.313572+00 | French Roast Coffee            | 6 | 12.99 | 4 | 27.96

                3 | 2020-02-28 04:51:08.531875+00 | BULK: House Blend Coffee, 10LB |             40 | 100 | 6 | 360

When updating the row, the generated column will automatically update:

​severalnines=# UPDATE public.transactions SET sale_price = 95 WHERE transactions_sid = 3;

UPDATE 1


severalnines=# SELECT * FROM public.transactions WHERE transactions_sid = 3;

 transactions_sid |       transaction_date |          product_name | purchase_price | sale_price | quantity_sold | profit

------------------+-------------------------------+--------------------------------+----------------+------------+---------------+--------

                3 | 2020-02-28 05:55:11.233077+00 | BULK: House Blend Coffee, 10LB |             40 | 95 | 6 | 330

This will ensure that the generated column is always correct, with no additional logic needed on the application side. 

NOTE: Generated columns cannot be INSERTED into or UPDATED directly, and any attempt to do so will return in an ERROR:

severalnines=# INSERT INTO public.transactions (product_name, purchase_price, sale_price, quantity_sold, profit) VALUES ('BULK: House Blend Coffee, 10LB', 40, 95, 1, 95);

ERROR:  cannot insert into column "profit"

DETAIL:  Column "profit" is a generated column.


severalnines=# UPDATE public.transactions SET profit = 330 WHERE transactions_sid = 3;

ERROR:  column "profit" can only be updated to DEFAULT

DETAIL:  Column "profit" is a generated column.

Generated Columns on PostgreSQL 11 and Before

Even though built-in generated columns are new to version 12 of PostgreSQL, the functionally can still be achieved in earlier versions, it just needs a bit more setup with stored procedures and triggers. However, even with the ability to implement it on older versions, in addition to the added functionality that can be beneficial, strict data input compliance is harder to achieve, and depends on PL/pgSQL features and programming ingenuity. 

BONUS: The below example will also work on PostgreSQL 12+, so if the added functionality with a function / trigger combo is needed or desired in newer versions, this option is a valid fallback and not restricted to just versions older than 12. 

While this is a way to do it on previous versions of PostgreSQL, there are a couple of additional benefits of this method: 

  • Since mimicking the generated column uses a function, more complex calculations are able to be used. Generated Columns in version 12 require IMMUTABLE operations, but a trigger / function option could use a STABLE or VOLATILE type of function with greater possibilities and likely lesser performance accordingly. 
  • Using a function that has the option to be STABLE or VOLATILE also opens up the possibility to UPDATE additional columns, UPDATE other tables, or even create new data via INSERTS into other tables. (However, while these trigger / function options are much more flexible, that’s not to say an actual “Generated Column” is lacking, as it does what’s advertised with greater performance and efficiency.)

In this example, a trigger / function is set up to mimic the functionality of a PostgreSQL 12+ generated column, along with two pieces that raise an exception if an INSERT or UPDATE attempt to change the generated column. These can be omitted, but if they are omitted, exceptions will not be raised, and the actual data INSERTed or UPDATEd will be quietly discarded, which generally wouldn’t be recommended. 

The trigger itself is set to run BEFORE, which means the processing happens before the actual insert happens, and requires the RETURN of NEW, which is the RECORD that is modified to contain the new generated column value. This specific example was written to run on PostgreSQL version 11.

CREATE TABLE public.transactions (

    transactions_sid serial primary key,

    transaction_date timestamp with time zone DEFAULT now() NOT NULL,

    product_name character varying NOT NULL,

    purchase_price double precision NOT NULL,

    sale_price double precision NOT NULL,

    quantity_sold integer NOT NULL,

    profit double precision NOT NULL

);


CREATE OR REPLACE FUNCTION public.generated_column_function()

 RETURNS trigger

 LANGUAGE plpgsql

 IMMUTABLE

AS $function$

BEGIN


    -- This statement mimics the ERROR on built in generated columns to refuse INSERTS on the column and return an ERROR.

    IF (TG_OP = 'INSERT') THEN

        IF (NEW.profit IS NOT NULL) THEN

            RAISE EXCEPTION 'ERROR:  cannot insert into column "profit"' USING DETAIL = 'Column "profit" is a generated column.';

        END IF;

    END IF;


    -- This statement mimics the ERROR on built in generated columns to refuse UPDATES on the column and return an ERROR.

    IF (TG_OP = 'UPDATE') THEN

        -- Below, IS DISTINCT FROM is used because it treats nulls like an ordinary value. 

        IF (NEW.profit::VARCHAR IS DISTINCT FROM OLD.profit::VARCHAR) THEN

            RAISE EXCEPTION 'ERROR:  cannot update column "profit"' USING DETAIL = 'Column "profit" is a generated column.';

        END IF;

    END IF;


    NEW.profit := ((NEW.sale_price - NEW.purchase_price) * NEW.quantity_sold);

    RETURN NEW;


END;

$function$;


CREATE TRIGGER generated_column_trigger BEFORE INSERT OR UPDATE ON public.transactions FOR EACH ROW EXECUTE PROCEDURE public.generated_column_function();

NOTE: Make sure the function has the correct permissions / ownership to be executed by the desired application user(s).

As seen in the previous example, the results are the same in previous versions with a function / trigger solution:

​severalnines=# INSERT INTO public.transactions (product_name, purchase_price, sale_price, quantity_sold) VALUES ('House Blend Coffee', 5, 11.99, 1);

severalnines=# INSERT INTO public.transactions (product_name, purchase_price, sale_price, quantity_sold) VALUES ('French Roast Coffee', 6, 12.99, 4);

severalnines=# INSERT INTO public.transactions (product_name, purchase_price, sale_price, quantity_sold) VALUES ('BULK: House Blend Coffee, 10LB', 40, 100, 6);


severalnines=# SELECT * FROM public.transactions;

 transactions_sid |       transaction_date |          product_name | purchase_price | sale_price | quantity_sold | profit

------------------+-------------------------------+--------------------------------+----------------+------------+---------------+--------

                1 | 2020-02-28 00:35:14.855511-07 | House Blend Coffee             | 5 | 11.99 | 1 | 6.99

                2 | 2020-02-28 00:35:21.764449-07 | French Roast Coffee            | 6 | 12.99 | 4 | 27.96

                3 | 2020-02-28 00:35:27.708761-07 | BULK: House Blend Coffee, 10LB |             40 | 100 | 6 | 360

Updating the data will be similar. 

​severalnines=# UPDATE public.transactions SET sale_price = 95 WHERE transactions_sid = 3;

UPDATE 1


severalnines=# SELECT * FROM public.transactions WHERE transactions_sid = 3;

 transactions_sid |       transaction_date |          product_name | purchase_price | sale_price | quantity_sold | profit

------------------+-------------------------------+--------------------------------+----------------+------------+---------------+--------

                3 | 2020-02-28 00:48:52.464344-07 | BULK: House Blend Coffee, 10LB |             40 | 95 | 6 | 330

Lastly, attempting to INSERT into, or UPDATE the special column itself will result in an ERROR:

​severalnines=# INSERT INTO public.transactions (product_name, purchase_price, sale_price, quantity_sold, profit) VALUES ('BULK: House Blend Coffee, 10LB', 40, 95, 1, 95);

ERROR:  ERROR: cannot insert into column "profit"

DETAIL:  Column "profit" is a generated column.

CONTEXT:  PL/pgSQL function generated_column_function() line 7 at RAISE


severalnines=# UPDATE public.transactions SET profit = 3030 WHERE transactions_sid = 3;

ERROR:  ERROR: cannot update column "profit"

DETAIL:  Column "profit" is a generated column.

CONTEXT:  PL/pgSQL function generated_column_function() line 15 at RAISE

In this example, it does act differently than the first generated column setup in a couple of ways that should be noted:

  • If the ‘generated column’ is attempted to be updated but no row is found to be updated, it will return success with an “UPDATE 0” result, while an actual Generated Column in version 12 will still return an ERROR, even if no row is found to UPDATE.
  • When attempting to update the profit column, which ‘should’ always return an ERROR, if the specified value is the same as the correctly ‘generated’ value, it will succeed. Ultimately the data is correct, however, if the desire is to return an ERROR if the column is specified.

Documentation and PostgreSQL Community

The official documentation for the PostgreSQL Generated Columns is located at the official PostgreSQL Website. Check back when new major versions of PostgreSQL are released to discover new features when they appear. 

While generated columns in PostgreSQL 12 are fairly straight forward, implementing similar functionality in previous versions has the potential to get much more complicated. The PostgreSQL community is a very active, massive, worldwide, and multilingual community dedicated to helping people of any level of PostgreSQL experience solve problems and create new solutions such as this. 

  • IRC: Freenode has a very active channel called #postgres, where users help each other understand concepts, fix errors, or find other resources. A full list of available freenode channels for all things PostgreSQL can be found on the PostgreSQL.org website.
  • Mailing Lists: PostgreSQL has a handful of mailing lists that can be joined. Longer form questions / issues can be sent here, and can reach many more people than IRC at any given time. The lists can be found on the PostgreSQL Website, and the lists pgsql-general or pgsql-admin are good resources. 
  • Slack: The PostgreSQL community has also been thriving on Slack, and can be joined at postgresteam.slack.com. Much like IRC, an active community is available to answer questions and engage in all things PostgreSQL.

An Overview of Client-Side Field Level Encryption in MongoDB

$
0
0

Data often requires high end security on nearly every level of the data transaction so as to meet security policies, compliance, and government regulations. Organization reputation may be wrecked if there is unauthorized access to sensitive data, hence failure to comply with the outlined mandate. 

In this blog we will be discussing some of the security measures you can employ in regards to MongoDB,  especially focusing on the client side of things.

Scenarios Where Data May Be Accessed

There are several ways someone can access your MongoDB data, here are some of them...

  1. Capture of data over an insecure network. Someone can access your data through an API with a VPN network and it will be difficult to track them down. Data at rest is often the culprit in this case.
  2. A super user such as an administrator having direct access. This happens when you fail to define user roles and restrictions.
  3. Having access to on-disk data while reading databases of backup files.
  4. Reading the server memory and logged data.
  5. Accidental disclosure of data by staff member.

MongoDB Data Categories and How They are Secured

In general, any database system involves two type of data: 

  1. Data-at-rest : One that is stored in the database files
  2. Data-in-transit: One that is transacted between a client, server and the database.

MongoDB has an Encryption at Rest feature that encrypts database files on disk hence preventing access to on-disk database files.

Data-in-transit over a network can be secured in MongoDB through Transport Encryption using TLS/SSL by encrypting the data.

In the case of data being accidentally disclosed by a staff member for instance a receptionist on desktop screen, MongoDB integrates the Role-Based Access Control that allows administrators to grant and restrict collection-level permission for users.

Data transacted over the server may remain in memory and these approaches do not at any point address the security concern against data access in server memory. MongoDB therefore introduced Client-Side Field Level Encryption for encrypting specific fields of a document that involve confidential data.

Field Level Encryption

MongoDB works with documents that have defined fields. Some fields may be required to hold confidential information such as credit card number, social security number, patience diagnosis data and so much more.

Field Level Encryption will enable us to secure the fields and they can only be accessed by an authorized personnel with the decryption keys.

Encryption can be done in two ways

  1. Using a secret key. A single key is used for both encrypting and decrypting hence it has to be presented at source and destination transmission but kept secret by all parties.
  2. Using a public key. Uses a pair of keys whereby one is used to encrypt and the other used to decrypt

When applying Field Level Encryption consider using a new database setup rather than an existing one.

Client-Side Field Level Encryption (CSFLE)

Introduced in MongoDB version 4.2 Enterprise to offer database administrators with an adjustment to encrypt fields involving values that need to be secured. This is to say, the sensitive data is encrypted or decrypted by the client and only communicated to and from the server in an encrypted form. Besides, even super users who don’t have the encryption keys, will not have control over these encrypted data fields.

How to Implement CSFLE

In order for you to implement the Client-Side Field Level Encryption, you require the following:

  1. MongoDB Server 4.2 Enterprise
  2. MongoDB  Compatible with CSFLE
  3. File System Permissions
  4. Specific language drivers. (In our blog we are going to use Node.js)

The implementation procedure involves:

  • A local development environment with a software for running client and server
  • Generating and validating the encryption keys.
  • Configuring the client for automatic field-level encryption
  • Throughout operations in terms of queries of the encrypted fields.

CSFLE Implementation

CSFLE uses  the envelope encryption strategy whereby data encryption keys are encrypted with another key known as the master key. The Client application creates a master key that is stored in the Local Key Provider essentially the local file system.However, this storage approach is insecure hence in production, one is advised to configure the key in a Key Management System (KMS) that stores and decrypts data encryption keys remotely.

After the data encryption keys are generated, they are stored in the vault collection in the same MongoDB replica set as the encrypted data.

Create Master Key

In node js, we need to generate a 96-byte locally managed master key and write it to a file in the directory where the main script is executed from: 

$npm install fs && npm install crypto

Then in the script:

const crypto = require(“crypto”)

const fs = require(“fs”)


try{

fs.writeFileSync(‘masterKey.txt’, crypto.randomBytes(96))

}catch(err){

throw err;

}

Create Data Encryption Key

This key is stored in a key vault collection where CSFLE enabled clients can access the key for encryption/decryption. To generate one, you need the following:

  • Locally-managed master key
  • Connection to your database that is, the MongoDB connection string
  • Key vault namespace (database and collection)

Steps to Generate the Data Encryption Key

  1. Read the local master key generate before

const localMasterKey = fs.readFileSync(‘./masterKey.txt’);
  1. Specify the KMS provider settings that will be used by the client to discover the master key.

const kmsProvider = {

local: {

key: localMasterKey

}

}
  1. Creating the Data Encryption Key. We need to create a client with the MongoDB connection string and key vault namespace configuration. Let’s say we will have a database called users and inside it a keyVault collection. You need to install uuid-base64 first by running the command

$ npm install uuid-base64

Then in your script

const base64 = require('uuid-base64');

const keyVaultNamespace = 'users.keyVaul';

const client = new MongoClient('mongodb://localhost:27017', {

  useNewUrlParser: true,

  useUnifiedTopology: true,

});

async function createKey() {

  try {

    await client.connect();

    const encryption = new ClientEncryption(client, {

      keyVaultNamespace,

      kmsProvider,

    });

    const key = await encryption.createDataKey('local');

    const base64DataKeyId = key.toString('base64');

    const uuidDataKeyId = base64.decode(base64DataKeyId);

    console.log('DataKeyId [UUID]: ', uuidDataKeyId);

    console.log('DataKeyId [base64]: ', base64DataKeyId);

  } finally {

    await client.close();

  }

}

createKey();

You will then be presented with some result that resemble

DataKeyId [UUID]: ad4d735a-44789-48bc-bb93-3c81c3c90824

DataKeyId [base64]: 4K13FkSZSLy7kwABP4HQyD==

The client must have ReadWrite permissions on the specified key vault namespace


  1. To verify that the Data Encryption Key was created

const client = new MongoClient('mongodb://localhost:27017', {

  useNewUrlParser: true,

  useUnifiedTopology: true,

});


async function checkClient() {

  try {

    await client.connect();

    const keyDB = client.db(users);

    const keyColl = keyDB.collection(keyVault);

    const query = {

      _id: ‘4K13FkSZSLy7kwABP4HQyD==’,

    };

    const dataKey = await keyColl.findOne(query);

    console.log(dataKey);

  } finally {

    await client.close();

  }

}

checkClient();

You should receive some result of the sort

{

  _id: Binary {

    _bsontype: 'Binary',

    sub_type: 4,

    position: 2,

    buffer: <Buffer 68 ca d2 10 16 5d 45 bf 9d 1d 44 d4 91 a6 92 44>

  },

  keyMaterial: Binary {

    _bsontype: 'Binary',

    sub_type: 0,

    position: 20,

    buffer: <Buffer f1 4a 9f bd aa ac c9 89 e9 b3 da 48 72 8e a8 62 97 2a 4a a0 d2 d4 2d a8 f0 74 9c 16 4d 2c 95 34 19 22 05 05 84 0e 41 42 12 1e e3 b5 f0 b1 c5 a8 37 b8 ... 110 more bytes>

  },

  creationDate: 2020-02-08T11:10:20.021Z,

  updateDate: 2020-02-08T11:10:25.021Z,

  status: 0,

  masterKey: { provider: 'local' }

}

The returned document data incorporates: data encryption key id (UUID), data encryption key in encrypted form, KMS provider information of master key and metadata like day of creation.

Specifying Fields to be Encrypted Using the JSON Schema

A JSON Schema extension is used by the MongoDB drivers to configure automatic client-side encryption and decryption of the specified fields of documents in a collection. The CSFLE configuration for this schema will require: the encryption algorithm to use when encrypting each field, one or all the encryption keys encrypted with the CSFLE master key and the BSON Type of each field. 

However, this CSFLE JSON schema does not support document validation otherwise any validation instances will cause the client to throw an error. 

Clients who are not configured with the appropriate client-side JSON Schema can be restricted from writing unencrypted data to a field by using the server-side JSON Schema. 

There are mainly two encryption algorithms: Random and deterministic.

We will define some encryptMetadata key at root level of the JSON Schema and configure it with the fields to be encrypted by defining them in the properties field of the schema hence they will be able to inherit this encryption key.

{

    "bsonType" : "object",

    "encryptMetadata" : {

        "keyId" : // keyId generated here

    },

    "properties": {

        // field schemas here

    }

}

Let’s say you want to encrypt a bank account number field, you would do something like:

"bankAccountNumber": {

    "encrypt": {

        "bsonType": "int",

        "algorithm": "AEAD_AES_256_CBC_HMAC_SHA_512-Deterministic"

    }

}

Because of high cardinality and the field being queryable, we use the deterministic approach. Sensitive fields such as  blood type which have low query plan and low cardinality may be encrypted using the random approach.

Array fields should use random encryption with CSFLE to enhance auto-encryption for all the elements. 

Mongocryptd Application

Installed in the MongoDB Enterprise Service 4.2 and later, this is a separate encryption application that automates the Client-side Field Level Encryption. Whenever a CSFLE  enabled client is created, this service is automatically started by default to:

  • Validate encryption instructions outlined in the JSON Schema, detect which fields are to be encrypted in the throughput operations.
  • Prevent unsupported operations from being executed on the encrypted fields.

To insert the data we will do the normal insert query and the resulting document will have sample data below in regard with the bank account field.

{

…

"bankAccountNumber":"Ac+ZbPM+sk7gl7CJCcIzlRAQUJ+uo/0WhqX+KbTNdhqCszHucqXNiwqEUjkGlh7gK8pm2JhIs/P3//nkVP0dWu8pSs6TJnpfUwRjPfnI0TURzQ==",

…

}

When an authorized personnel performs a query, the driver will decrypt this data and return in in a readable format i.e 

{

…

"bankAccountNumber":43265436456456456756,

…

}

Note:  It is not possible to query for documents on a randomly encrypted field unless you use another field to find the document that contains an approximation of the randomly encrypted field data.

Conclusion

Data security should be considered at all levels in regard to one at rest and transit. MongoDB Enterprise 4.2 Server offers developers with a window to encrypt data from the client side using the Client-Side Field Level Encryption hence securing the data from the database host providers and insecure network access. CSFLE uses envelope encryption where a master key is used to encrypt data encryption keys. The master key should therefore be kept safe using key management tools such as Key Management System.


How to Install and Configure MaxScale for MariaDB

$
0
0

There are different reasons for adding a load balancer between your application and your database. If you have high traffic (and you want to balance the traffic between different database nodes) or you want to use the load balancer as a single endpoint (so in case of failover, this load balancer will cope with this issue sending the traffic to the available/healthy node.) It could also be that you want to use different ports to write and read data from your database. 

In all these cases, a load balancer will be useful for you, and if you have a MariaDB cluster, one option for this is using MaxScale which is a database proxy for MariaDB databases.

In this blog, we will show you how to install and configure it manually, and how ClusterControl can help you in this task. For this example, we will use a MariaDB replication cluster with 1 master and 1 slave node, and CentOS8 as the operating system.

How to Install MaxScale

We will assume you have your MariaDB database up and running, and also a machine (virtual or physical) to install MaxScale. We recommend you use a different host, so in case of master failure, MaxScale can failover to the slave node, otherwise, MaxScale can’t take any action if the server where it is running goes down.

There are different ways to install MaxScale, in this case, we will use the MariaDB repositories. To add it into the MaxScale server, you have to run:

$ curl -sS https://downloads.mariadb.com/MariaDB/mariadb_repo_setup | sudo bash

[info] Repository file successfully written to /etc/yum.repos.d/mariadb.repo

[info] Adding trusted package signing keys...

[info] Successfully added trusted package signing keys

Now, install the MaxScale package:

$ yum install maxscale

Now you have your MaxScale node installed, before starting, you need to configure it.

How to Configure MaxScale

As MaxScale perform tasks like authentication, monitoring, and more, you need to create a database user with some specific privileges:

MariaDB [(none)]> CREATE USER 'maxscaleuser'@'%' IDENTIFIED BY 'maxscalepassword';

MariaDB [(none)]> GRANT SELECT ON mysql.user TO 'maxscaleuser'@'%';

MariaDB [(none)]> GRANT SELECT ON mysql.db TO 'maxscaleuser'@'%';

MariaDB [(none)]> GRANT SELECT ON mysql.tables_priv TO 'maxscaleuser'@'%';

MariaDB [(none)]> GRANT SELECT ON mysql.roles_mapping TO 'maxscaleuser'@'%';

MariaDB [(none)]> GRANT SHOW DATABASES ON *.* TO 'maxscaleuser'@'%';

MariaDB [(none)]> GRANT REPLICATION CLIENT on *.* to 'maxscaleuser'@'%';

Keep in mind that MariaDB versions 10.2.2 to 10.2.10 also require:

MariaDB [(none)]> GRANT SELECT ON mysql.* TO 'maxscaleuser'@'%';

Now you have the database user ready, let’s see the configuration files. When you install MaxScale, the file maxscale.cnf will be created under /etc/. There are several variables and different ways to configure it, so let’s see an example:

$ cat  /etc/maxscale.cnf 

# Global parameters

[maxscale]

threads = auto

log_augmentation = 1

ms_timestamp = 1

syslog = 1


# Server definitions

[server1]

type=server

address=192.168.100.126

port=3306

protocol=MariaDBBackend

[server2]

type=server

address=192.168.100.127

port=3306

protocol=MariaDBBackend


# Monitor for the servers

[MariaDB-Monitor]

type=monitor

module=mariadbmon

servers=server1,server2

user=maxscaleuser

password=maxscalepassword

monitor_interval=2000


# Service definitions

[Read-Only-Service]

type=service

router=readconnroute

servers=server2

user=maxscaleuser

password=maxscalepassword

router_options=slave

[Read-Write-Service]

type=service

router=readwritesplit

servers=server1

user=maxscaleuser

password=maxscalepassword


# Listener definitions for the services

[Read-Only-Listener]

type=listener

service=Read-Only-Service

protocol=MariaDBClient

port=4008

[Read-Write-Listener]

type=listener

service=Read-Write-Service

protocol=MariaDBClient

port=4006

In this configuration, we have 2 database nodes, 192.168.100.126 (Master) and 192.168.100.127 (Slave), as you can see in the Servers Definition section.

We have also 2 different services, one for read-only, where there is the slave node, and another one for read-write where there is the master node.

Finally, we have 2 listeners, one for each service. The read-only listener, listening in the port 4008, and the read-write one, listening in the port 4006.

This is a basic configuration file. If you need something more specific you can follow the official MariaDB documentation.

Now you are ready to start it, so just run:

$ systemctl start maxscale.service

And check it:

$ maxctrl list services
ff
$ maxctrl list servers

You can find a maxctrl commands list here, or you can even use maxadmin to manage it.

Now let’s test the connection. For this, you can try to access your database using the MaxScale IP address and the port that you want to test. In our case, the traffic on the port 4006 should be sent to server1, and the traffic on the port 4008 to server2.

$ mysql -h 192.168.100.128 -umaxscaleuser -pmaxscalepassword -P4006 -e 'SELECT @@hostname;'

+------------+

| @@hostname |

+------------+

| server1   |

+------------+

$ mysql -h 192.168.100.128 -umaxscaleuser -pmaxscalepassword -P4008 -e 'SELECT @@hostname;'

+------------+

| @@hostname |

+------------+

| server2   |

+------------+

It works!

How to Deploy MaxScale with ClusterControl

Let’s see now, how you can use ClusterControl to simplify this task. For this, we will assume you have your MariaDB cluster added to ClusterControl.

Go to ClusterControl -> Select the MariaDB cluster -> Cluster Actions -> Add Load Balancer -> MaxScale.

Here you can deploy a new MaxScale node or you can also import an existing one. If you are deploying it, you need to add the IP Address or Hostname, the admin and user MaxScale credentials, amount of threads, and ports (write and read-only). You can also specify which database node you want to add to the MaxScale configuration.

You can monitor the task in the ClusterControl Activity section. When it finishes, you will have a new MaxScale node in your MariaDB cluster.

And running the MaxScale commands from the ClusterControl UI without the need of accessing the server via SSH.

It looks easier than deploying it manually, right?

Conclusion

Having a Load Balancer is a good solution if you want to balance or split your traffic, or even for failover actions, and MaxScale, as a MariaDB product, is a good option for MariaDB databases

The installation is easy, but the configuration and usage could be difficult if it is something new for you. In that case, you can use ClusterControl to deploy, configure, and manage it in an easier way.

A Message from Our CEO on the COVID-19 Pandemic

$
0
0

We wanted to take a moment to address how Severalnines is handling the Covid-19 pandemic. We have employees scattered across 16 countries over 5 continents, this means that some of our employees are at higher risk than others. 

The good news is that Severalnines is a fully remote organization, so for the most part it’s business as usual for us here. Our sales and support teams are ready to provide support to our prospects and customers as needed and we expect to maintain our average response times and service level agreements. Our product team is actively working on the next release of ClusterControl which comes with new features and several bug fixes.

We have encouraged our employees to follow the recommendations made by their local governments and the World Health Organization (WHO). Several of our employees have been impacted by the closure of schools around the world. To Severalnines, families come first, so we encourage our teams to work when their schedules allow and to focus on the health and security of their family as the priority. We’re postponing our in-person events as safety comes top of mind.

To our customers & potential customers, if your database operations have been impacted by illness or freezes in hiring, please contact your account manager to see how we can help. The database automation features of ClusterControl can reduce maintenance time, improve availability, and keep you up-and-running. 

Severalnines is full of amazing people and we are here to help you in any way we can.

Stay Safe, follow your regions recommendations for staying healthy, and we’ll see you on the other side.

Sincerely,

Vinay Joosery, CEO Severalnines

How to Replace an Intermediate MySQL or MariaDB Master with a Binlog Server using MaxScale

$
0
0

Binary logs (binlogs) contain records of all changes to the databases. They are necessary for replication and can also be used to restore data after a backup. A binlog server is basically a binary log repository. You can think of it like a server with a dedicated purpose to retrieve binary logs from a master, while slave servers can connect to it like they would connect to a master server.

Some advantages of having a binlog server over intermediate master to distribute replication workload are:

  • You can switch to a new master server without the slaves noticing that the actual master server has changed. This allows for a more highly available replication setup where replication is high-priority.
  • Reduce the load on the master by only serving Maxscale’s binlog server instead of all the slaves.
  • The data in the binary log of the intermediate master is not a direct copy of the data that was received from the binary log of the real master. As such, if group commit is used, this can cause a reduction in the parallelism of the commits and a subsequent reduction in the performance of the slave servers.
  • Intermediate slave has to re-execute every SQL statement which potentially adds latency and lags into the replication chain.

In this blog post, we are going to look into how to replace an intermediate master (a slave host relay to other slaves in a replication chain) with a binlog server running on MaxScale for better scalability and performance.

Architecture

We basically have a 4-node MariaDB v10.4 replication setup with one MaxScale v2.3 sitting on top of the replication to distribute incoming queries. Only one slave is connected to a master (intermediate master) and the other slaves replicate from the intermediate master to serve read workloads, as illustrated in the following diagram.

We are going to turn the above topology into this:

Basically, we are going to remove the intermediate master role and replace it with a binlog server running on MaxScale. The intermediate master will be converted to a standard slave, just like other slave hosts. The binlog service will be listening on port 5306 on the MaxScale host. This is the port that all slaves will be connecting to for replication later on.

Configuring MaxScale as a Binlog Server

In this example, we already have a MaxScale sitting on top of our replication cluster acting as a load balancer for our applications. If you don't have a MaxScale, you can use ClusterControl to deploy simply go to Cluster Actions -> Add Load Balancer -> MaxScale and fill up the necessary information as the following:

Before we get started, let's export the current MaxScale configuration into a text file for backup. MaxScale has a flag called --export-config for this purpose but it must be executed as maxscale user. Thus, the command to export is:

$ su -s /bin/bash -c '/bin/maxscale --export-config=/tmp/maxscale.cnf' maxscale

On the MariaDB master, create a replication slave user called 'maxscale_slave' to be used by the MaxScale and assign it with the following privileges:

$ mysql -uroot -p -h192.168.0.91 -P3306
MariaDB> CREATE USER 'maxscale_slave'@'%' IDENTIFIED BY 'BtF2d2Kc8H';
MariaDB> GRANT SELECT ON mysql.user TO 'maxscale_slave'@'%';
MariaDB> GRANT SELECT ON mysql.db TO 'maxscale_slave'@'%';
MariaDB> GRANT SELECT ON mysql.tables_priv TO 'maxscale_slave'@'%';
MariaDB> GRANT SELECT ON mysql.roles_mapping TO 'maxscale_slave'@'%';
MariaDB> GRANT SHOW DATABASES ON *.* TO 'maxscale_slave'@'%';
MariaDB> GRANT REPLICATION SLAVE ON *.* TO 'maxscale_slave'@'%';

For ClusterControl users, go to Manage -> Schemas and Users to create the necessary privileges.

Before we move further with the configuration, it's important to review the current state and topology of our backend servers:

$ maxctrl list servers
┌────────┬──────────────┬──────┬─────────────┬──────────────────────────────┬───────────┐
│ Server │ Address      │ Port │ Connections │ State                        │ GTID      │
├────────┼──────────────┼──────┼─────────────┼──────────────────────────────┼───────────┤
│ DB_757 │ 192.168.0.90 │ 3306 │ 0           │ Master, Running              │ 0-38001-8 │
├────────┼──────────────┼──────┼─────────────┼──────────────────────────────┼───────────┤
│ DB_758 │ 192.168.0.91 │ 3306 │ 0           │ Relay Master, Slave, Running │ 0-38001-8 │
├────────┼──────────────┼──────┼─────────────┼──────────────────────────────┼───────────┤
│ DB_759 │ 192.168.0.92 │ 3306 │ 0           │ Slave, Running               │ 0-38001-8 │
├────────┼──────────────┼──────┼─────────────┼──────────────────────────────┼───────────┤
│ DB_760 │ 192.168.0.93 │ 3306 │ 0           │ Slave, Running               │ 0-38001-8 │
└────────┴──────────────┴──────┴─────────────┴──────────────────────────────┴───────────┘

As we can see, the current master is DB_757 (192.168.0.90). Take note of this information as we are going to setup the binlog server to replicate from this master.

Open the MaxScale configuration file at /etc/maxscale.cnf and add the following lines:

[replication-service]
type=service
router=binlogrouter
user=maxscale_slave
password=BtF2d2Kc8H
version_string=10.4.12-MariaDB-log
server_id=9999
master_id=9999
mariadb10_master_gtid=true
filestem=binlog
binlogdir=/var/lib/maxscale/binlogs
semisync=true # if semisync is enabled on the master

[binlog-server-listener]
type=listener
service=replication-service
protocol=MariaDBClient
port=5306
address=0.0.0.0

A bit of explanation - We are creating two components - service and listener. Service is where we define the binlog server characteristic and how it should run. Details on every option can be found here. In this example, our replication servers are running with semi-sync replication, thus we have to use semisync=true so it will connect to the master via semi-sync replication method. The listener is where we map the listening port with the binlogrouter service inside MaxScale.

Restart MaxScale to load the changes:

$ systemctl restart maxscale

Verify the binlog service is started via maxctrl (look at the State column):

$ maxctrl show service replication-service

Verify that MaxScale is now listening to a new port for the binlog service:

$ netstat -tulpn | grep maxscale
tcp        0 0 0.0.0.0:3306            0.0.0.0:* LISTEN   4850/maxscale
tcp        0 0 0.0.0.0:3307            0.0.0.0:* LISTEN   4850/maxscale
tcp        0 0 0.0.0.0:5306            0.0.0.0:* LISTEN   4850/maxscale
tcp        0 0 127.0.0.1:8989          0.0.0.0:* LISTEN   4850/maxscale

We are now ready to establish a replication link between MaxScale and the master.

Activating the Binlog Server

Log into the MariaDB master server and retrieve the current binlog file and position:

MariaDB> SHOW MASTER STATUS;
+---------------+----------+--------------+------------------+
| File          | Position | Binlog_Do_DB | Binlog_Ignore_DB |
+---------------+----------+--------------+------------------+
| binlog.000005 |     4204 |              |                  |
+---------------+----------+--------------+------------------+

Use BINLOG_GTID_POS function to get the GTID value:

MariaDB> SELECT BINLOG_GTID_POS("binlog.000005", 4204);
+----------------------------------------+
| BINLOG_GTID_POS("binlog.000005", 4204) |
+----------------------------------------+
| 0-38001-31                             |
+----------------------------------------+

Back to the MaxScale server, install MariaDB client package:

$ yum install -y mysql-client

Connect to the binlog server listener on port 5306 as maxscale_slave user and establish a replication link to the designated master. Use the GTID value retrieved from the master:

(maxscale)$ mysql -u maxscale_slave -p'BtF2d2Kc8H' -h127.0.0.1 -P5306
MariaDB> SET @@global.gtid_slave_pos = '0-38001-31';
MariaDB> CHANGE MASTER TO MASTER_HOST = '192.168.0.90', MASTER_USER = 'maxscale_slave', MASTER_PASSWORD = 'BtF2d2Kc8H', MASTER_PORT=3306, MASTER_USE_GTID = slave_pos;
MariaDB> START SLAVE;
MariaDB [(none)]> SHOW SLAVE STATUS\G
*************************** 1. row ***************************
                 Slave_IO_State: Binlog Dump
                  Master_Host: 192.168.0.90
                  Master_User: maxscale_slave
                  Master_Port: 3306
             Slave_IO_Running: Yes
            Slave_SQL_Running: Yes
             Master_Server_Id: 38001
             Master_Info_File: /var/lib/maxscale/binlogs/master.ini
      Slave_SQL_Running_State: Slave running
                  Gtid_IO_Pos: 0-38001-31

Note: The above output has been truncated to show only important lines.

Pointing Slaves to the Binlog Server

Now on mariadb2 and mariadb3 (the end slaves), change the master pointing to the MaxScale binlog server. Since we are running with semi-sync replication enabled, we have to turn them off first:

(mariadb2 & mariadb3)$ mysql -uroot -p
MariaDB> STOP SLAVE;
MariaDB> SET global rpl_semi_sync_master_enabled = 0; -- if semisync is enabled
MariaDB> SET global rpl_semi_sync_slave_enabled = 0; -- if semisync is enabled
MariaDB> CHANGE MASTER TO MASTER_HOST = '192.168.0.95', MASTER_USER = 'maxscale_slave', MASTER_PASSWORD = 'BtF2d2Kc8H', MASTER_PORT=5306, MASTER_USE_GTID = slave_pos;
MariaDB> START SLAVE;
MariaDB> SHOW SLAVE STATUS\G
*************************** 1. row ***************************
                Slave_IO_State: Waiting for master to send event
                   Master_Host: 192.168.0.95
                   Master_User: maxscale_slave
                   Master_Port: 5306
              Slave_IO_Running: Yes
             Slave_SQL_Running: Yes
              Master_Server_Id: 9999
                    Using_Gtid: Slave_Pos
                   Gtid_IO_Pos: 0-38001-32
       Slave_SQL_Running_State: Slave has read all relay log; waiting for the slave I/O thread to update it

Note: The above output has been truncated to show only important lines.

Inside my.cnf, we have to comment the following lines to disable semi-sync in the future:

#loose_rpl_semi_sync_slave_enabled=ON
#loose_rpl_semi_sync_master_enabled=ON

At this point, the intermediate master (mariadb1) is still replicating from the master (mariadb0) while other slaves have been replicating from the binlog server. Our current topology can be illustrated like the diagram below:

The final part is to change the master pointing of the intermediate master (mariadb1) after all slaves that used to attach to it are no longer there. The steps are basically the same with the other slaves:

(mariadb1)$ mysql -uroot -p
MariaDB> STOP SLAVE;
MariaDB> SET global rpl_semi_sync_master_enabled = 0; -- if semisync is enabled
MariaDB> SET global rpl_semi_sync_slave_enabled = 0; -- if semisync is enabled
MariaDB> CHANGE MASTER TO MASTER_HOST = '192.168.0.95', MASTER_USER = 'maxscale_slave', MASTER_PASSWORD = 'BtF2d2Kc8H', MASTER_PORT=5306, MASTER_USE_GTID = slave_pos;
MariaDB> START SLAVE;
MariaDB> SHOW SLAVE STATUS\G
*************************** 1. row ***************************
                Slave_IO_State: Waiting for master to send event
                   Master_Host: 192.168.0.95
                   Master_User: maxscale_slave
                   Master_Port: 5306
              Slave_IO_Running: Yes
             Slave_SQL_Running: Yes
              Master_Server_Id: 9999
                    Using_Gtid: Slave_Pos
                   Gtid_IO_Pos: 0-38001-32

Note: The above output has been truncated to show only important lines.

Don't forget to disable semi-sync replication in my.cnf as well:

#loose_rpl_semi_sync_slave_enabled=ON
#loose_rpl_semi_sync_master_enabled=ON

We can the verify the binlog router service has more connections now via maxctrl CLI:

$ maxctrl list services
┌─────────────────────┬────────────────┬─────────────┬───────────────────┬───────────────────────────────────┐
│ Service             │ Router         │ Connections │ Total Connections │ Servers                           │
├─────────────────────┼────────────────┼─────────────┼───────────────────┼───────────────────────────────────┤
│ rw-service          │ readwritesplit │ 1           │ 1                 │ DB_757, DB_758, DB_759, DB_760    │
├─────────────────────┼────────────────┼─────────────┼───────────────────┼───────────────────────────────────┤
│ rr-service          │ readconnroute  │ 1           │ 1                 │ DB_757, DB_758, DB_759, DB_760    │
├─────────────────────┼────────────────┼─────────────┼───────────────────┼───────────────────────────────────┤
│ replication-service │ binlogrouter   │ 4           │ 51                │ binlog_router_master_host, DB_757 │
└─────────────────────┴────────────────┴─────────────┴───────────────────┴───────────────────────────────────┘

Also, common replication administration commands can be used inside the MaxScale binlog server, for example, we can verify the connected slave hosts by using this command:

(maxscale)$ mysql -u maxscale_slave -p'BtF2d2Kc8H' -h127.0.0.1 -P5306
MariaDB> SHOW SLAVE HOSTS;
+-----------+--------------+------+-----------+------------+
| Server_id | Host         | Port | Master_id | Slave_UUID |
+-----------+--------------+------+-----------+------------+
| 38003     | 192.168.0.92 | 3306 | 9999      |            |
| 38002     | 192.168.0.91 | 3306 | 9999      |            |
| 38004     | 192.168.0.93 | 3306 | 9999      |            |
+-----------+--------------+------+-----------+------------+

At this point, our topology is looking as what we anticipated:

Our migration from intermediate master setup to binlog server setup is now complete.

 
Viewing all 1258 articles
Browse latest View live


<script src="https://jsc.adskeeper.com/r/s/rssing.com.1596347.js" async> </script>