Keeping backups of your database is one of the most important tasks in any production environment. It is the process of copying your data to some other place to keep it safe. This can be useful in recovery from emergency situations like database corruption or a database crashing beyond repair.
Apart from recovery, a backup can also be used to mimic a production database for testing an application in a different environment, or even to debug something that can not be done on the production database.
There are various methods of database backups that you can implement, from logical backup using tools that are embedded in the database (eg. mysqldump, mongodump, pg_dump) to physical backup using third party tools (eg. xtrabackup, barman, pgbackrest, mongodb consistent backup).
Which method to use is often determined on how you would like to restore. For instance, assume you dropped a table or a collection by mistake. Unlikely as it might seem, it does happen. So the fastest way to recover would be to restore just that table or collection, instead of having to restore an entire database.
Backup and Restore in Mongodb
Mongodump and mongorestore is the tool for logical backup used in MongoDB, it is kind of mysqldump in MySQL, or pg_dump in PostgreSQL. The mongodump and mongorestore utility will be included when you install MongoDB and it dumps the data in BSON format. Mongodump is used to backup the database logically into dump files, while mongorestore is used for the restore operation.
mongodump and mongorestore commands are easy to use, although there are a lot of options.
As we can see below, you can backup specific databases or collections. You can even take a point in time snapshot by including the oplog.
root@n2:~# mongodump --help

Usage:

  mongodump <options>


Export the content of a running server into .bson files.


Specify a database with -d and a collection with -c to only dump that database or collection.


See http://docs.mongodb.org/manual/reference/program/mongodump/ for more information.


general options:

      --help                                                print usage

      --version                                             print the tool version and exit


verbosity options:

  -v, --verbose=<level>                                     more detailed log output (include multiple times for more verbosity, e.g. -vvvvv, or specify a numeric value, e.g. --verbose=N)

      --quiet                                               hide all log output


connection options:

  -h, --host=<hostname>                                     mongodb host to connect to (setname/host1,host2 for replica sets)

      --port=<port>                                         server port (can also use --host hostname:port)


kerberos options:

      --gssapiServiceName=<service-name>                    service name to use when authenticating using GSSAPI/Kerberos ('mongodb' by default)

      --gssapiHostName=<host-name>                          hostname to use when authenticating using GSSAPI/Kerberos (remote server's address by default)


ssl options:

      --ssl                                                 connect to a mongod or mongos that has ssl enabled

      --sslCAFile=<filename>                                the .pem file containing the root certificate chain from the certificate authority

      --sslPEMKeyFile=<filename>                            the .pem file containing the certificate and key

      --sslPEMKeyPassword=<password>                        the password to decrypt the sslPEMKeyFile, if necessary

      --sslCRLFile=<filename>                               the .pem file containing the certificate revocation list

      --sslAllowInvalidCertificates                         bypass the validation for server certificates

      --sslAllowInvalidHostnames                            bypass the validation for server name

      --sslFIPSMode                                         use FIPS mode of the installed openssl library


authentication options:

  -u, --username=<username>                                 username for authentication

  -p, --password=<password>                                 password for authentication

      --authenticationDatabase=<database-name>              database that holds the user's credentials

      --authenticationMechanism=<mechanism>                 authentication mechanism to use


namespace options:

  -d, --db=<database-name>                                  database to use

  -c, --collection=<collection-name>                        collection to use


uri options:

      --uri=mongodb-uri                                     mongodb uri connection string


query options:

  -q, --query=                                              query filter, as a JSON string, e.g., '{x:{$gt:1}}'

      --queryFile=                                          path to a file containing a query filter (JSON)

      --readPreference=<string>|<json>                      specify either a preference name or a preference json object

      --forceTableScan                                      force a table scan


output options:

  -o, --out=<directory-path>                                output directory, or '-' for stdout (defaults to 'dump')

      --gzip                                                compress archive our collection output with Gzip

      --repair                                              try to recover documents from damaged data files (not supported by all storage engines)

      --oplog                                               use oplog for taking a point-in-time snapshot

      --archive=<file-path>                                 dump as an archive to the specified path. If flag is specified without a value, archive is written to stdout

      --dumpDbUsersAndRoles                                 dump user and role definitions for the specified database

      --excludeCollection=<collection-name>                 collection to exclude from the dump (may be specified multiple times to exclude additional collections)

      --excludeCollectionsWithPrefix=<collection-prefix>    exclude all collections from the dump that have the given prefix (may be specified multiple times to exclude additional prefixes)

  -j, --numParallelCollections=                             number of collections to dump in parallel (4 by default) (default: 4)

      --viewsAsCollections                                  dump views as normal collections with their produced data, omitting standard collections
There are many options in mongorestore command, mandatory option is related to connection options such as host, port, and authentication. There are other parameters, like -j used to restore collections in parallel, -c or --collection is used for a specific collection, and -d or --db is used to define a specific database. The list of options of the mongorestore parameter can be shown using help :
root@n2:~# mongorestore --help

Usage:

  mongorestore <options> <directory or file to restore>


Restore backups generated with mongodump to a running server.


Specify a database with -d to restore a single database from the target directory,

or use -d and -c to restore a single collection from a single .bson file.


See http://docs.mongodb.org/manual/reference/program/mongorestore/ for more information.


general options:

      --help                                                print usage

      --version                                             print the tool version and exit


verbosity options:

  -v, --verbose=<level>                                     more detailed log output (include multiple times for more verbosity, e.g. -vvvvv, or specify a numeric value, e.g. --verbose=N)

      --quiet                                               hide all log output


connection options:

  -h, --host=<hostname>                                     mongodb host to connect to (setname/host1,host2 for replica sets)

      --port=<port>                                         server port (can also use --host hostname:port)


kerberos options:

      --gssapiServiceName=<service-name>                    service name to use when authenticating using GSSAPI/Kerberos ('mongodb' by default)

      --gssapiHostName=<host-name>                          hostname to use when authenticating using GSSAPI/Kerberos (remote server's address by default)


ssl options:

      --ssl                                                 connect to a mongod or mongos that has ssl enabled

      --sslCAFile=<filename>                                the .pem file containing the root certificate chain from the certificate authority

      --sslPEMKeyFile=<filename>                            the .pem file containing the certificate and key

      --sslPEMKeyPassword=<password>                        the password to decrypt the sslPEMKeyFile, if necessary

      --sslCRLFile=<filename>                               the .pem file containing the certificate revocation list

      --sslAllowInvalidCertificates                         bypass the validation for server certificates

      --sslAllowInvalidHostnames                            bypass the validation for server name

      --sslFIPSMode                                         use FIPS mode of the installed openssl library


authentication options:

  -u, --username=<username>                                 username for authentication

  -p, --password=<password>                                 password for authentication

      --authenticationDatabase=<database-name>              database that holds the user's credentials

      --authenticationMechanism=<mechanism>                 authentication mechanism to use


uri options:

      --uri=mongodb-uri                                     mongodb uri connection string


namespace options:

  -d, --db=<database-name>                                  database to use when restoring from a BSON file

  -c, --collection=<collection-name>                        collection to use when restoring from a BSON file

      --excludeCollection=<collection-name>                 DEPRECATED; collection to skip over during restore (may be specified multiple times to exclude additional collections)

      --excludeCollectionsWithPrefix=<collection-prefix>    DEPRECATED; collections to skip over during restore that have the given prefix (may be specified multiple times to exclude additional prefixes)

      --nsExclude=<namespace-pattern>                       exclude matching namespaces

      --nsInclude=<namespace-pattern>                       include matching namespaces

      --nsFrom=<namespace-pattern>                          rename matching namespaces, must have matching nsTo

      --nsTo=<namespace-pattern>                            rename matched namespaces, must have matching nsFrom


input options:

      --objcheck                                            validate all objects before inserting

      --oplogReplay                                         replay oplog for point-in-time restore

      --oplogLimit=<seconds>[:ordinal]                      only include oplog entries before the provided Timestamp

      --oplogFile=<filename>                                oplog file to use for replay of oplog

      --archive=<filename>                                  restore dump from the specified archive file. If flag is specified without a value, archive is read from stdin

      --restoreDbUsersAndRoles                              restore user and role definitions for the given database

      --dir=<directory-name>                                input directory, use '-' for stdin

      --gzip                                                decompress gzipped input


restore options:

      --drop                                                drop each collection before import

      --dryRun                                              view summary without importing anything. recommended with verbosity

      --writeConcern=<write-concern>                        write concern options e.g. --writeConcern majority, --writeConcern '{w: 3, wtimeout: 500, fsync: true, j: true}'

      --noIndexRestore                                      don't restore indexes

      --noOptionsRestore                                    don't restore collection options

      --keepIndexVersion                                    don't update index version

      --maintainInsertionOrder                              preserve order of documents during restoration

  -j, --numParallelCollections=                             number of collections to restore in parallel (4 by default) (default: 4)

      --numInsertionWorkersPerCollection=                   number of insert operations to run concurrently per collection (1 by default) (default: 1)

      --stopOnError                                         stop restoring if an error is encountered on insert (off by default)

      --bypassDocumentValidation                            bypass document validation

      --preserveUUID                                        preserve original collection UUIDs (off by default, requires drop)
Restoring specific collections in MongoDB can be done using the parameter collection in mongorestore. Assume you have an orders database, inside the orders database there are some collections as shown below:
my_mongodb_0:PRIMARY> show dbs;

admin   0.000GB

config  0.000GB

local   0.000GB

orders  0.000GB

my_mongodb_0:PRIMARY> use orders;

my_mongodb_0:PRIMARY> show collections;

order_details

orders

stock
We already have scheduled a backup for the orders database, and we want to restore the stock collection into a new database order_new in the same server. If you want to use option --collection, you need to pass the collection name as parameter of mongorestore or you can use the option --nsInclude={db}.{collection} if you didn’t specify the path to the collection file.
root@n2:~/dump/orders# mongorestore -umongoadmin --authenticationDatabase admin --db order_new --collection stock /root/dump/orders/stock.bson
Enter password:
2020-03-09T04:06:29.100+0000 checking for collection data in /root/dump/orders/stock.bson
2020-03-09T04:06:29.110+0000 reading metadata for order_new.stock from /root/dump/orders/stock.metadata.json
2020-03-09T04:06:29.134+0000 restoring order_new.stock from /root/dump/orders/stock.bson
2020-03-09T04:06:29.202+0000 no indexes to restore
2020-03-09T04:06:29.203+0000 finished restoring order_new.stock (1 document)
2020-03-09T04:06:29.203+0000 doneYou can check the collection in order_new database as shown below :
my_mongodb_0:PRIMARY> use order_new;
switched to db order_new
my_mongodb_0:PRIMARY> show collections;
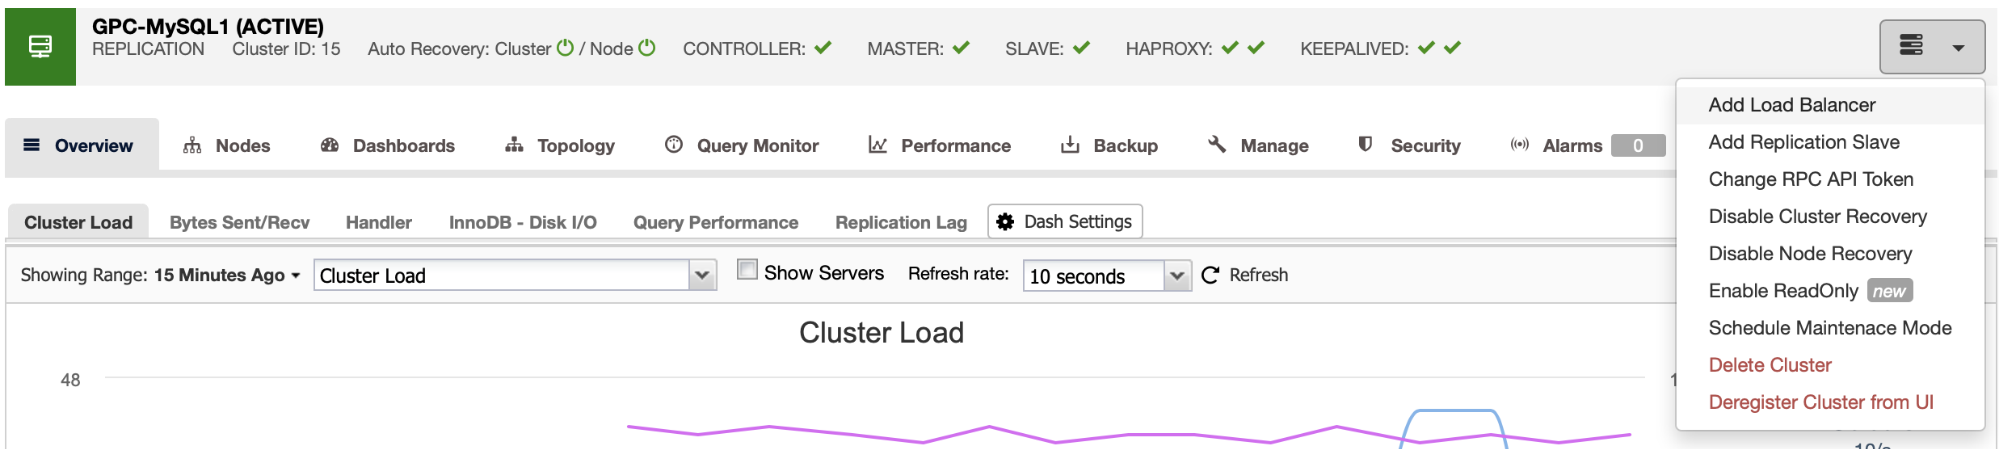
stockHow We Can Restore Using mongodump in ClusterControl
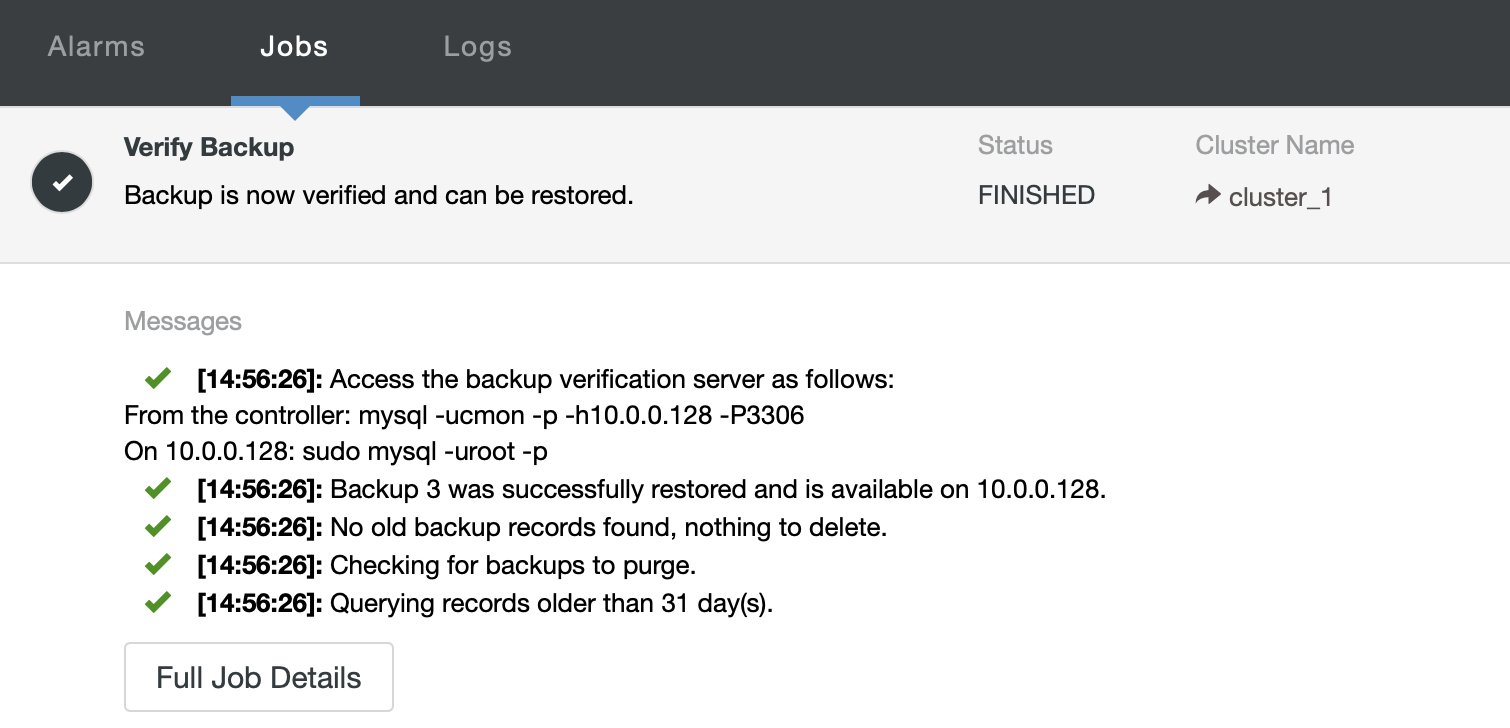
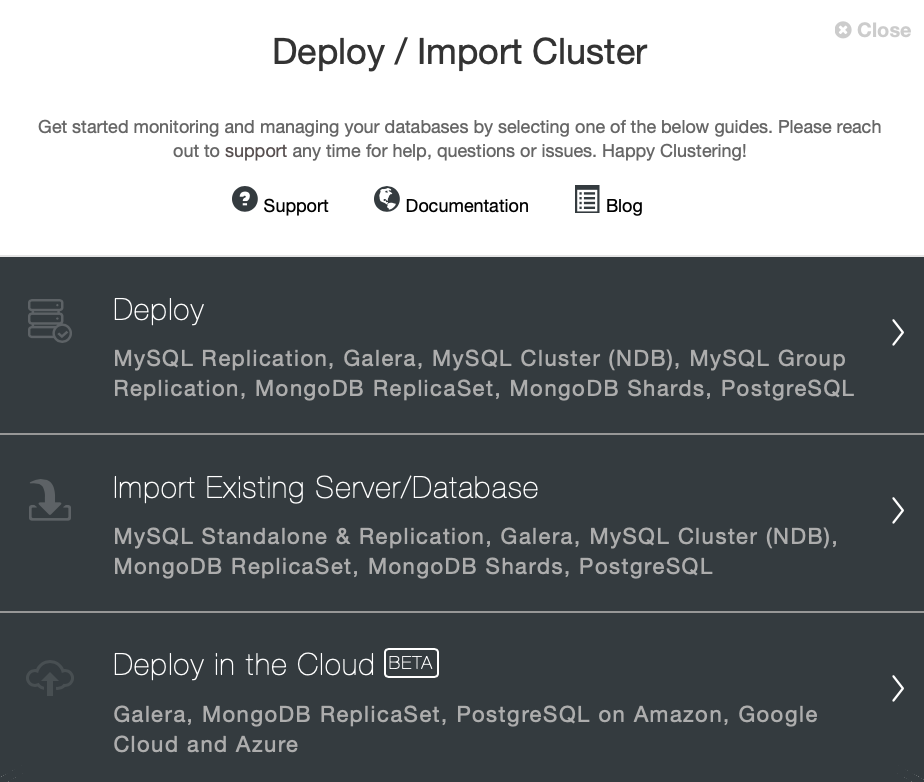
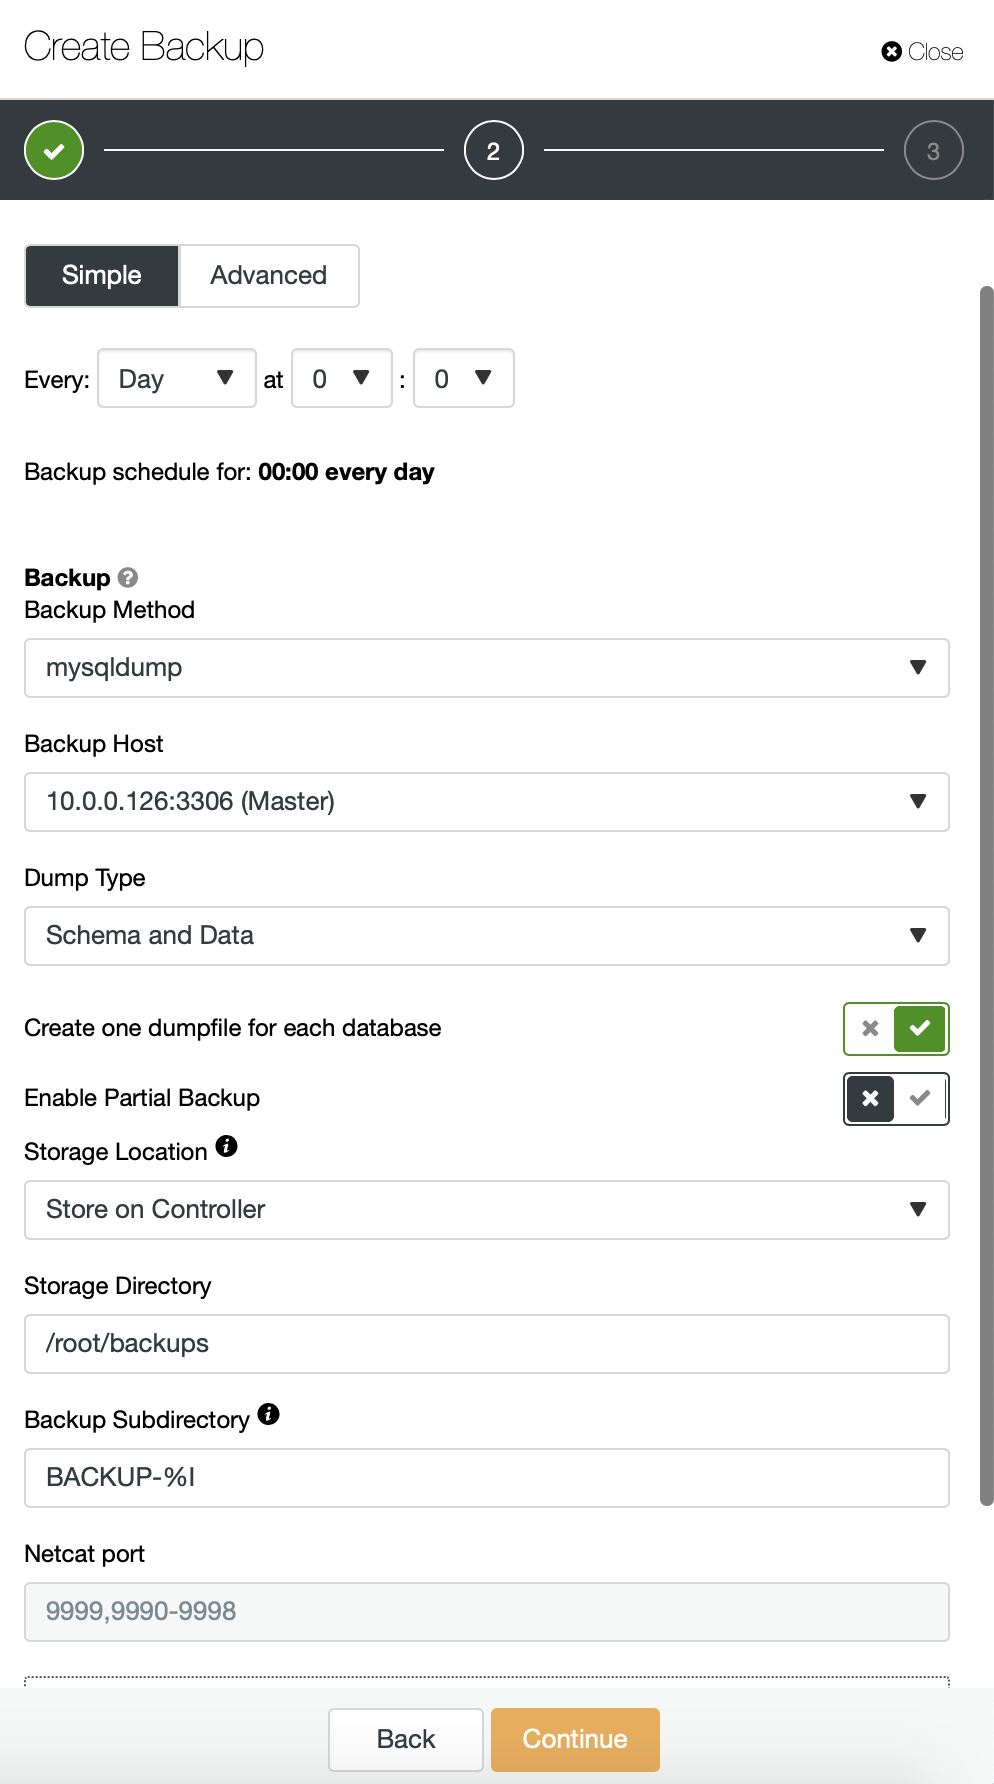
Restoring a backup dump through ClusterControl is easy, you just need 2 steps to restore the backup. There will be lots of backup files in the list if you enabled your backup schedule, there is some information about the backups that can be very useful. For example, status of backup which indicates if the backup was completed / failed, method of backup had taken, list of databases, and size of dump. The steps to restore MongoDB data via ClusterControl are as below :
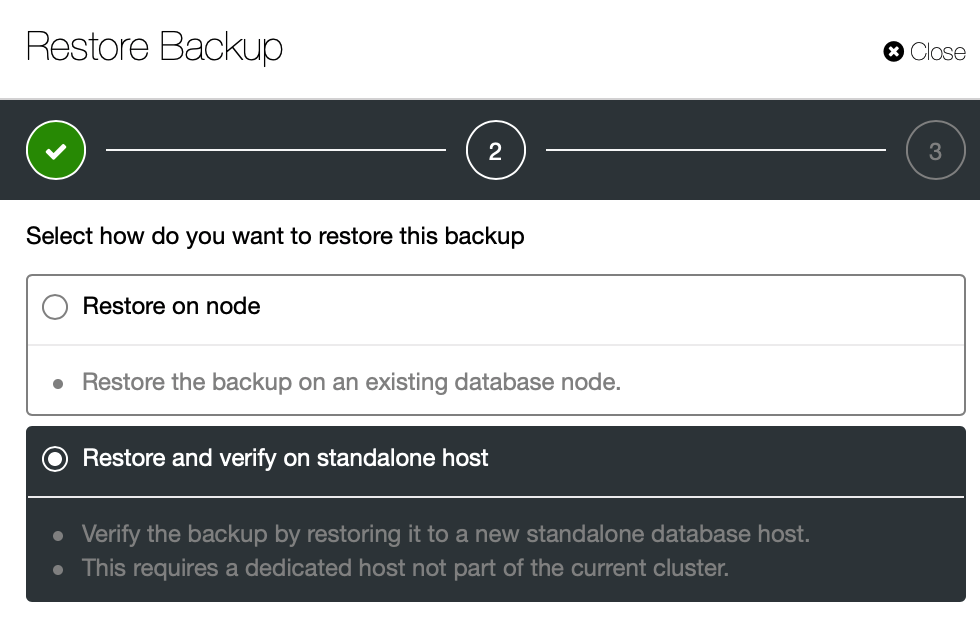
Step One
Follow the prompts to restore backup to a node as shown below...

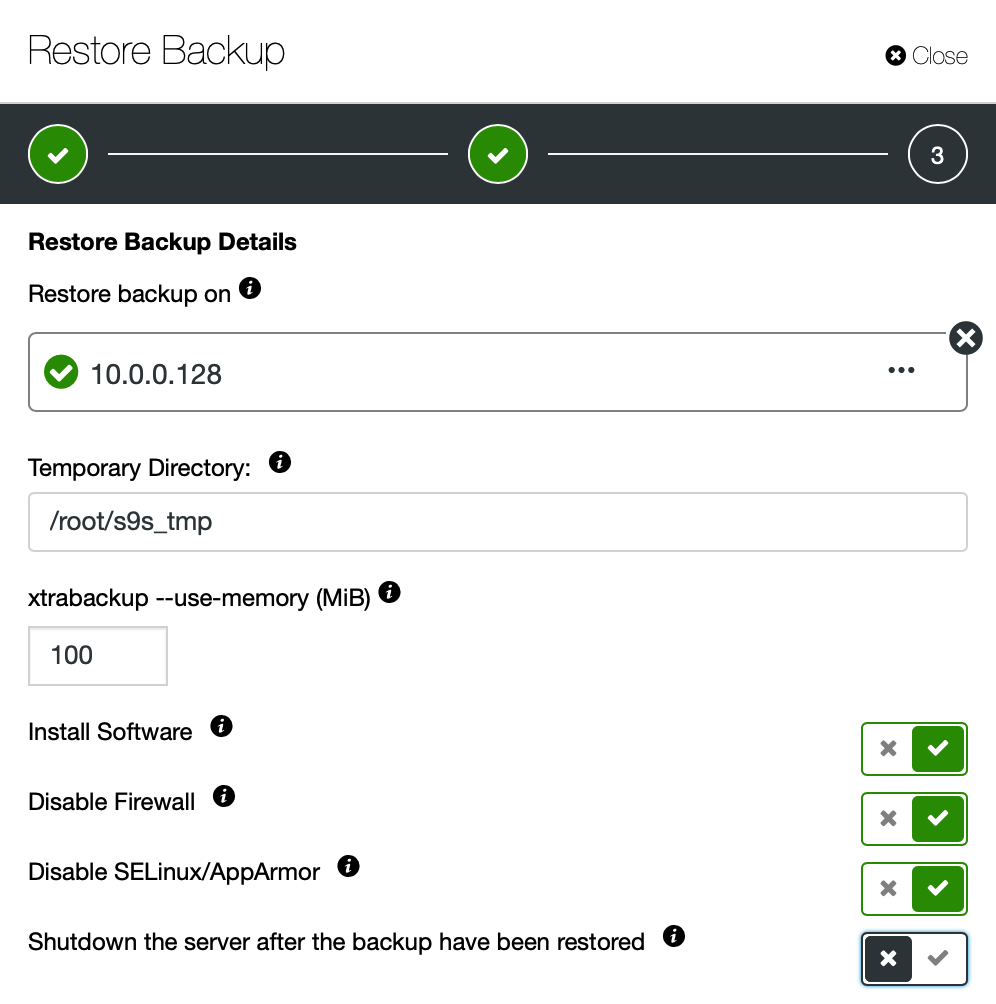
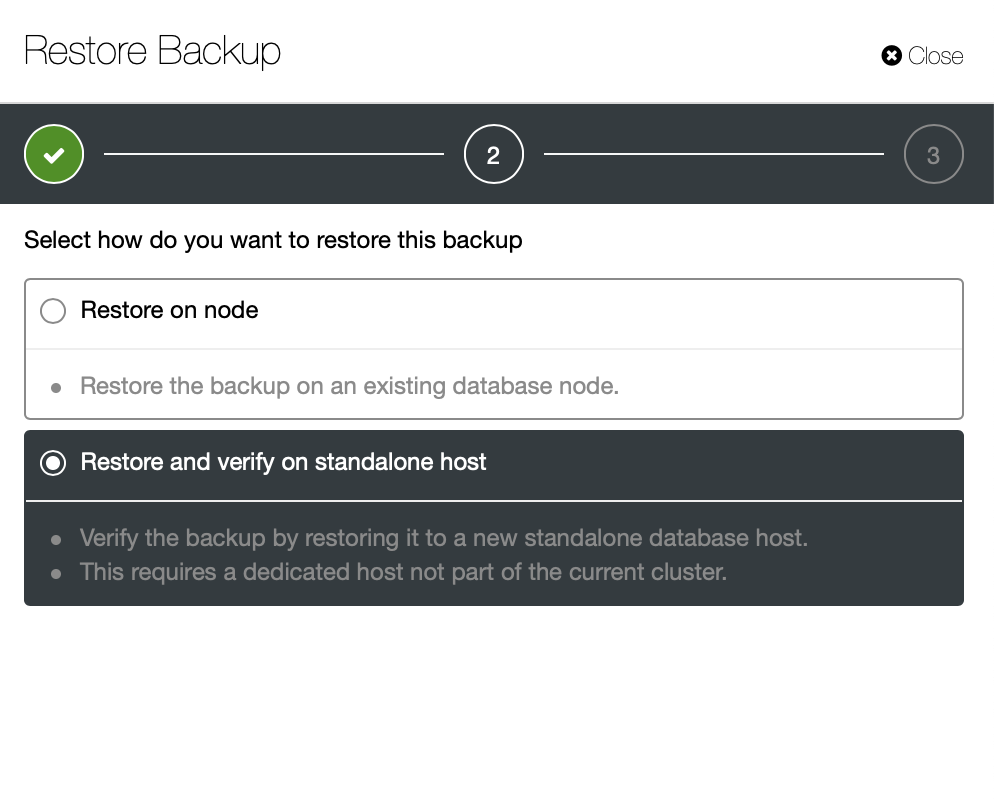
Step Two
You need to choose which backup that needs to be restored.

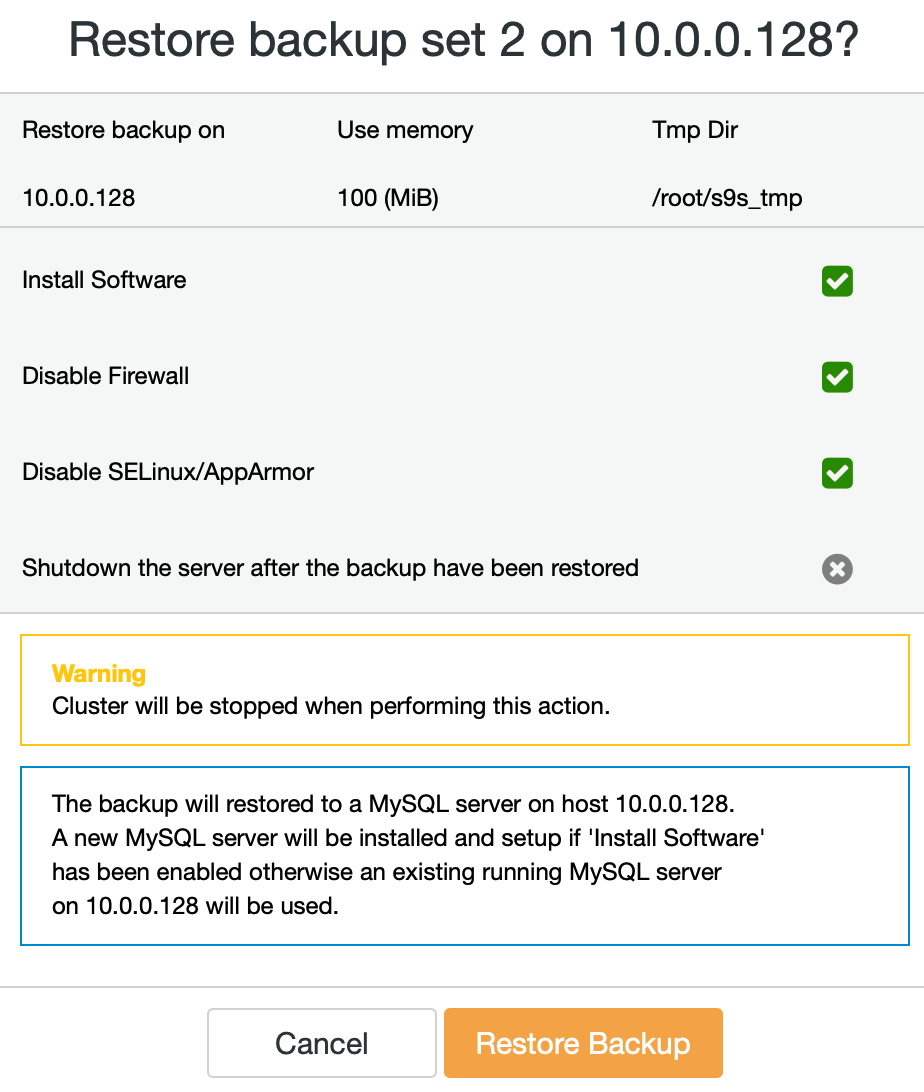
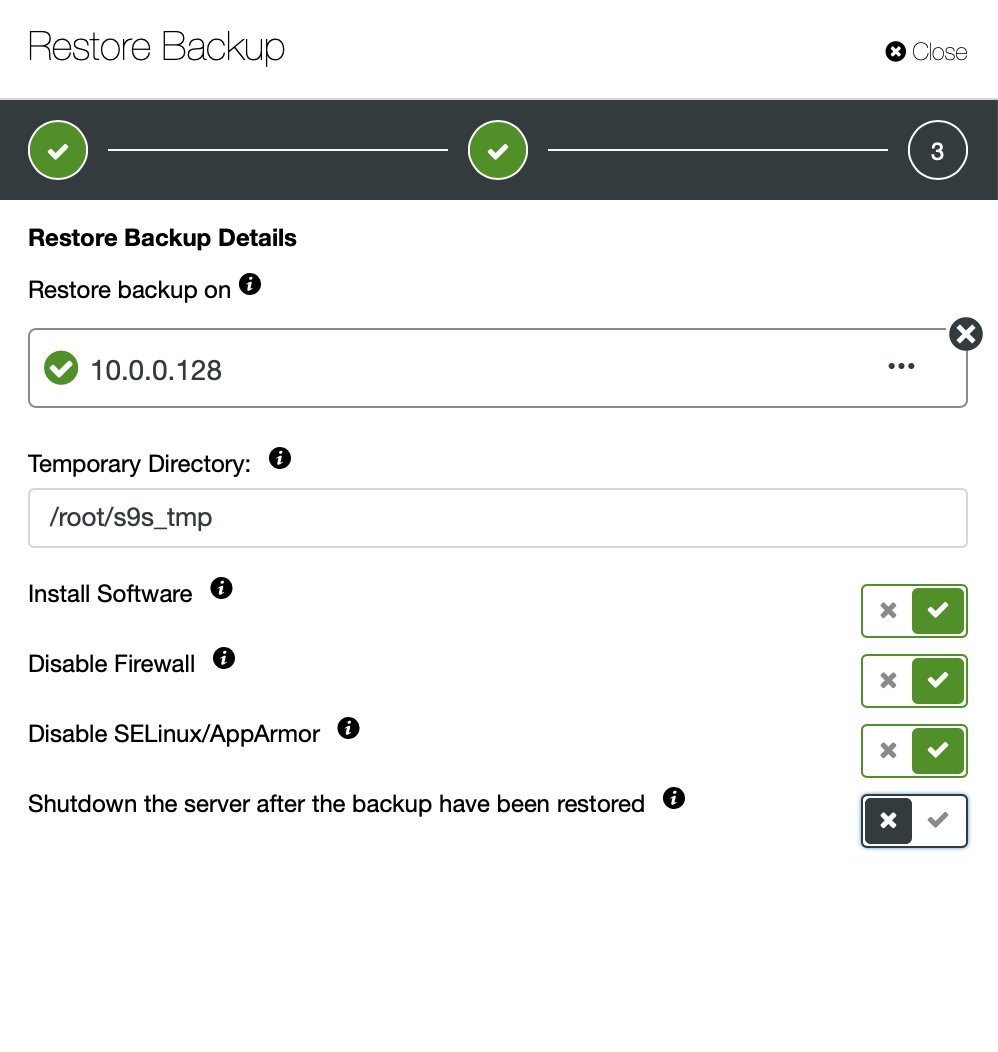
Step Three
Review the summary...