Quantcast
Channel: Severalnines
Viewing all 1259 articles
Browse latest View live

My DBA is Sick - Database Failover Tips for SysAdmins

$
0
0

The best scenario is that, in case of a database failure, you have a good Disaster Recovery Plan (DRP) and a highly available environment with an automatic failover process, but… what happens if it fails for some unexpected reason? What if you need to perform a manual failover? In this blog, we’ll share some recommendations to follow in case you need to failover your database.

Verification Checks

Before performing any change, you need to verify some basic things to avoid new issues after the failover process.

Replication Status

It could be possible that, at the failure time, the slave node is not up-to-date, due to a network failure, high load, or another issue, so you need to make sure your slave has all (or almost all) the information. If you have more than one slave node, you should also check which one is the most advanced node and choose it to failover.

e.g: Let’s check the replication status in a MariaDB Server.

MariaDB [(none)]> SHOW SLAVE STATUS\G

*************************** 1. row ***************************

Slave_IO_State: Waiting for master to send event

Master_Host: 192.168.100.110

Master_User: rpl_user

Master_Port: 3306

Connect_Retry: 10

Master_Log_File: binlog.000014

Read_Master_Log_Pos: 339

Relay_Log_File: relay-bin.000002

Relay_Log_Pos: 635

Relay_Master_Log_File: binlog.000014

Slave_IO_Running: Yes

Slave_SQL_Running: Yes

Last_Errno: 0

Skip_Counter: 0

Exec_Master_Log_Pos: 339

Relay_Log_Space: 938

Until_Condition: None

Until_Log_Pos: 0

Master_SSL_Allowed: No

Seconds_Behind_Master: 0

Master_SSL_Verify_Server_Cert: No

Last_IO_Errno: 0

Last_SQL_Errno: 0

Replicate_Ignore_Server_Ids:

Master_Server_Id: 3001

Using_Gtid: Slave_Pos

Gtid_IO_Pos: 0-3001-20

Parallel_Mode: conservative

SQL_Delay: 0

SQL_Remaining_Delay: NULL

Slave_SQL_Running_State: Slave has read all relay log; waiting for the slave I/O thread to update it

Slave_DDL_Groups: 0

Slave_Non_Transactional_Groups: 0

Slave_Transactional_Groups: 0

1 row in set (0.000 sec)

In case of PostgreSQL, it’s a bit different as you need to check the WALs status and compare the applied to the fetched ones.

postgres=# SELECT CASE WHEN pg_last_wal_receive_lsn()=pg_last_wal_replay_lsn()

postgres-# THEN 0

postgres-# ELSE EXTRACT (EPOCH FROM now() - pg_last_xact_replay_timestamp())

postgres-# END AS log_delay;

 log_delay

-----------

         0

(1 row)

Credentials

Before running the failover, you must check if your application/users will be able to access your new master with the current credentials. If you are not replicating your database users, maybe the credentials were changed, so you will need to update them in the slave nodes before any changes.

e.g: You can query the user table in the mysql database to check the user credentials in a MariaDB/MySQL Server:

MariaDB [(none)]> SELECT Host,User,Password FROM mysql.user;

+-----------------+--------------+-------------------------------------------+

| Host            | User | Password                                  |

+-----------------+--------------+-------------------------------------------+

| localhost       | root | *CD7EC70C2F7DCE88643C97381CB42633118AF8A8 |

| localhost       | mysql | invalid                                   |

| 127.0.0.1       | backupuser | *AC01ED53FA8443BFD3FC7C448F78A6F2C26C3C38 |

| 192.168.100.100 | cmon         | *F80B5EE41D1FB1FA67D83E96FCB1638ABCFB86E2 |

| 127.0.0.1       | root | *CD7EC70C2F7DCE88643C97381CB42633118AF8A8 |

| ::1             | root | *CD7EC70C2F7DCE88643C97381CB42633118AF8A8 |

| localhost       | backupuser | *AC01ED53FA8443BFD3FC7C448F78A6F2C26C3C38 |

| 192.168.100.112 | user1        | *CD7EC70C2F7DCE88643C97381CB42633118AF8A8 |

| localhost       | cmonexporter | *0F7AD3EAF21E28201D311384753810C5066B0964 |

| 127.0.0.1       | cmonexporter | *0F7AD3EAF21E28201D311384753810C5066B0964 |

| ::1             | cmonexporter | *0F7AD3EAF21E28201D311384753810C5066B0964 |

| 192.168.100.110 | rpl_user     | *EEA7B018B16E0201270B3CDC0AF8FC335048DC63 |

+-----------------+--------------+-------------------------------------------+

12 rows in set (0.001 sec)

In case of PostgreSQL, you can use the ‘\du’ command to know the roles, and you must also check the pg_hba.conf configuration file to manage the user access (not credentials). So:

postgres=# \du

                                       List of roles

    Role name     |             Attributes         | Member of

------------------+------------------------------------------------------------+-----------

 admindb          | Superuser, Create role, Create DB                          | {}

 cmon_replication | Replication                                                | {}

 cmonexporter     |                                             | {}

 postgres         | Superuser, Create role, Create DB, Replication, Bypass RLS | {}

 s9smysqlchk      | Superuser, Create role, Create DB                          | {}

And pg_hba.conf:

# TYPE DATABASE USER ADDRESS METHOD

host replication  cmon_replication  localhost  md5

host  replication  cmon_replication  127.0.0.1/32  md5

host  all  s9smysqlchk  localhost  md5

host  all  s9smysqlchk  127.0.0.1/32  md5

local   all            all                   trust

host    all            all 127.0.0.1/32 trust

Network/Firewall Access

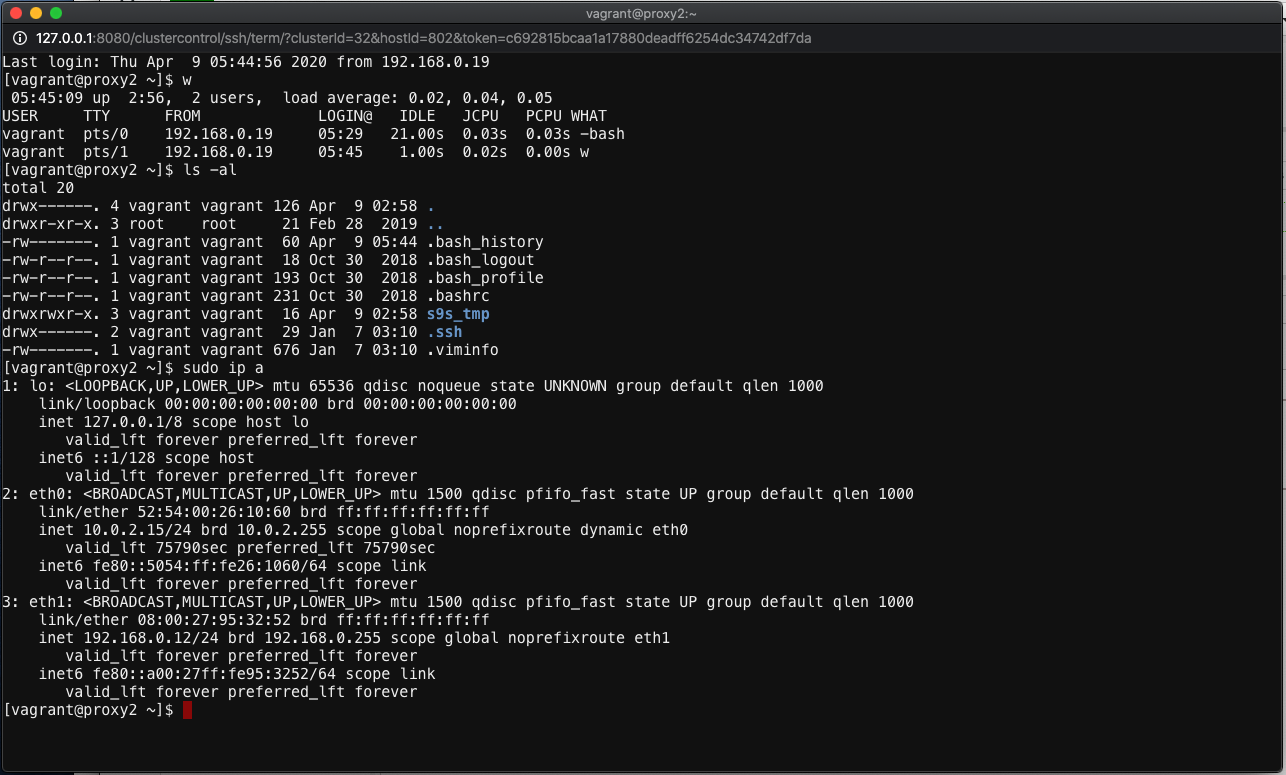
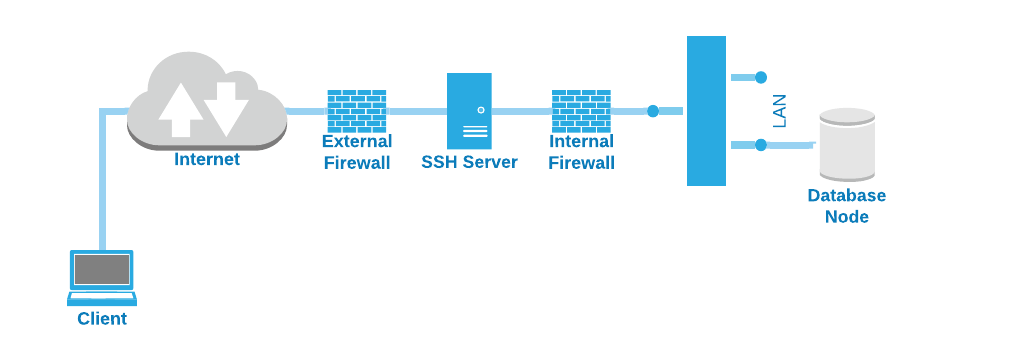
The credentials are not the only possible issue accessing your new master. If the node is in another datacenter, or you have a local firewall to filter traffic, you must check if you are allowed to access it or even if you have the network route to reach the new master node.

e.g: iptables. Let’s allow the traffic from the network 167.124.57.0/24 and check the current rules after adding it:

$ iptables -A INPUT  -s 167.124.57.0/24 -m state --state NEW  -j ACCEPT

$ iptables -L -n

Chain INPUT (policy ACCEPT)

target     prot opt source               destination

ACCEPT     all -- 167.124.57.0/24      0.0.0.0/0 state NEW

Chain FORWARD (policy ACCEPT)

target     prot opt source               destination

Chain OUTPUT (policy ACCEPT)

target     prot opt source               destination

e.g: routes. Let’s suppose your new master node is in the network 10.0.0.0/24, your application server is in 192.168.100.0/24, and you can reach the remote network using 192.168.100.100, so in your application server, add the corresponding route:

$ route add -net 10.0.0.0/24 gw 192.168.100.100

$ route -n

Kernel IP routing table

Destination     Gateway Genmask         Flags Metric Ref Use Iface

0.0.0.0         192.168.100.1 0.0.0.0         UG 0 0 0 eth0

10.0.0.0        192.168.100.100 255.255.255.0   UG 0 0 0 eth0

169.254.0.0     0.0.0.0 255.255.0.0     U 1027 0 0 eth0

192.168.100.0   0.0.0.0 255.255.255.0   U 0 0 0 eth0

Action Points

After checking all the mentioned points, you should be ready to make the actions to failover your database.

New IP Address

As you will promote a slave node, the master IP address will change, so you will need to change it in your application or client access.

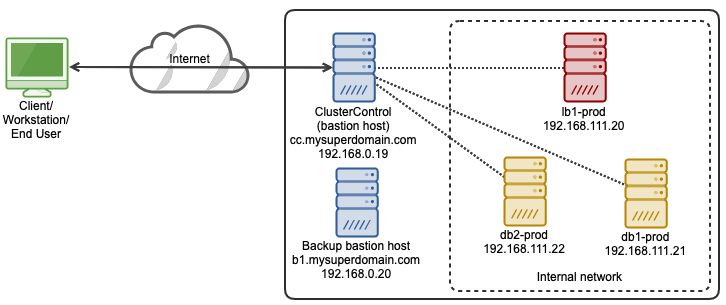
Using a Load Balancer is an excellent way to avoid this issue/change. After the failover process, the Load Balancer will detect the old master as offline and (depends on the configuration) send the traffic to the new one to write on it, so you don’t need to change anything in your application.

e.g: Let’s see an example for an HAProxy configuration:

listen  haproxy_5433

        bind *:5433

        mode tcp

        timeout client  10800s

        timeout server  10800s

        balance leastconn

        option tcp-check

        server 192.168.100.119 192.168.100.119:5432 check

        server 192.168.100.120 192.168.100.120:5432 check

In this case, if one node is down, HAProxy won’t send traffic there and send the traffic only to the available node.

Reconfigure the Slave Nodes

If you have more than one slave node, after promoting one of them, you must reconfigure the rest of the slaves to connect to the new master. This could be a time-consuming task, depending on the number of nodes.

Verify & Configure the Backups

After you have all in place (new master promoted, slaves reconfigured, application writing in the new master), it is important to take the necessary actions to prevent a new issue, so backups are a must in this step. Most probably you had a backup policy running before the incident (if not, you need to have it for sure), so you must check if the backups are still running or they will do in the new topology. It could be possible that you had the backups running on the old master, or using the slave node that is master now, so you need to check it to make sure your backup policy will still work after the changes.

Database Monitoring

When you perform a failover process, monitoring is a must before, during, and after the process. With this, you can prevent an issue before it gets worse, detect an unexpected problem during the failover, or even know if something goes wrong after it. For example, you must monitor if your application can access your new master by checking the number of active connections.

Key Metrics to Monitor

Let’s see some of the most important metrics to take into account:

  • Replication Lag
  • Replication Status
  • Number of connections
  • Network usage/errors
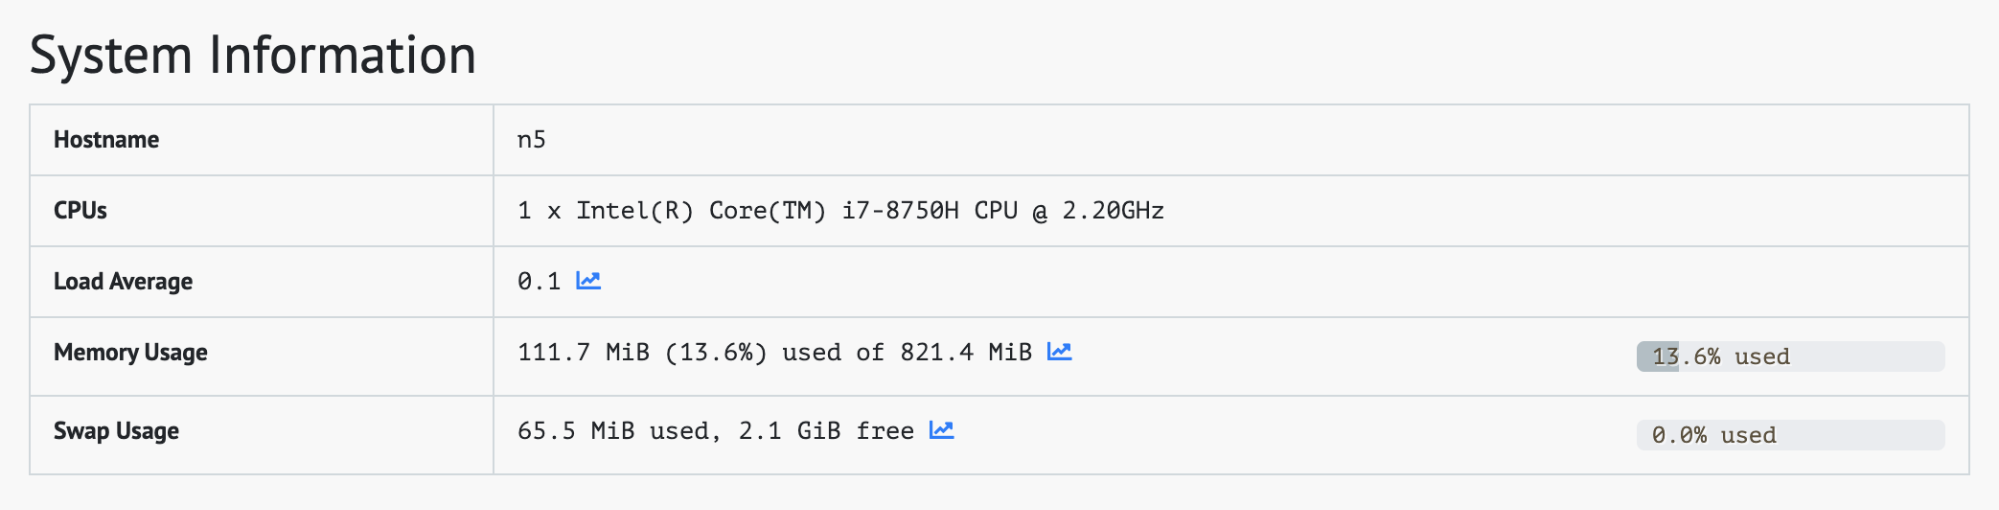
  • Server load (CPU, Memory, Disk)
  • Database and system logs

Rollback

Of course, if something went wrong, you must be able to roll back. Blocking traffic to the old node and keeping it as isolated as possible could be a good strategy for this, so in case you need to rollback, you will have the old node available. If the rollback is after some minutes, depending on the traffic, you will probably need to insert the data of these minutes in the old master, so make sure you have also your temporary master node available and isolated to take this information and apply it back.

Automate Failover Process with ClusterControl

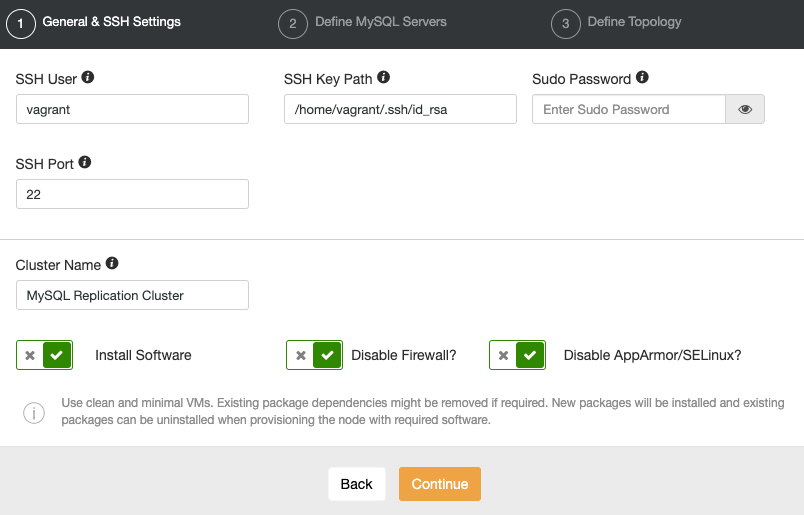
Seeing all these necessary tasks to perform a failover, most probably you want to automate it and avoid all this manual work. For this, you can take advantage of some of the features that ClusterControl can offer you for different database technologies, like auto-recovery, backups, user management, monitoring, among other features, all from the same system.

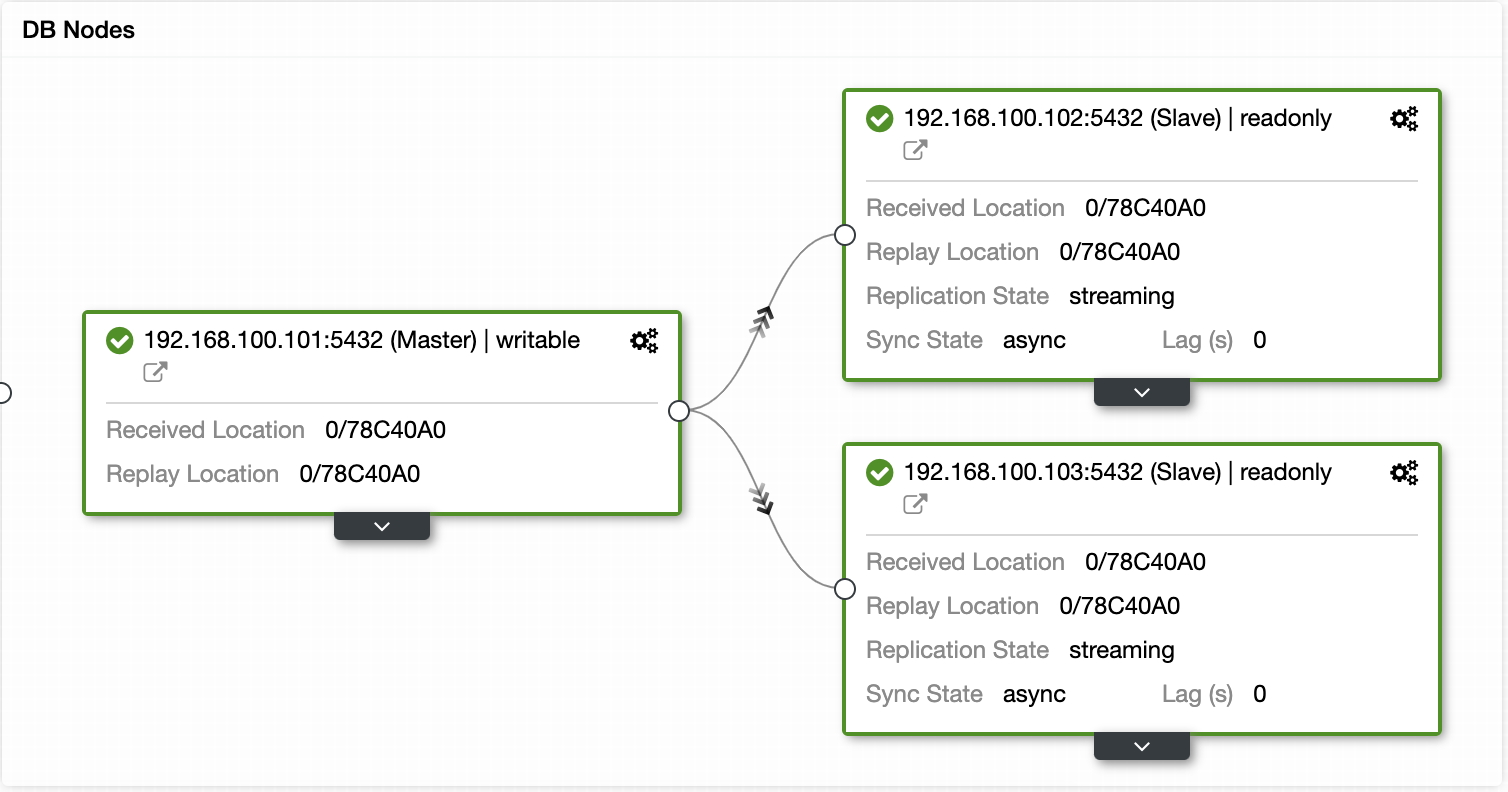
With ClusterControl you can verify the replication status and its lag, create or modify credentials, know the network and host status, and even more verifications.

Using ClusterControl you can also perform different cluster and node actions, like promote slave, restart database and server, add or remove database nodes, add or remove load balancer nodes, rebuild a replication slave, and more.

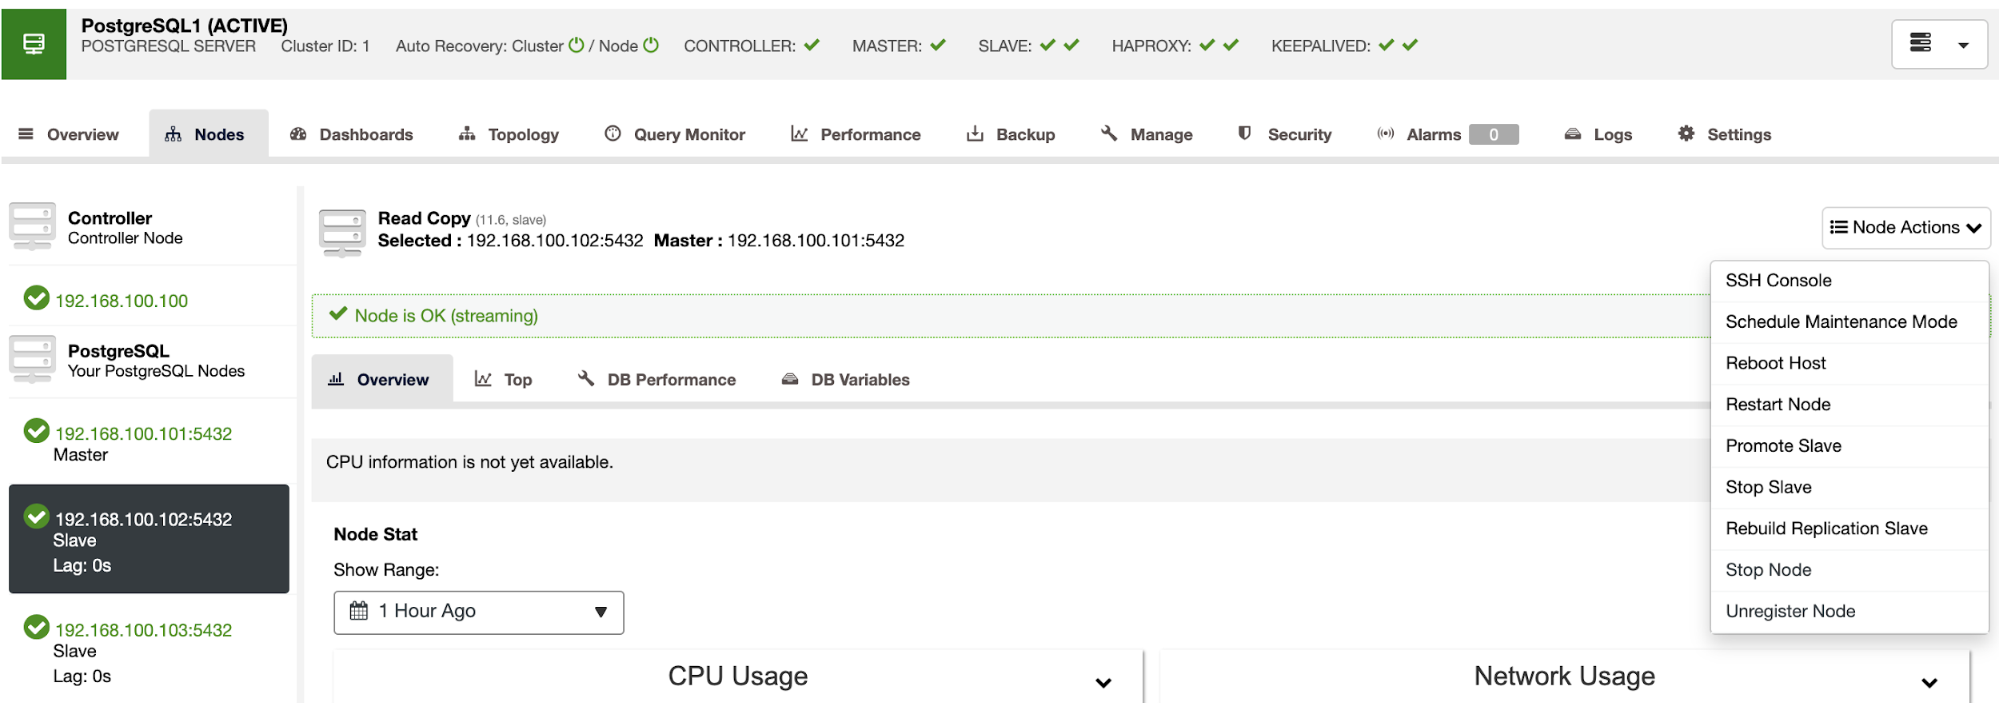
Using these actions you can also rollback your failover if needed by rebuilding and promoting the previous master.

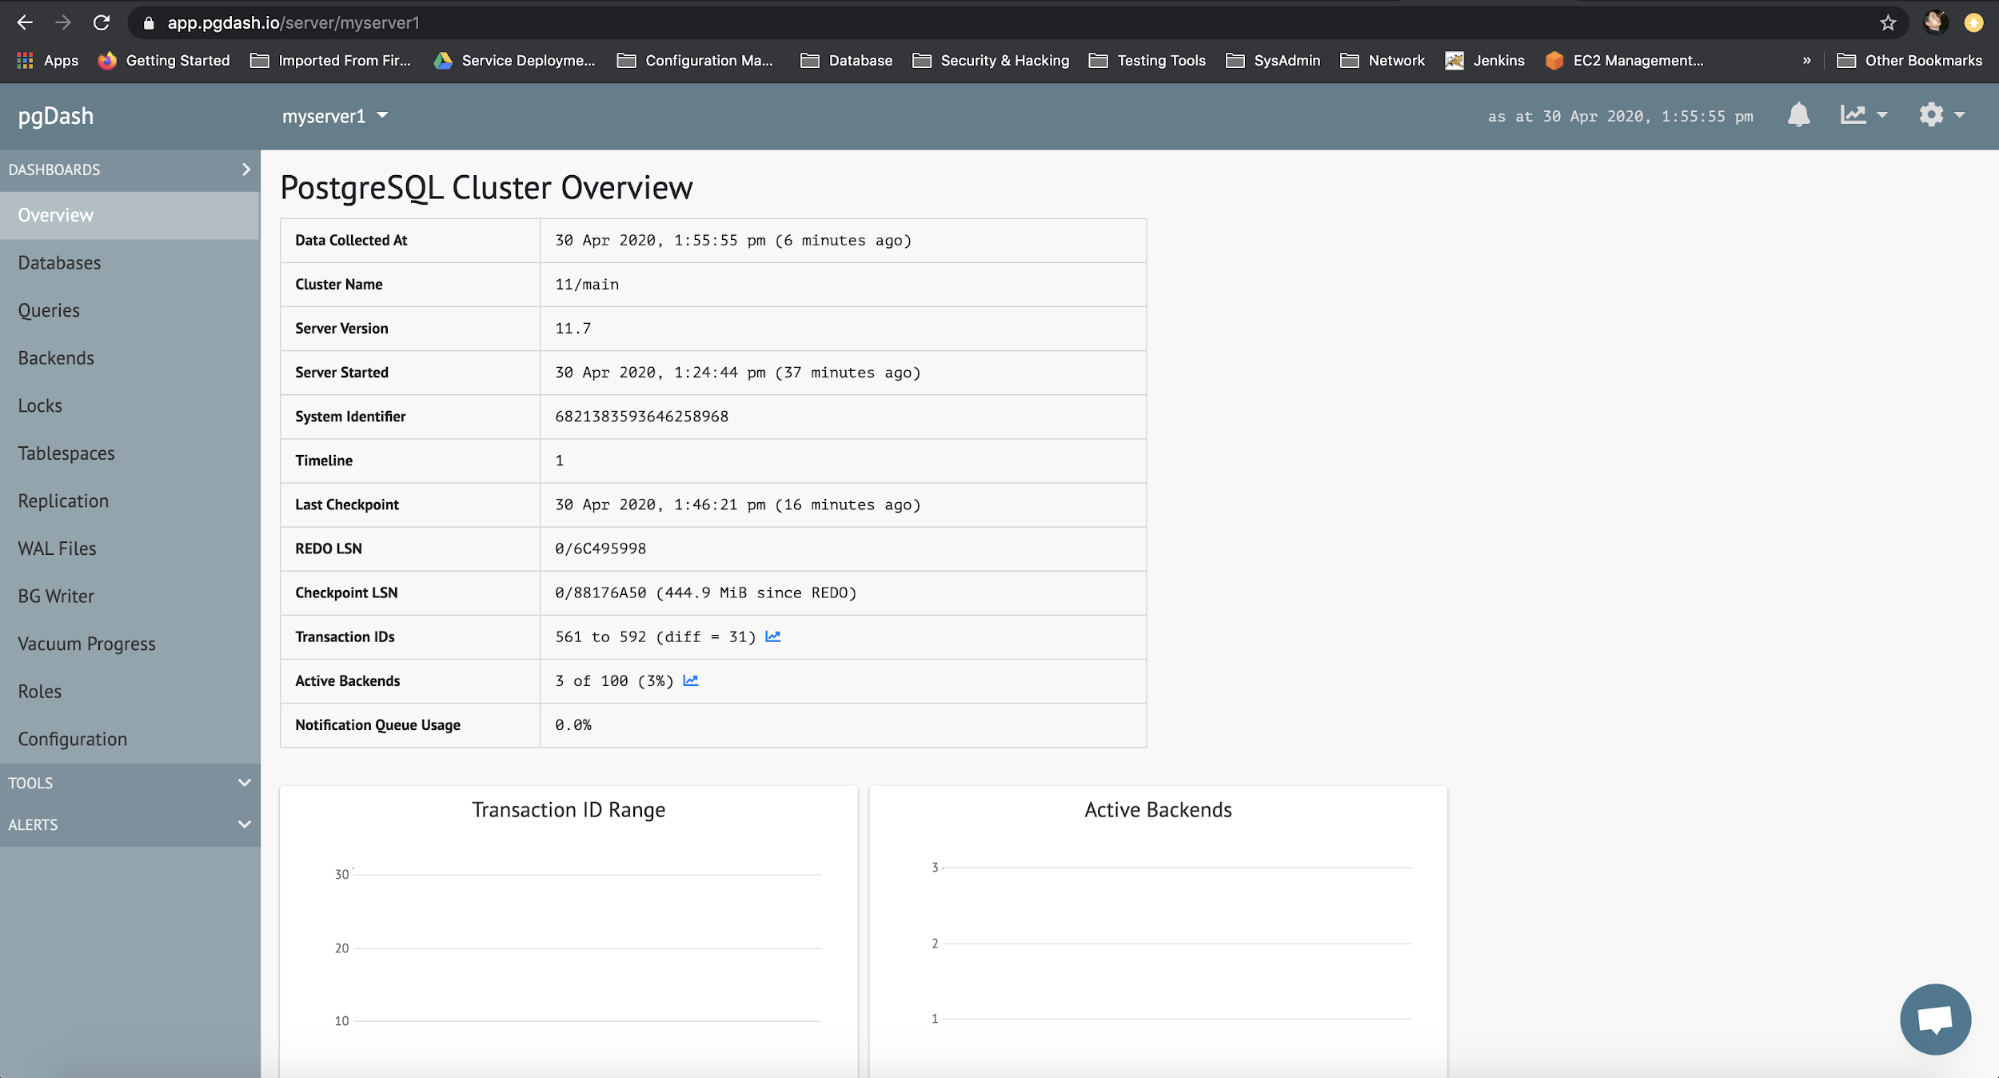
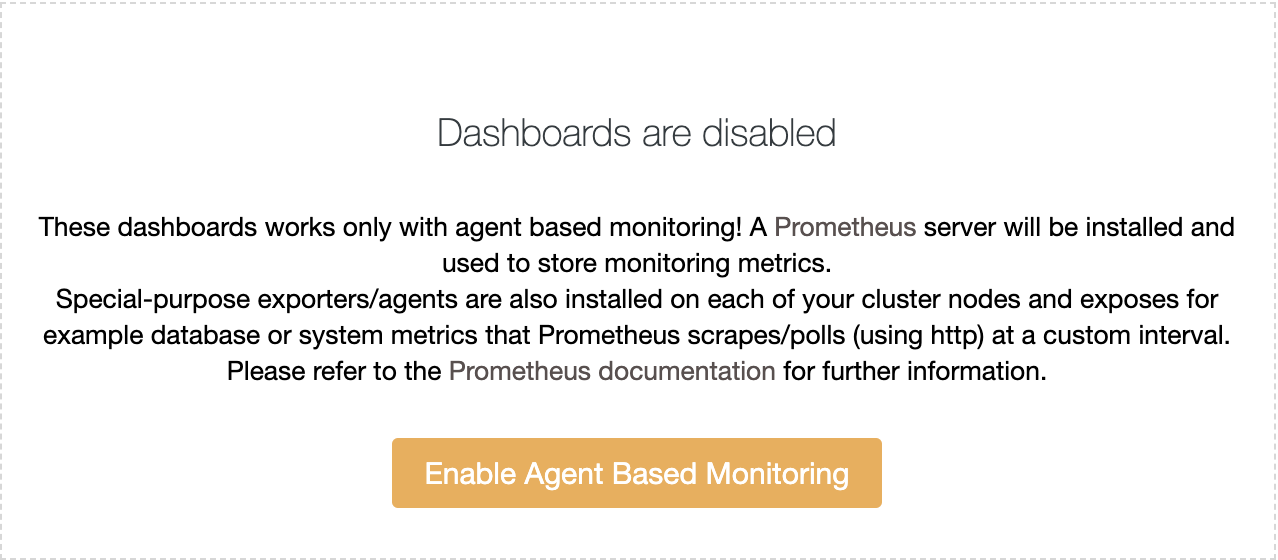
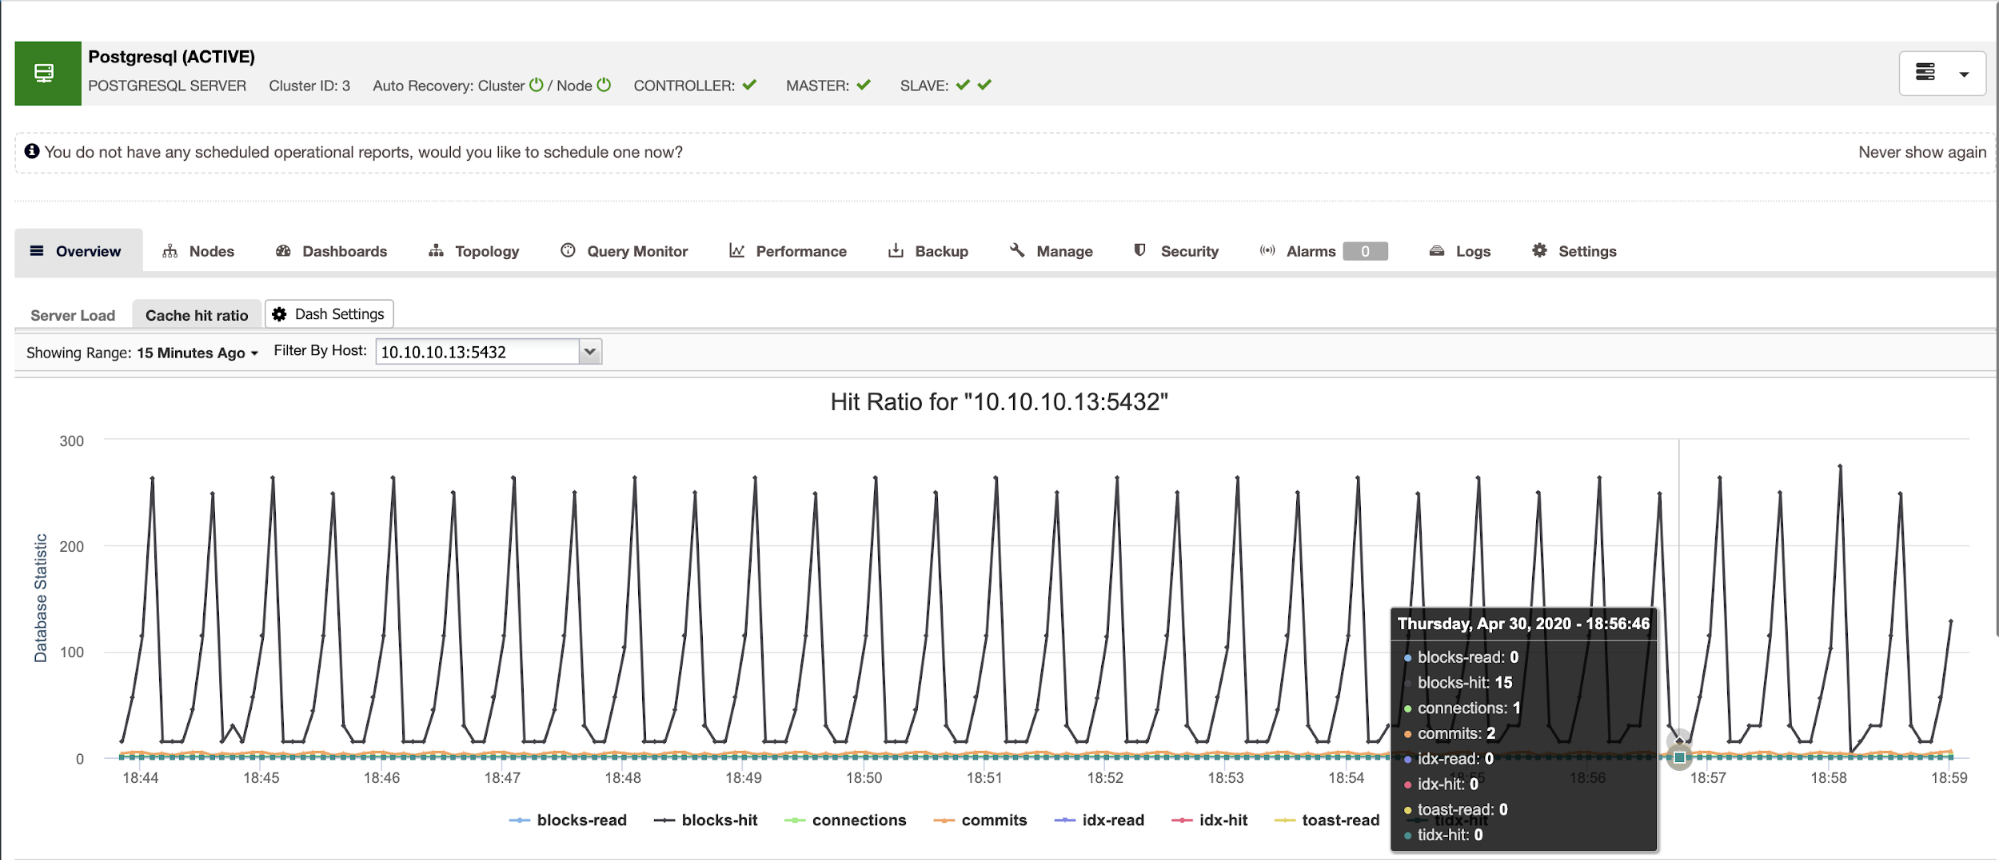
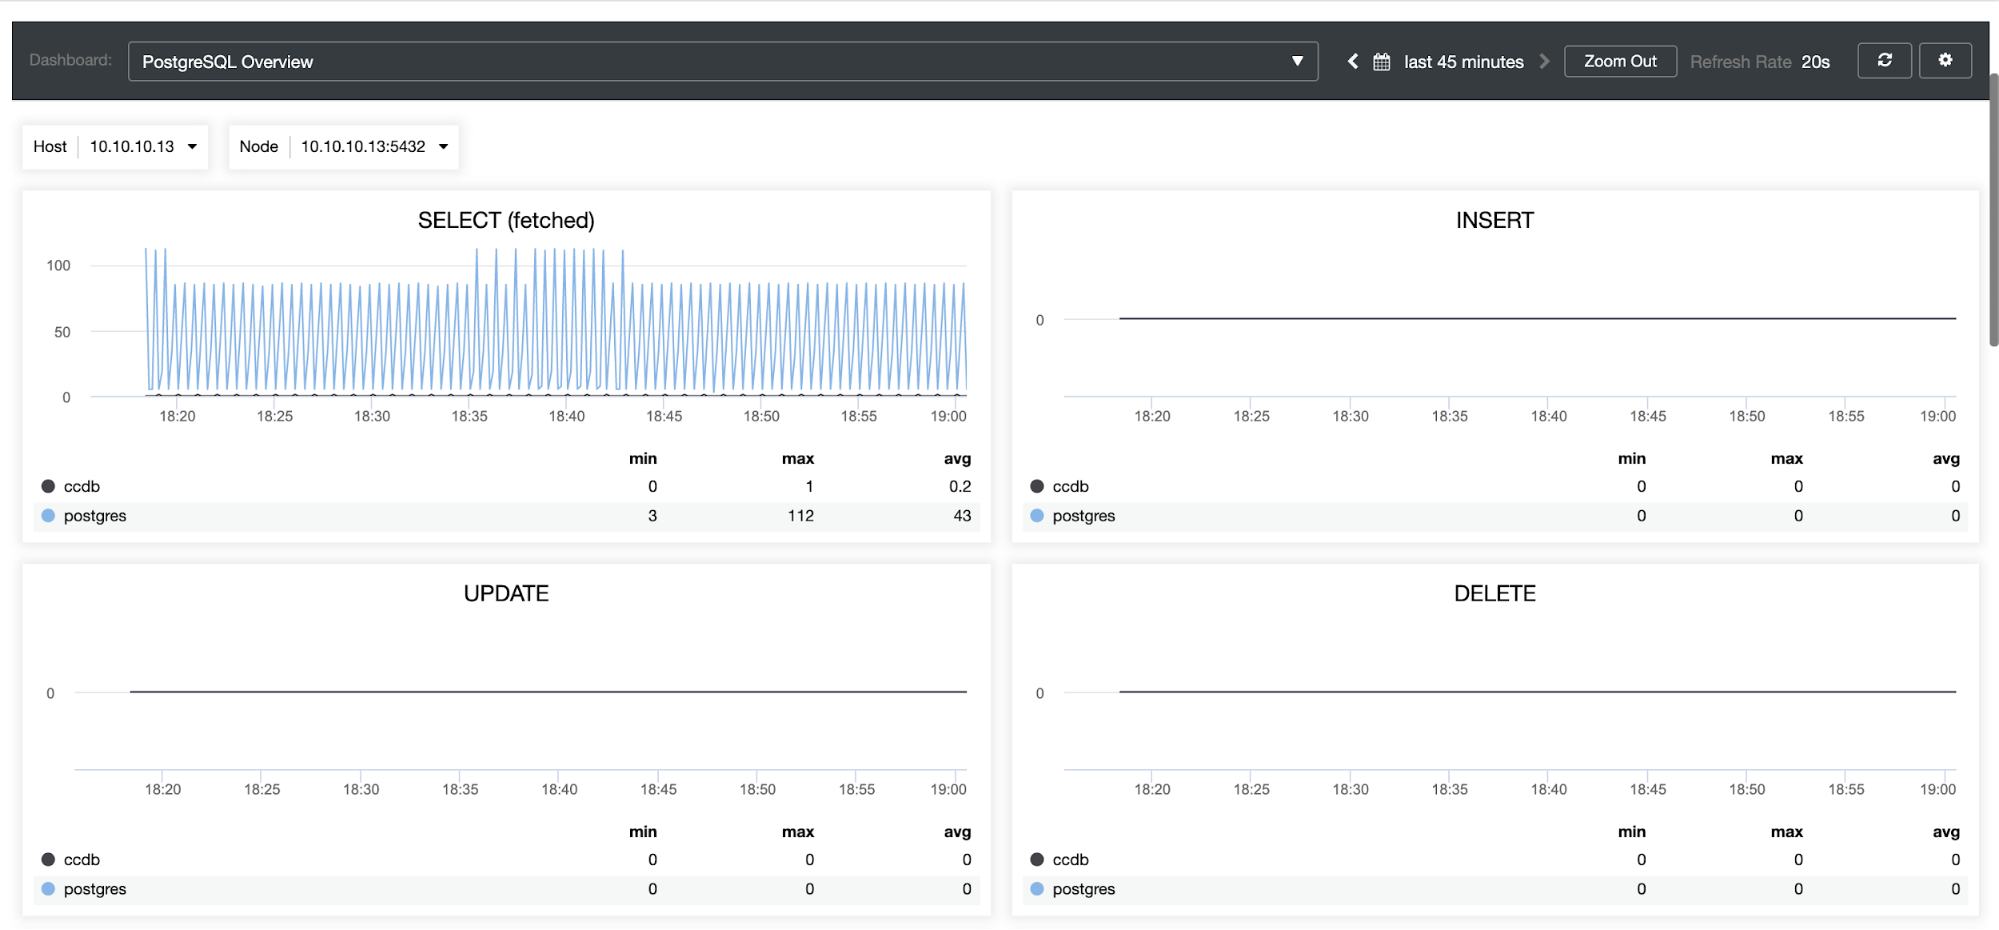
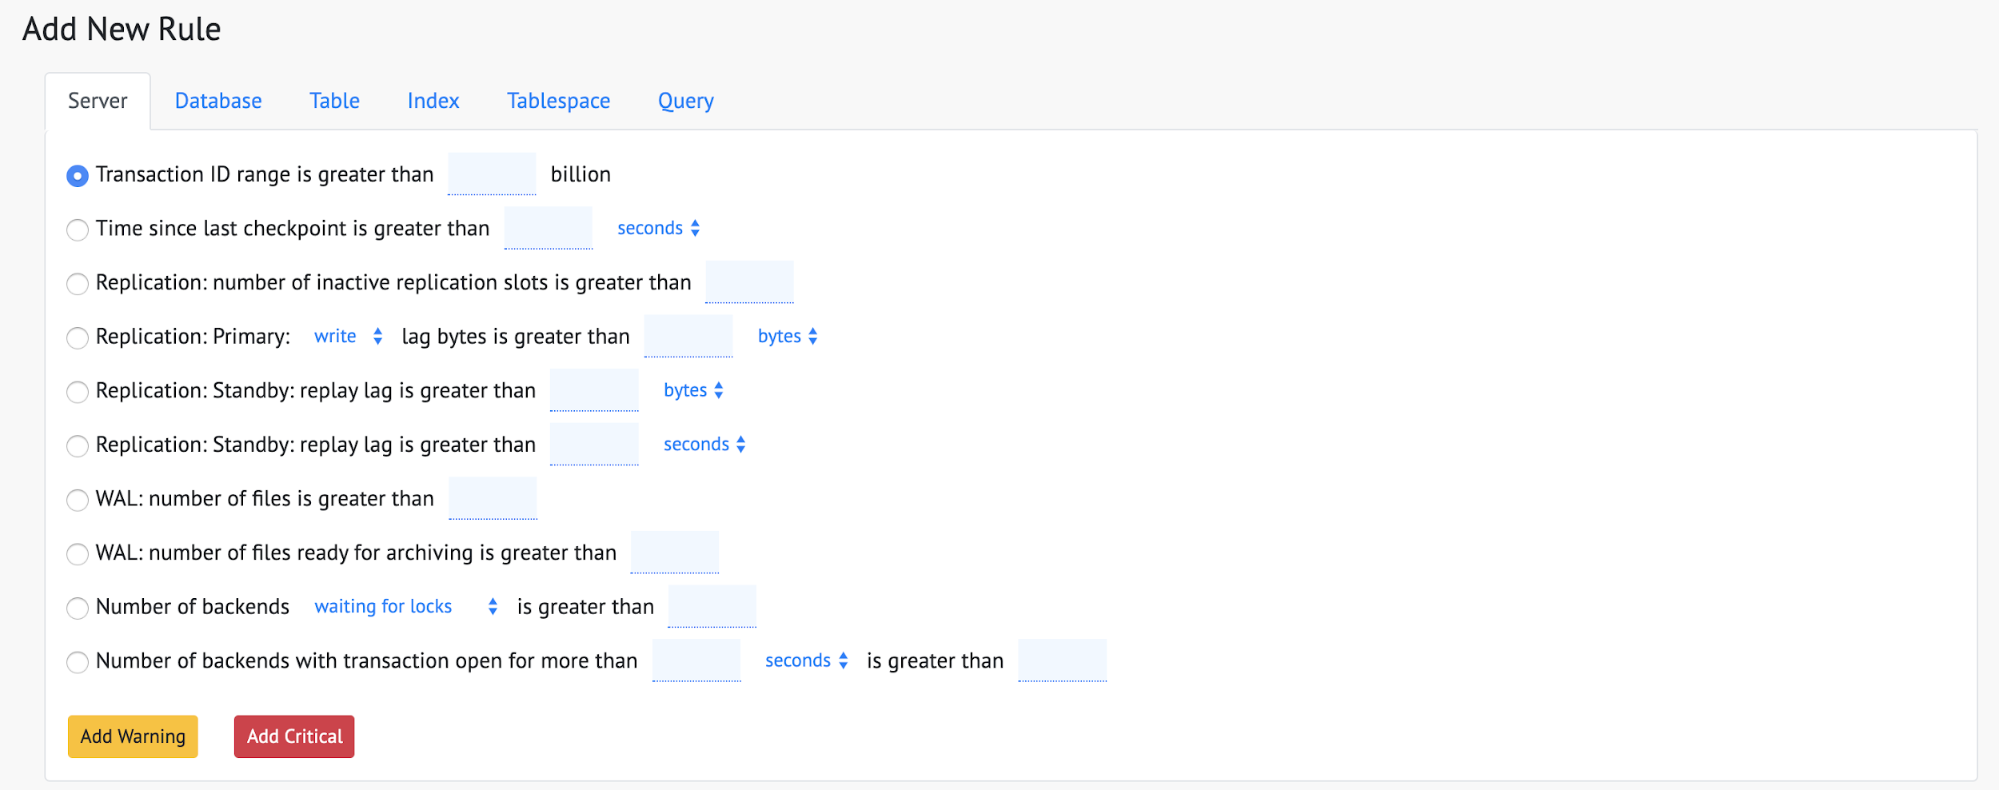
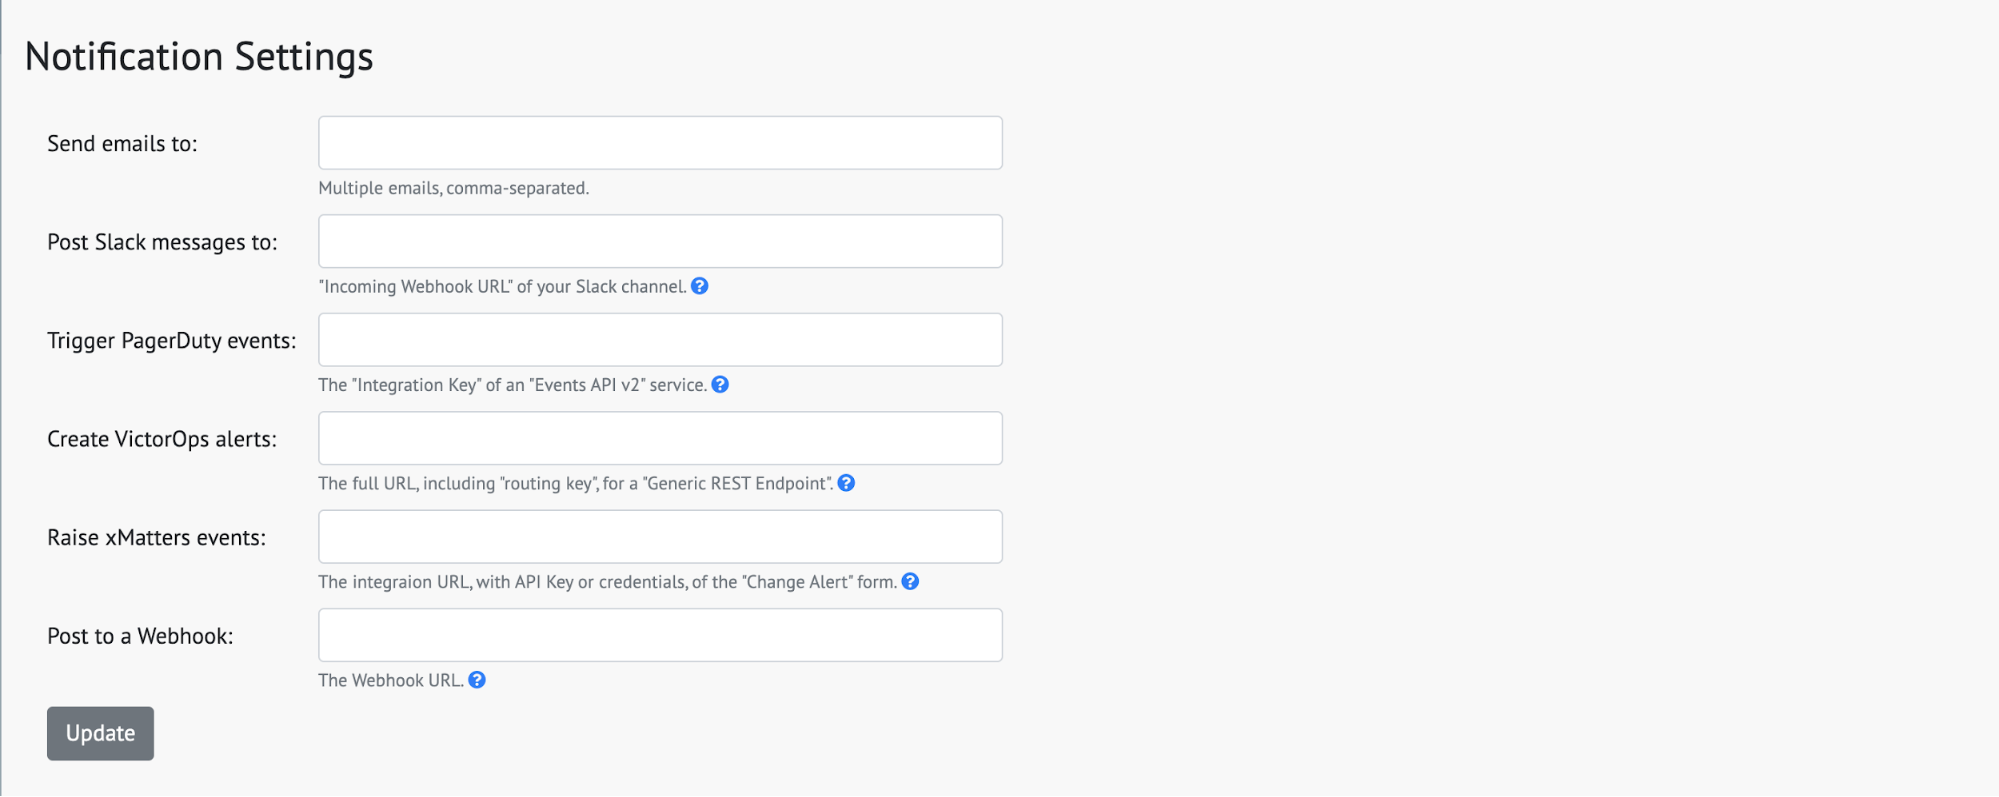
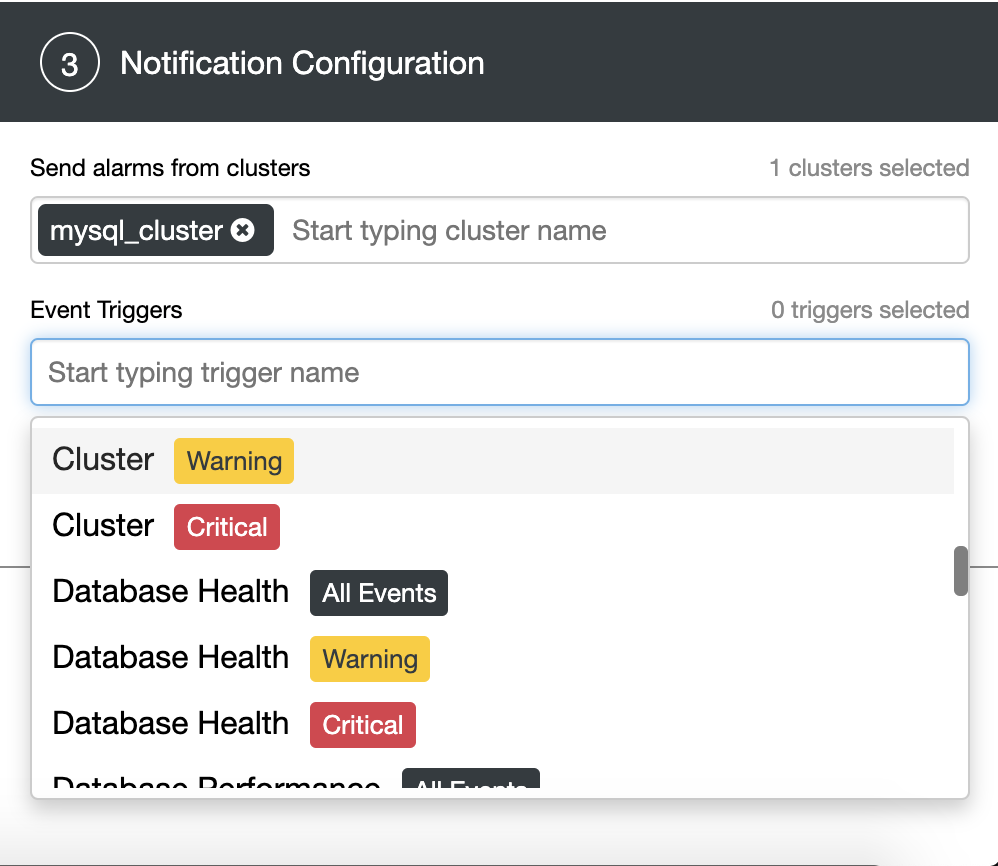
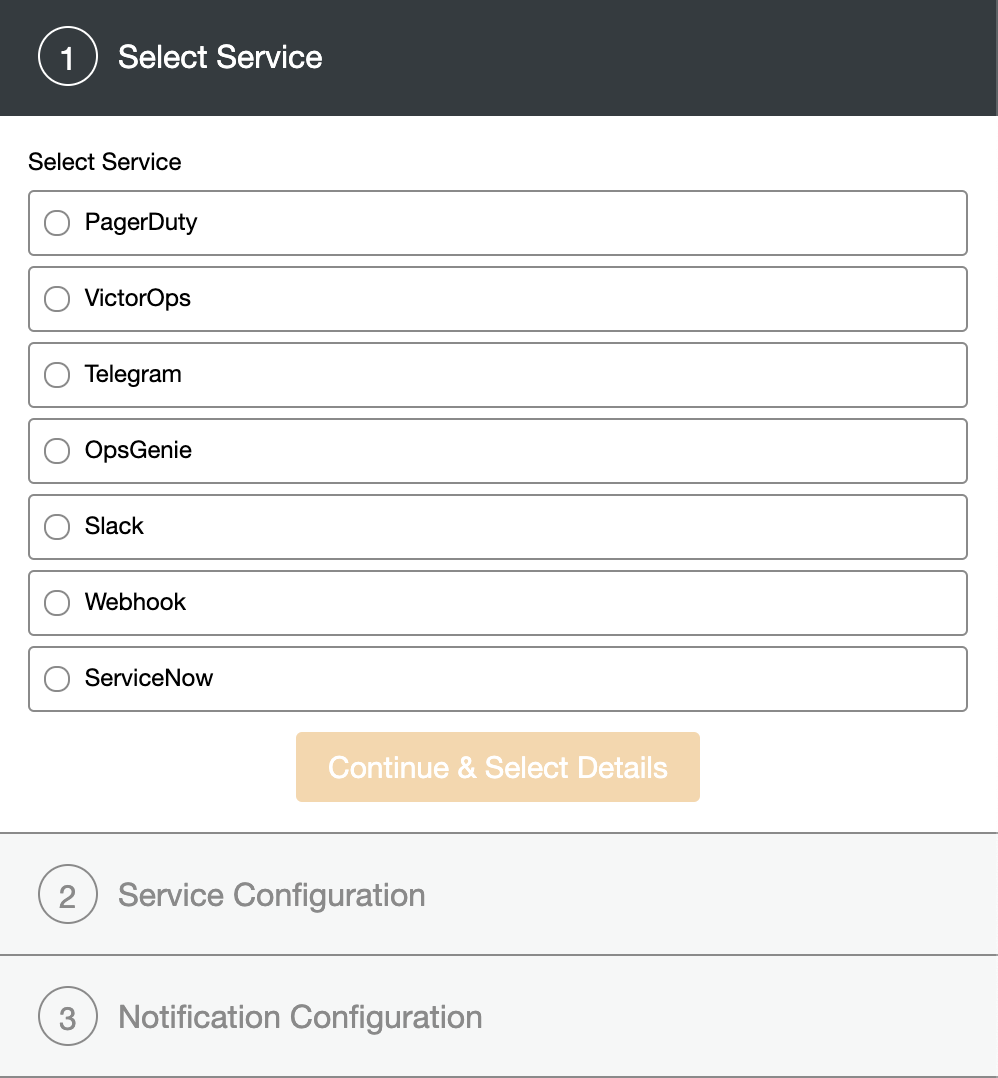
ClusterControl has monitoring and alerting services that help you know what is happening or even if something happened previously. 

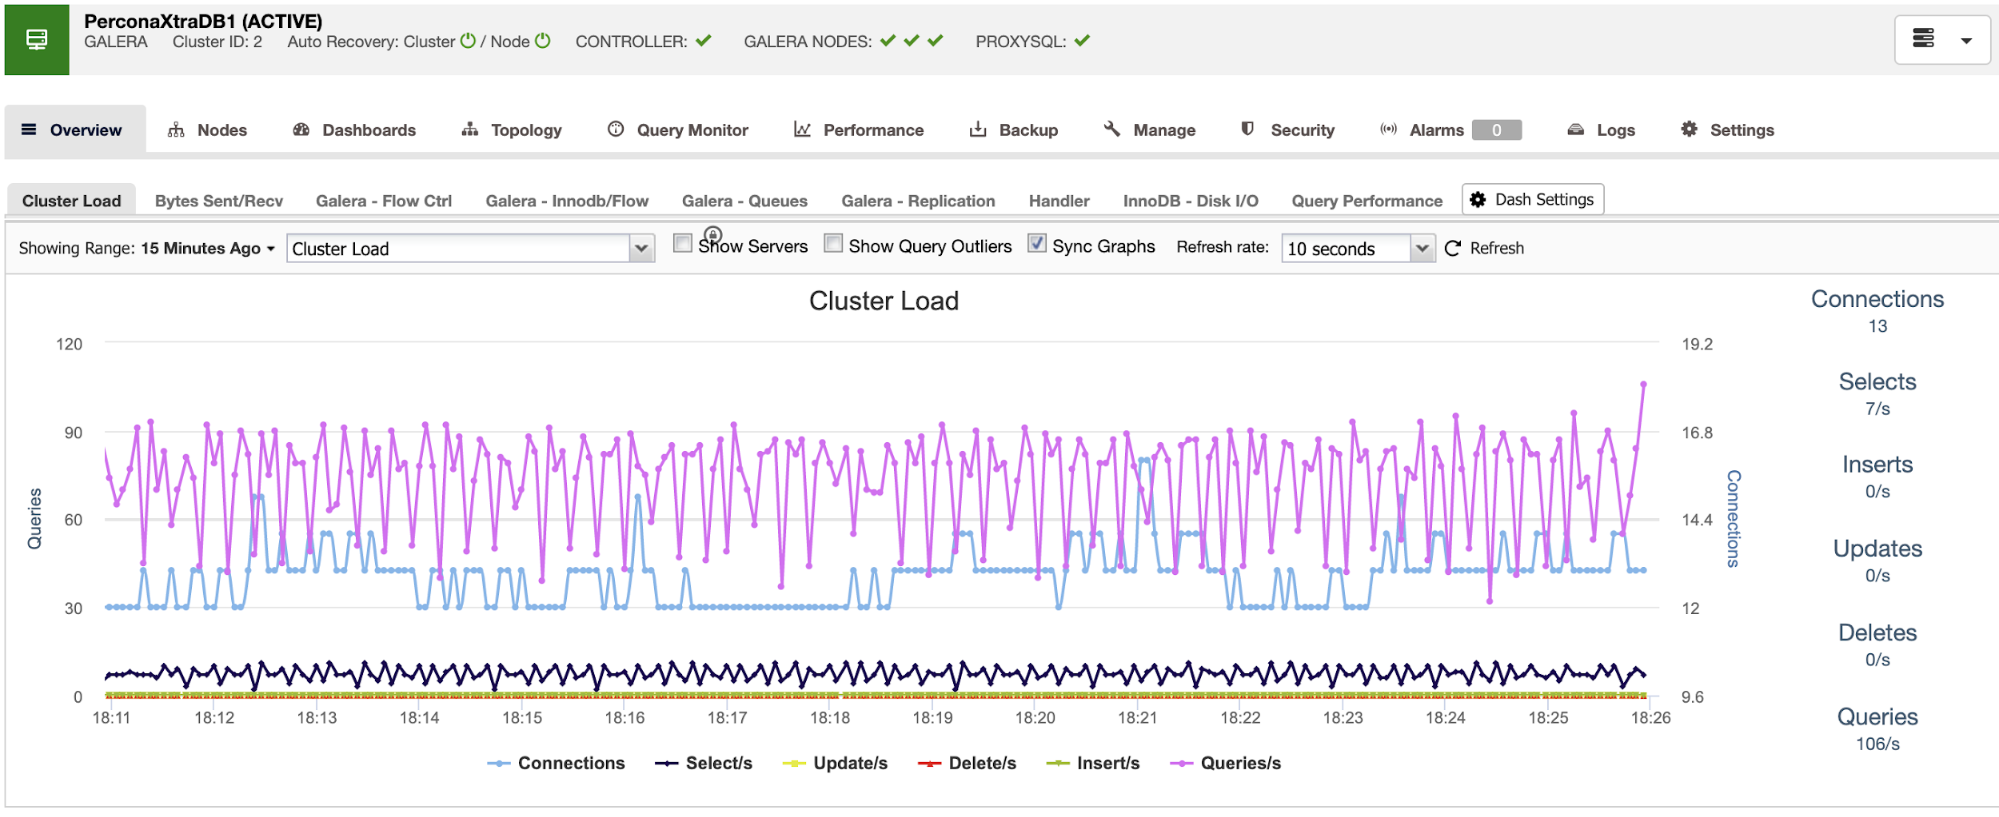
You can also use the dashboard section to have a more user-friendly view about the status of your systems.

Conclusion

In case of a master database failure, you will want to have all the information in place to take the necessary actions ASAP. Having a good DRP is the key to keep your system running all (or almost all) the time. This DRP should include a well-documented failover process to have an acceptable RTO (Recovery Time Objective) for the company.


Setting up ClusterControl as a Bastion Host for your Database Servers

$
0
0

A bastion host is a gateway host between an inside network and an outside network. It is commonly used to access remote hosts sitting on a different network which has no direct connection between the two endpoints. Bastion host acts as a middle-man to connect both ends, thus making it a "jump" host to access to the other side. This is one of the popular ways to secure the server from being exposed to the outside world.

In this blog post, we are going to look at how simple it is to set up ClusterControl as a bastion host to restrict remote SSH access to our database and proxy servers. Our architecture for this setup is looking like this:

In this setup, we have two database servers with a load balancer server deployed and managed by ClusterControl and another host acts as a backup bastion host. The bastion hosts sit in between the end-user and the internal network hosting our production database tier.

Deploy or Import a Database Into ClusterControl

The very first step is to install ClusterControl on a host that is not part of your database server or cluster, in this case is cc.mysuperdomain.com. Then setup a passwordless SSH from ClusterControl server to all databases and load balancer hosts. In this example, we have an OS user called "vagrant" on all hosts which also has sudo privileges. Thus, on ClusterControl server:

$ whoami

vagrant

$ ssh-keygen -t rsa # press enter on all prompts

$ cat /home/vagrant/.ssh/id_rsa.pub

Copy the public key entry as shown in the last command above and paste it into /home/vagrant/.ssh/authorized_keys on all other hosts that we want to monitor. If the target hosts support password authentication, there is a simpler way by using the following command:

$ ssh-copy-id vagrant@192.168.111.20

$ ssh-copy-id vagrant@192.168.111.21

$ ssh-copy-id vagrant@192.168.111.22

Basically, we are authorizing the above hosts with that particular SSH key so the source host can access to the destination hosts without password, where the public key of the source host is in the allowed list in authrorized_keys file of the destination servers. Once done, open ClusterControl UI in a browser and go to "Deploy" to deploy a new database server/cluster or "Import" to import an existing server/cluster into ClusterControl. Under the "General & SSH Settings" section, specify the SSH user as "vagrant" with SSH Key Path "/home/vagrant/.ssh/id_rsa.pub", similar to the following screenshot:

Since ClusterControl requires a root or sudo user of the database hosts (as shown above), it surely can be used as a bastion host for SSH service to access the database and load balancer tiers from the external network. We can then close down all unnecessary communication from the outside world and make our production environment more secure.

Web-based SSH

Once the database server/cluster is deployed, we can use the ClusterControl SSH module to access the monitored host by going to ClusterControl -> Nodes -> pick a node -> Node Actions -> SSH Console. A new browser window will be popped up like below:

ClusterControl web-based SSH console is an extension module which works only on Apache 2.4 and later with proxy_module and WebSocket API. It comes as dependencies with the ClusterControl UI package and is enabled by default. ClusterControl uses the same SSH user, authenticated via passwordless SSH that is required when you first deploy or import the database server/cluster into ClusterControl.

The web SSH console mimics common terminal experience with popular emulator tools in the market. You can perform all Linux commands without character escaping, using the standard copy and paste methods (Ctrl+C/Ctrl+V) and works and the output is updated in real time. You can open as many windows as you want and each of them will be established as a new SSH session that originates from the same IP address, which is the ClusterControl host address. The following output shows the active users for the current session if we have opened 3 web SSH windows:

Last login: Thu Apr  9 05:44:11 2020 from 192.168.0.19

[vagrant@proxy2 ~]$ w

 05:44:21 up  2:56, 3 users,  load average: 0.05, 0.05, 0.05

USER     TTY FROM             LOGIN@ IDLE JCPU PCPU WHAT

vagrant  pts/0 192.168.0.19     05:29 1:17 0.03s 0.03s -bash

vagrant  pts/1 192.168.0.19     05:44 17.00s 0.02s 0.02s -bash

vagrant  pts/2 192.168.0.19     05:44 2.00s 0.02s 0.01s w

To close the active SSH connection, type "exit" or "logout". Closing the web browser directly will NOT close the session which makes the connection stay idle. You may need to kill the connection manually from another session or wait until it reaches idle connection timeout.

Due to concern of security over this feature, this module can be disabled by setting the following constant inside /var/www/html/clustercontrol/bootstrap.php to "false", as shown below:

define('SSH_ENABLED', false);

Note that disabling the web SSH feature will not disable the current active SSH connection to the host until the window is closed. We encourage you to only use this feature if necessary, for example, in this case where ClusterControl is the bastion host to the database and load balancer tiers.

SSH Proxying via Bastion Host

Alternatively, you can use SSH ProxyCommand to relay the SSH communication to the end servers sitting behind the bastion host. Otherwise, we have to jump twice - one from client to the bastion host and another jump from the bastion host to the database host in the private network. 

To simplify SSH communication from our workstation to the end servers behind the bastion host, we can make use of SSH client configuration. Create a default SSH client configuration file at ~/.ssh/config and define them all like this:

Host cc-bastion

  Hostname cc.mysuperdomain.com

  User vagrant

  IdentityFile /Users/mypc/.ssh/mykey.pem


Host db1-prod

  Hostname 192.168.111.21

  User vagrant

  IdentityFile /Users/mypc/.ssh/bastion.pem

  ProxyCommand ssh -q -A cc-bastion -W %h:%p


Host db2-prod

  Hostname 192.168.111.22

  User vagrant

  IdentityFile /Users/mypc/.ssh/bastion.pem

  ProxyCommand ssh -q -A cc-bastion -W %h:%p


Host lb1-prod

  Hostname 192.168.111.20

  User vagrant

  IdentityFile /Users/mypc/.ssh/bastion.pem

  ProxyCommand ssh -q -A cc-bastion -W %h:%p

The SSH private key "bastion.pem" can be created by copying the content of /home/vagrant/.ssh/id_rsa on the ClusterControl server (since this key is already allowed in all database and load balancer servers). Login into ClusterControl server and run:

(bastion-host)$ cp /home/vagrant/.ssh/id_rsa bastion.pem

Remote copy bastion.pem from ClusterControl host back to your workstation:

(workstation)$ scp cc.mysuperdomain.com:~/bastion.pem /Users/mypc/.ssh/

For mykey.pem, you can create the private key manually inside your workstation:

(workstation)$ ssh-keygen -t rsa -f /Users/mypc/.ssh/mykey.pem

(workstation)$ cat /Users/mypc/.ssh/mykey.pem.pub

From the "cat" output above, add the entry into /home/vagrant/.ssh/authorized_keys on ClusterControl server (or use ssh-copy-id command as explained before). Note that on every section of the production servers, there is a ProxyCommand entry to relay our communication via bastion host to the servers in the private network. 

From our workstation, we can simply use the following command:

(workstation)$ ssh db1-prod

Last login: Thu Apr  9 09:30:40 2020 from 192.168.0.101

[vagrant@db1: ~]$ hostname

db1.production.local

At this point you are connected to db1-prod via bastion host, cc1.mysuperdomain.com.

Security Configurations

Now, we have verified our database servers can be accessed from ClusterControl UI. It's time to restrict the access to the bastion hosts, ClusterControl server (192.168.0.19), and also a backup host (192.168.0.20), in case the ClusterControl server becomes unreachable. We can achieve this by using two methods:

  • TCP wrappers.
  • Firewalls (pf, iptables, firewalld, ufw, csf).

TCP Wrappers (hosts.allow/hosts.deny)

TCP wrappers protect specific software using hosts.allow and hosts.deny files. For example you could use it to prevent people from connecting by telnet except from specific permitted addresses. TCP wrapper works as in the following order:

  1. The /etc/hosts.allow file is read first - from top to bottom. 
  2. If a daemon-client pair matches the first line in the file, access is granted. 
  3. If the line is not a match, the next line is read and the same check is performed. 
  4. If all lines are read and no match occurs, the /etc/hosts.deny file is read, starting at the top. 
  5. If a daemon-client pair match is found in the deny file, access is denied. 
  6. If no rules for the daemon-client pair are found in either file, or if neither file exists, access to the service is granted.

Thus if we want to allow only ClusterControl (192.168.0.19) and a backup bastion host (192.168.0.20) to the server, we would need to add the following lines into /etc/hosts.allow on every database host:

sshd : 192.168.0.19,192.168.0.20

And add the following lien inside /etc/hosts.deny to deny other hosts apart from the above:

sshd : ALL

When connecting from a host that is not allowed, one would see the following error:

[vagrant@host1 ~]$ hostname -I

192.168.0.211

[vagrant@host1 ~]$ ssh 192.168.0.23

ssh_exchange_identification: read: Connection reset by peer

iptables

Contrary to TCP wrappers, firewalls treat all software the same. There are basically two popular networking filters in the UNIX world called PF (Packet Filter, popular in BSD) and Netfilter (use iptables as the frontend, popular in Linux). Since ClusterControl only supports Linux-based operating systems, we will use iptables to configure the firewall. There are many configuration tools for iptables like firewalld, ufw (Uncomplicated Firewall) and csf (ConfigServer Firewall) to simplify the management of access list, firewall rules and policy chains.

The following iptables commands can be used to allow the SSH connections only from the bastion hosts:

$ iptables -A INPUT -p tcp -s 192.168.0.19 --dport 22 -m comment --comment 'Allow bastion host to SSH port' -j ACCEPT

$ iptables -A INPUT -p tcp -s 192.168.0.20 --dport 22 -m comment --comment 'Allow bastion host to SSH port' -j ACCEPT

$ iptables -A INPUT -p tcp -s 0.0.0.0/0 --dport 22 -m comment --comment 'Drop everything on SSH apart from the above' -j DROP

To save the current active rules, run:

$ iptables-save > ~/ssh.rules

If you want to load a saved rules, simply do:

$ iptables-restore < ~/ssh.rules

Since iptables can also be used for other purposes like packet forwarding, packet altering, NAT, PAT, rate limiting and much more, it could be a bit complicated to maintain depending on how complex your security policy is. 

Conclusion

Using a bastion host (or jump host) can reduce the security threat of SSH service, which is one of the most critical services to manage Linux machines remotely.


A Guide to Configuring a Load Balancer in a MongoDB Sharded Cluster

$
0
0

For any database, the load balancing of all the requests coming from clients is an important and fundamental mechanism to ensure scalability. A proper load balancing solution spreads all the client requests evenly across all of the database resources. If the database cluster is not guarded with a proper load balancing solution, your database won’t be able to handle increased traffic load on it.

Fortunately, MongoDB provides in-built support for load balancing the high traffic by supporting horizontal scaling through sharding. You can distribute the data of your collections across multiple servers using sharding. You can also add new servers/machines to your cluster to handle the increased traffic on the database. You can follow this guide to convert your MongoDB replica cluster into a sharding cluster.

In this article, we will learn about the behavior of the balancer process which runs in the MongoDB sharded clusters and how to modify its behavior. The MongoDB balancer process takes care of distributing your collections evenly across the shards. For example, if one shard of your cluster contains too many chunks of your sharded collection, that particular shard can receive more traffic in comparison to other shards. Therefore, the balancer process balances the chunks of collections properly across the shards. In most of the MongoDB deployments, the default configurations of the balancer process are sufficient enough for normal operations. But, in some situations, database administrators might want to alter the default behavior of this process. If you want to modify the default behavior of the balancer process for any application-level needs or operational requirements then you can follow this guide.

Let’s start with some basic commands to get some information about the balancer process state and status.

Balancer State Status

This command checks whether the balancer is enabled or permitted to run or not. If the balancer process is not running then this command will return false. This will not check whether the balancer process is running or not.

sh.getBalancerState()

Enable the Balancer Process

If the balancer is not enabled by default then you can enable it by running the following command. This command will not start the balancer process but it will enable the process and ensures that chunk balancing won’t be blocked when the balancer process runs the next time.

sh.enableBalancing(<collection_name/namespace>)

Disable the Balancer Process

The balancer process runs at any time by default. Therefore, if you want to disable the balancer process for some specific time period then you can use the following command. One ideal scenario to use this command is when you are taking a backup of your database. 

sh.stopBalancer()

Make sure that the balancer process is stopped before taking the backup. If the process is enabled while taking the database backup, you may end up with some inconsistent replica of your database. This can happen when the balancer process moves some chunks across the shards for load balancing during the backup process.

You can also disable the balancing on some specific collections by providing the full namespace of a collection as a parameter using the following command.

sh.disableBalancing("<db_name>.<collection_name>")

Balancer Running Status

This command checks whether the balancer process is running or not. It also checks whether it is actively managing the sharding chunks or not. Returns true if the process is running otherwise returns false.

sh.isBalancerRunning()

Default Chunk Size Configurations

By default, the chunk size in any MongoDB sharded cluster is 64MB. For most of the scenarios, this is good enough for migrating or splitting the sharded chunks. However, sometimes the normal migration process involves more no of I/O operations than your hardware can process. In these types of situations, you may want to reduce the size of chunks. You can do so by running the following set of commands. 

use config

db.settings.save( { _id:"chunksize", value: <sizeInMB> } )

If you change the default the chunk size in the sharded cluster, keep the following things in mind

  • You can specify the chunk size only between 1 to 1024 MB
  • Automatic splitting will only happen on insert or update
  • Lower chunk sizes will lead to more time during the splitting process.

Schedule Balancing for a Specific Time

When your database size is huge, balancing or migration processes can impact the overall performance of your database. Therefore, it is wise to schedule the balancing process during a specific time window when the load on the database is very less. You can use the following commands to set the time window for the balancer process to run.

use config

db.settings.update({ _id : "balancer" }, { $set : { activeWindow : { start : "<start-time>", stop : "<stop-time>" } } }, true )

Example

Following command will set the time window from 1: 00 AM to 5: 00 AM for the balancing process to run. 

db.settings.update({ _id : "balancer" }, { $set : { activeWindow : { start : "01:00", stop : "05:00" } } }, true )

Make sure that the given timeframe is sufficient enough for a complete balancing process.

You can also remove any existing balancing process time window by running the following command.

db.settings.update({ _id : "balancer" }, { $unset : { activeWindow : true } })

Apart from the above commands, you can also change the replication behavior while doing the chunk migration process by using the _secondaryThrottle parameter. Also, you can use the _waitForDelete property with moveChunk command to tell the balancing process to wait for the current migration’s delete phase before starting with the new chunk migration phase.

Conclusion

Hopefully, this will be all you need while changing the default behavior of the MongoDB balancer process. Balancing is a very important aspect of any MongoDB sharded cluster. So, if you know about the balancing process in detail, it becomes very easy to modify the default behavior of the balancer process according to your needs and use cases.

Running MongoDB with Ops Manager

$
0
0

Database administration goes beyond ensuring smooth operations to having historic performance that will offer some baselines for capacity planning, get real-time performance for load spikes, automating a large cluster of nodes and having a backup plan for the database. 

There are so many automation tools that can perform some of these  tasks, like Ansible, Salt and Puppet but MongoDB Ops Manager offers more beyond their capability. Besides, one needs to know what the database state is, at a  given time and what updates need to be made so that the system is up to date.

What  is MongoDB Ops Manager?

This is a management application for MongoDB created by the MongoDB database engineers to make it easier to and speed up  the processes of deployment, monitoring, backups, and scaling. It is only available with the MongoDB Enterprise Advanced license.

Database usage increases with time as more users use it and the vulnerability of the data involved increases too. A database can be subjected to risks such as network humming and hacking thus affecting a business operation. The database management group needs to notice the changing numbers so as to keep the database in the latest patches and serving capability. MongoDB Ops Manager provides this extension capabilities for an improved database performance in the following ways:

  1. Data Loss Protection
  2. Easy Tasks Automation
  3. Providing  Information on query rates
  4. GUI overall Performance Visibility
  5. Elastic deployments management
  6. Integration with cloud applications

In general, Ops Manager helps in Automation, Monitoring, and Backups.

Ops Manager Automation Features

Managing a large cluster deployment by yourself can become tedious, especially when executing the same instructions over time and (depending on the demand) you will either scale up or down. Some of these tasks may require you to hire database specialists to do so. The Ops Manager GUI offers some of these actions with just a few clicks. You can use it to add or remove nodes to your cluster according to demand and the MongoDB rebalances automatically in regard to  the new topology with minimal or no downtime. 

Some of the operations you performed manually (such as deploying a new cluster, upgrading nodes, adding replica set members and shards) are orchestrated and automated by the Ops Manager. The next time you undertake the procedure, you will just need a click of a button and all the tasks will be executed. There is also an Ops Manager RESTful API to enable you to integrate programmatic management.

With this type of automation, you can reduce your operational costs and overhead.

MongoDG Monitoring with Ops Manager

Monitoring is an important feature for any database system in regards to resource allocation and notifications on database health. Without any idea how your database is performing, chances of hitting a technical hitch are high and consequently catastrophic. MongoDB Ops Manager even has a complete performance visibility in a graphical representation, provides real-time reporting and an alerting capability on key performance indicators such as hardware resources.

In case of capacity planning, the Ops Manager offers a historic performance view from which operational baseline can be derived.

The monitoring is achieved by enabling it in the same MongoDB host. Monitoring collects the data from all nodes in the deployment and an Agent transmits these statistics to the Ops Manager which creates a report on the deployment status in real time. 

From the reports, you can easily see slow and fast queries and figure out how you can optimize them for average performance.

The Ops Manager provides custom dashboards and charts for tracking many databases on key health metrics that include CPU utilization and memory. 

Enabling alerts in the Ops Manager is important as you would want  to know which key metrics from the database are out of range. Their configuration varies in terms of parameters affecting individual hosts, agents, replica sets and backups. The Ops Manager offers 4 major reporting strategies to keep you overhead of any potential technical hitches: Incident Management system, SMS, Email or Slack.

You can also use the Ops Manager RESTful API and feed the data to platforms such APM to view the health metrics.

MongoDB Backups with Ops Manager

Data loss is one of the most painful setbacks that may impact the operation of any business. However, with Ops Manager, data is protected. Database downtime may happen at any time for example, due to power blackouts or network disconnections. Lucky is the organization that uses the MongoDB Ops Manager since it continuously maintains backups either in a scheduled snapshots mode or a point-in-time recovery. If the MongoDB deployment fails at some point, the most recent backup will be only moments behind last database status before failure hence reduced data loss. 

The tool offers a window for executing queries to backups directly to find the correct point for a restore. Besides, you can use this to understand how data structures have changed with time.

The Ops Manager backup only works with a cluster or replica set, otherwise, for a standalone mongod process you will need to convert it into a single-member replica set.

How Backup and Restoration Work with Ops Manager

After enabling backup in MongoDB deployment, the backup performs an initial sync of the deployment’s data the same way as it could be creating a new invisible member of a replica set.An agent sends the initial sync and oplog data over the HTTPS back to Ops Manager. During the backup process, the database withholds all throughput operations but they are  recorded in the oplog hence it is also sent to get the last update.

The backup will then tail each replica set’s oplog to maintain an on disk standalone database (head database) which will be maintained by the Ops Manager for each backed up replica set. This head database stays consistent with the original primary to the last oplog supplied via the agent.

For a sharded cluster, a restore can be made from checkpoints between snapshots while for a replica set a restore can be made from selected points in time. 

For a snapshot restoration, the Ops Manager will read directly from the snapshot storage. 

When using point-in-time or check point, the Ops manager restores a full snapshot from the snapshot storage and then applies the stored oplogs to a specified point. The Ops manager delivers the snapshot and oplog update using a HTTPS mechanism.

How much oplog you keep per backup will determine how much time a checkpoint and point-in-time restore can cover.

Integration with Cloud Applications

Not all MongoDB deployments are run from the same cluster host. There are so many cloud hosts (such as Red Hat OpenShift, Kubernates and Pivotal Cloud Foundry) are making the integration complicated with other tools. Ops Manager, however, can be integrated with these variety of cloud application deployment platforms hence making it consistent and elegant to run and deploy workloads wherever they need to be, ensuring same database configuration in different environments and controlling them from a single platform.

Conclusion

Managing a large MongoDB cluster deployment is not an easy task.  Ops Manager is an automation tool that offers a visualized database state and an alerting system; key features in providing information about the health of the database. It does, however, require an Enterprise License which for some organizations can be out of the budget.

ClusterControl provides an alternative, offering many of the same features and functions of Ops Manager but at more than half the cost. You can learn more about what ClusterControl does for MongoDB here.

Announcing ClusterControl 1.7.6: HA Stack Deployments in the Cloud with HAProxy

$
0
0

We’re excited to announce the 1.7.6 release of ClusterControl - the only database management system you’ll ever need to take control of your open source database infrastructure. 

This new edition expands our commitment to cloud integration by allowing a user to deploy a SQL database stack to the cloud provider of your choice with the HAProxy load balancer pre-configured. This makes it even simpler and faster to get a highly available deployment of the most popular open source databases into the cloud with just a couple of clicks.

In addition to this new function we also have improved our new MySQL Freeze Frame system by adding the ability to snapshot the process list before a cluster failure.

Release Highlights

Simple Cloud Deployment of HA Database Stack with Integrated HAProxy

  • Improvements to the cloud deployment GUI to allow deployment and configuration of HAProxy along with the database stack to the cloud provider of your choosing. 

MySQL Freeze Frame (BETA)

  • Now snapshots the MySQL process list before a cluster failure.

Additional Misc Improvements

  • CMON Upgrade operations are logged in a log file.
  • Many improvements and fixes to PostgreSQL Backup, Restore, and Verify Backup. 
  • A number of legacy ExtJS pages have been migrated to AngularJS.

View Release Details and Resources

Release Details

Cloud Deployment of HA Database Stack with Integrated HAProxy 

In ClusterControl 1.6 we introduced the ability to directly deploy a database cluster to the cloud provider of your choosing. This made the deployment of highly available database stacks simpler than it had ever been before. Now with the new release we are adding the ability to deploy an HAProxy Load Balancer right alongside the database in a complete, pre-configured full stack.

Load balancers are an essential part of traffic management and performance, and you can now deploy a pre-integrated database/load balancer stack using our easy-to-use wizard.

PostgreSQL Improvements

Over the course of the last few months, we have been releasing several patches which culminated in the release of ClusterControl 1.7.6. You can review the changelog to see all of them. Here are some of the highlights...

  • Addition of Read/Write Splitting for HAProxy for PostgreSQL
  • Improvements to the Backup Verification process
  • Improvements to the Restore & Recovery functions
  • Several fixes and improvements regarding Point-in-Time Recovery
  • Bug fixes regarding the Log & Configuration files
  • Bug fixes regarding process monitoring & dashboards

PostgreSQL Load Balancing in the Cloud Made Easy

$
0
0

We’d mentioned many times the advantages of using a Load Balancer in your database topology. It could be for redirecting traffic to healthy database nodes, distribute the traffic across multiple servers to improve performance, or just to have a single endpoint configured in your application for an easier configuration and failover process.

Now with the new ClusterControl 1.7.6 version, you can not only deploy your PostgreSQL cluster directly in the cloud, but also you can deploy Load Balancers in the same job. For this, ClusterControl supports AWS, Google Cloud, and Azure as cloud providers. Let’s take a look at this new feature.

Creating a New Database Cluster

For this example, we’ll assume that you have an account with one of the supported cloud providers mentioned, and configured your credentials in a ClusterControl 1.7.6 installation.

If you don’t have it configured, you must go to ClusterControl -> Integrations -> Cloud Providers -> Add Cloud Credentials.

Here, you must choose the cloud provider and add the corresponding information.

This information depends on the cloud provider itself. For more information, you can check our official documentation.

You don’t need to access your cloud provider management console to create anything, you can deploy your Virtual Machines, Databases, and Load Balancers directly from ClusterControl. Go to the deploy section and select “Deploy in the Cloud”.

Specify vendor and version for your new database cluster. In this case, we’ll use PostgreSQL 12.

Add the number of nodes, cluster name, and database information like credentials and server port.

Choose the cloud credentials, in this case, we’ll use an AWS account. If you don’t have your account added into ClusterControl yet, you can follow our documentation for this task.

Now you must specify the virtual machine configuration, like operating system, size, and region.

In the next step, you can add Load Balancers to your Database Cluster. For PostgreSQL, ClusterControl supports HAProxy as Load Balancer. You need to select the number of Load Balancer nodes, instance size, and the Load Balancer information. 

This Load Balancer information is:

  • Listen Port (Read/Write): Port for read/write traffic.
  • Listen Port (Read-Only): Port for read-only traffic.
  • Policy: It can be:
    • leastconn: The server with the lowest number of connections receives the connection
    • roundrobin: Each server is used in turns, according to their weights
    • source: The source IP address is hashed and divided by the total weight of the running servers to designate which server will receive the request

Now you can review the summary and deploy it.

ClusterControl will create the virtual machines, install the software, and configure it, all in the same job and in an unattended way.

You can monitor the creation process in the ClusterControl activity section. When it finishes, you will see your new cluster in the ClusterControl main screen.

If you want to check the Load Balancers nodes, you can go to ClusterControl -> Nodes -> HAProxy node, and check the current status.

You can also monitor your HAProxy servers from ClusterControl by checking the Dashboard section.

Now you are done, you can check your cloud provider management console, where you will find the Virtual Machines created according to your selected ClusterControl job options.

Conclusion

As you could see, having a Load Balancer in front of your PostgreSQL cluster in the cloud is really easy using the new ClusterControl“Deploy in the Cloud” feature, where you can deploy your Databases and Load Balancer nodes in the same job.

Managing Your Open Source Databases from Your iPad

$
0
0

With the current COVID-19 situation ongoing, plenty of people have started to work from home. Among those are people whose job is to manage database systems. The lockdowns which have been announced all over the world mean that kids are also staying at home too. Homeschooling is now a thing, in many cases it comes with some sort of online learning activities. This creates pressure on the resources available at home. Who should be using laptops? Moms and Dads working from home or their kids, for their online classes. People often experience an “every laptop and tablet counts” situation. How can you do your job while having only an iPad available? Can you manage your database system with its help? Let’s take a look at this problem.

Connectivity

The main issue to solve would most likely be connectivity.

If you can use one of the supported VPN methods, good for you. If not, you can search the App Store for additional VPN clients like . Hopefully you’ll be able to find something suitable for you like, for example, OpenVPN Connect.

One way or the other, as soon as you can connect to your VPN, you can start working. There are a couple of ways to approach it. One might be a traditional way involving SSH access. Technically speaking, a 13'’ iPad with a Smart Keyboard can be quite a nice replacement for a laptop. Still, for those smaller, 10’’ screens, you have to accept some compromises.

For connecting over SSH we used Terminus. Here’s how it looks.

With on-screen keyboard work space is quite limited. On the other hand, you can achieve everything you could have achieved using your laptop. It’s just more time consuming and more annoying.

In full screen mode it’s slightly better but the font is really small. Sure, you can increase its size:

But then you end up scrolling through the kilometers of text. Doable but far from comfortable. You can clearly see that managing databases in such a way is quite hard, especially if we are talking about emergency situations where you have to act quickly.

Luckily, there’s another approach where you can rely on the database management platform to help you in your tasks. ClusterControl is an example of such a solution.

We are not going to lie, as every UI, ClusterControl will work better on larger screens, but it still works quite well:

It can help you to deal with the regular tasks like monitoring the replication status.

You can scroll through the metrics and see if there are any problems with your database environment.

With just a couple of clicks you can perform management tasks that otherwise would require executing numerous CLI commands.

You can manage your backups, edit the backup schedule, create new backups, restore, verify. All with just a couple of clicks.

As you can see, an iPad might be quite a powerful tool in dealing with database management tasks. Even with the low screen estate, through using proper tools like ClusterControl, you can achieve almost the same outcome.

SysAdmin Working from Home? Tips to Automate MySQL, MariaDB, Postgres & MongoDB

$
0
0
Wednesday, April 22, 2020 - 16:00 to 16:30

Are you an SysAdmin who is now responsible for your companies database operations? Then this is the webinar for you. Learn from a Senior DBA the basics you need to know to keep things up-and-running and how automation can help.


Tips for Managing MongoDB Remotely

$
0
0

Working remotely due to the Covid-19 pandemic means an increase in the importance of isolated infrastructures; more specifically ones that can only be accessed through an internal network, but in a way that authorized people from the outside world can access the system anytime or anywhere. 

In this article, we will share some basic steps that you must implement with MongoDB to ensure secure access while administering the database.

Securing MongoDB

Before accessing the MongoDB database remotely, you must perform a “hardening” of the environment. Set the following on the infrastructure side:

Enable MongoDB Authentication 

This feature is mandatory to enable, regardless if we want to access the MongoDB database from the internal network or from an external network. Before enabling the authorization, you must first create an admin user in MongoDB. You can run below command to create admin user in your one of mongoDB server:

$ mongo

> use admin

> db.createUser(

      {

          user: "admin",

          pwd: "youdontknowmyp4ssw0rd",

          roles: [ "root" ]

      }

  );

Above command will create a new user called admin with root privileges. You can enabled the MongoDB Auth feature by opening the /etc/mongod.conf file and then adding the following line:

  security:

   authorization: 'enabled'

Do not forget to restart your mongoDB service to apply the changes. Above command will restrict access to the database, only the one who has access credentials who are eligible to log in.

Setup Roles and Privileges

To prevent the misuse of access to MongoDB, we can implement role-based access by creating several roles and its privileges.

Make sure you have a list of users who need to access the database and understand each individual’s needs and responsibilities. Create roles and assign the privileges to these created roles. After that, you can assign your user to a role based on the responsibilities.

This approach helps us to minimize the abuse of authority and identify the role and user immediately when something unwanted happened.

Configure an SSL / TLS Connection

MongoDB supports SSL / TLS connections for securing data in transit. To implement this, you have to generate your own SSL Key, you can generate it using openssl. To enable SSL / TLS support, you can edit the /etc/mongod.conf file and add the following parameter:

  net:

      tls:

         mode: requireTLS

         certificateKeyFile: /etc/mongo/ssl/mongodb.pem

After adding these parameters, you need to restart the MongoDB service.  If you have MongoDB replicaset architecture, you need to apply them on each node. SSL is also needed when the client will access  MongoDB, whether it is from the application side or from the client directly.

For production use, you should use valid certificates generated and signed by a single certificate authority. You or your organization can generate and maintain certificates as an independent certificate authority, or use certificates generated by third-party TLS/SSL vendors. Prevent using a self signed certificate, unless it is a trusted network.

Restrict the Database Port

You have to make sure that only the MongoDB port is opened on the firewall server or firewall appliance, make sure no other ports are open.

Securing the MongoDB Connection

Remote connection via public internet presents the risk of data being transmitted from local users to the database server and vice versa. Attackers can interrupt the interconnection, which in this case is known as MITM (Min-in-The-Middle) attack. Securing connection is very necessary when we manage / administer the database remotely, some things we can apply to protect our access to the database are as follows:

Private Network Access

VPN (Virtual Private Network) is one of the fundamental things when we want to access our infrastructure from outside securely. VPN is a private network that uses public networks to access the remote sites. VPN setup requires hardware that must be prepared on the private network side, beside that the client also needs VPN software that supports access to the private network.

Besides using VPN, another way to access MongoDB server is by port forwarding database port via SSH, or better known as SSH Tunneling. 

Use SSL / TLS from the Client to the Database Server

In addition to implementing secure access using VPN or SSH Tunneling, we can use SSL / TLS which was previously configured on the MongoDB side. You just need the SSL key that you have and try connecting to the database using the SSL Key.

Enable Database Monitoring

It is essential to enable the monitoring service to understand the current state of the databases. The monitoring server can be installed under the public domain that has SSL / TLS enabled, so automatically access to the browser can use HTTPs.

Conclusion

It is really fun to work from home, you can interact with your kids and at the same time monitor your database. You must follow the above guidelines to make sure you do not get attacked or have data stolen when accessing your database remotely.

My Favorite PostgreSQL Extensions - Part One

$
0
0

This is in continuation of my previous blog entry wherein I had touched upon a topic of PostgreSQL  Extensions. PostgreSQL Extensions are a plug and play set of enhancements that add an extra feature-set to a PostgreSQL cluster. Some of these features are as simple as reading or writing to an external database while others could be a sophisticated solution to implement database replication, monitoring, etc.

PostgreSQL has evolved over the years from a simple open source ORDBMS to a powerful database system with over 30 years of active development offering reliability,  performance, and all ACID compliant features. With PostgreSQL 12 released a few months ago,  this database software is only getting bigger, better, and faster. 

Occasionally, extensions needed to be added to a PostgreSQL cluster to achieve enhanced functionality that were unavailable in the native code, because they were either not developed due to time constraints or due to insufficient evidence of edge case database problems. I am going to discuss a few of my favourite extensions in no particular order, with some demos that are used by developers and DBAs. 

Some of these extensions may require to be included in the shared_preload_libraries server parameter as a comma separated list to be preloaded at the server start. Although most of the extensions are included in the contrib  module of source code,  some have to be downloaded from an external website dedicated only to PostgreSQL extensions called the PostgreSQL Extension Network

In this two part blog series we will discuss extensions used to access data (postgres_fwd) and shrink or archive databases (pg_partman). Additional extensions will be discussed in the second part.

postgres_fdw

The postgres_fdw is a foreign data wrapper extension that can be used to access data stored in external PostgreSQL servers. This extension is similar to an older extension called dblink but it differs from its predecessor by offering standards-compliant syntax and better performance. 

The important components of postgres_fdw are a server, a user mapping, and a foreign table. There is a minor overhead added to the actual cost of executing queries against remote servers which is the communication overhead. The postgres_fdw extension is also capable of communicating with a remote server having a version all the way up to PostgreSQL 8.3, thus being backward compatible with earlier versions.

Demo

The demo will exhibit a connection from PostgreSQL 12 to a PostgreSQL 11 database.  The pg_hba.conf settings have already been configured for the servers to talk to each other. The extensions control files have to be loaded into the PostgreSQL shared home directory before creating the extension from Inside a  PostgreSQL cluster. 

Remote Server:

$ /usr/local/pgsql-11.3/bin/psql -p 5432 -d db_replica postgres

psql (11.3)

Type "help" for help.


db_replica=# create table t1 (sno integer, emp_id text);

CREATE TABLE


db_replica=# \dt t1

        List of relations

 Schema | Name | Type  |  Owner

--------+------+-------+----------

 public | t1   | table | postgres


db_replica=# insert into t1 values (1, 'emp_one');

INSERT 0 1

db_replica=# select * from t1;

 sno | emp_id

-----+---------

   1 | emp_one

(1 row)

Source Server:

$ /database/pgsql-12.0/bin/psql -p 5732 postgres

psql (12.0)

Type "help" for help.

postgres=# CREATE EXTENSION postgres_fdw;

CREATE EXTENSION


postgres=# CREATE SERVER remote_server

postgres-# FOREIGN DATA WRAPPER postgres_fdw

postgres-# OPTIONS (host '192.168.1.107', port '5432', dbname 'db_replica');

CREATE SERVER


postgres=# CREATE USER MAPPING FOR postgres

postgres-# SERVER remote_server

postgres-# OPTIONS (user 'postgres', password 'admin123');

CREATE USER MAPPING


postgres=# CREATE FOREIGN TABLE remote_t1

postgres-# (sno integer, emp_id text)

postgres-# server remote_server

postgres-# options (schema_name 'public', table_name 't1');

CREATE FOREIGN TABLE


postgres=# select * from remote_t1;

 sno | emp_id

-----+---------

   1 | emp_one

(1 row)


postgres=# insert into remote_t1 values (2,'emp_two');

INSERT 0 1


postgres=# select * from remote_t1;

 sno | emp_id

-----+---------

   1 | emp_one

   2 | emp_two

(2 rows)

The WRITE operation from the source server reflects the remote server table immediately. A similar extension called oracle_fdw also exists which enables READ and WRITE access between PostgreSQL and Oracle tables. In addition to that, there is another extension called file_fdw which enables data access from flat files on disk. Please refer to the official documentation of postgres_fdw published here, for more information and details.

pg_partman

As databases and tables grow, there is always a need to shrink databases, archive data that is not needed or at least partition tables into various smaller fragments. This is so the query optimizer only visits the parts of the table that satisfy query conditions, instead of scanning the whole heap of tables. 

PostgreSQL has been offering partitioning features for a long time including Range, List, Hash, and Sub-partitioning techniques. However, it requires a lot of administration and management efforts such as defining child tables that inherit properties of a parent table to become its partitions, creating trigger functions to redirect data into a partition and further create triggers to call those functions, etc. This is where pg_partman comes into play, wherein all of these hassles are taken care of automatically.

Demo

I will show a quick demo of setting things up and inserting sample data. You will see how the data inserted into the main table gets automatically redirected to the partitions by just setting up pg_partman. It is important for the partition key column to be not null.

db_replica=# show shared_preload_libraries;

 shared_preload_libraries

--------------------------

 pg_partman_bgw

(1 row)


db_replica=# CREATE SCHEMA partman;

CREATE SCHEMA

db_replica=# CREATE EXTENSION pg_partman SCHEMA partman;

CREATE EXTENSION

db_replica=# CREATE ROLE partman WITH LOGIN;

CREATE ROLE

db_replica=# GRANT ALL ON SCHEMA partman TO partman;

GRANT

db_replica=# GRANT ALL ON ALL TABLES IN SCHEMA partman TO partman;

GRANT

db_replica=# GRANT EXECUTE ON ALL FUNCTIONS IN SCHEMA partman TO partman;

GRANT

db_replica=# GRANT EXECUTE ON ALL PROCEDURES IN SCHEMA partman TO partman;

GRANT

db_replica=# GRANT ALL ON SCHEMA PUBLIC TO partman;

GRANT

db_replica=# create table t1  (sno integer, emp_id varchar, date_of_join date not null);

db_replica=# \d

        List of relations

 Schema | Name | Type  |  Owner

--------+------+-------+----------

 public | t1   | table | postgres

(1 row)


db_replica=# \d t1

                         Table "public.t1"

    Column    |       Type        | Collation | Nullable | Default

--------------+-------------------+-----------+----------+---------

 sno          | integer           |           |          |

 emp_id       | character varying |           |          |

 date_of_join | date              |           | not null |

db_replica=# SELECT partman.create_parent('public.t1', 'date_of_join', 'partman', 'yearly');

 create_parent

---------------

 t

(1 row)


db_replica=# \d+ t1

                                             Table "public.t1"

    Column    |       Type        | Collation | Nullable | Default | Storage  | Stats target | Description

--------------+-------------------+-----------+----------+---------+----------+--------------+-------------

 sno          | integer           |           |          |         | plain    |              |

 emp_id       | character varying |           |          |         | extended |              |

 date_of_join | date              |           | not null |         | plain    |              |

Triggers:

    t1_part_trig BEFORE INSERT ON t1 FOR EACH ROW EXECUTE PROCEDURE t1_part_trig_func()

Child tables: t1_p2015,

              t1_p2016,

              t1_p2017,

              t1_p2018,

              t1_p2019,

              t1_p2020,

              t1_p2021,

              t1_p2022,

              t1_p2023


db_replica=# select * from t1;

 sno | emp_id | date_of_join

-----+--------+--------------

(0 rows)


db_replica=# select * from t1_p2019;

 sno | emp_id | date_of_join

-----+--------+--------------

(0 rows)


db_replica=# select * from t1_p2020;

 sno | emp_id | date_of_join

-----+--------+--------------

(0 rows)


db_replica=# insert into t1 values (1,'emp_one','01-06-2019');

INSERT 0 0

db_replica=# insert into t1 values (2,'emp_two','01-06-2020');

INSERT 0 0

db_replica=# select * from t1;

 sno | emp_id  | date_of_join

-----+---------+--------------

   1 | emp_one | 2019-01-06

   2 | emp_two | 2020-01-06

(2 rows)


db_replica=# select * from t1_p2019;

 sno | emp_id  | date_of_join

-----+---------+--------------

   1 | emp_one | 2019-01-06

(1 row)


db_replica=# select * from t1_p2020;

 sno | emp_id  | date_of_join

-----+---------+--------------

   2 | emp_two | 2020-01-06

(1 row)

This is a simple partitioning technique but each of the above simple partitions can be further divided into sub-partitions. Please check the official documentation of pg_partman published here, for more features and functions it offers.

Conclusion

Part two of this blog will discuss other PostgreSQL extensions like pgAudit, pg_repack and HypoPG.

Tips for Reducing Production Database Infrastructure Costs

$
0
0

The database tier is one of the most important layers in a system architecture. It must be set up correctly from the beginning due to it being stateful, it is harder to scale as compared to other tiers. If the growth is exponential, the initial decision might get caught in the middle with outrageous total cost of ownership (TCO) which could inhibit database scaling and eventually affect business growth.

In this blog post, we are going to look into some tips on how to reduce the overall TCO of our production database infrastructure costs.

Use Open-Source Software & Tools

Using open source software is the very first step to lower down the database infrastructure cost. Almost every commercial software available in the market has an equivalent of it in the open-source world. The most flexible and cost-effective way to optimize your database strategy is to use the right tool for the right job.

It is possible to build the whole database tier with open source softwares and tools, for example:

Component

Product/Tool/Software

Infrastructure

OpenStack, CloudStack

Hypervisor

Virtualbox, KVM, Xen, QEMU

Firewall

PFSense, OPNsense, Untangle, Simplewall

Containerization

Docker, rkt, lxc, OpenVZ

Operating system

Ubuntu Server, CentOS, Debian, CoreOS

Relational DBMS

MySQL, MariaDB, PostgreSQL, Hive, SQLite

Document-based DBMS

MongoDB, Couchbase, CouchDB

Column-based DBMS

Cassandra, ClickHouse, HBase

Key-value DBMS

Redis, memcached

Time-series DBMS

InfluxDB, OpenTSDB, Prometheus, TimeScaleDB

Database backup tool

Percona Xtrabackup, MariaDB Backup, mydumper, pgbackrest

Database monitoring tool

PMM, Monyog, Zabbix, Nagios, Cacti, Zenoss, Munin

Database management tool

PHPMyAdmin, HeidiSQL, PgAdmin, DBeaver

Database load balancer

ProxySQL, HAProxy, MySQL Router, Pgbouncer, pg-pool, MaxScale

Topology manager

Orchestrator, MaxScale, MHA, mysqlrpladmin

Configuration management tool

Ansible, Puppet, Chef, Salt

Keyring server

Vault, CyberArk Conjur, Keywhiz

Service discovery

etcd, consul, Zookeeper

ETL tools

Talend, Kettle, Jaspersoft

As listed above, there is a plethora of open source software and tools in various categories available that you can choose from. Although the software is available ‘for free’, many offer a dual licensing model - community or commercial, where the latter comes with extended features and technical support. 

There are also free companion and helper tools that are created and maintained as open-source projects which can improve the usability, efficiency, availability and productivity of a product. For example, for MySQL you can have PHPmyAdmin, Percona Xtrabackup, Orchestrator, ProxySQL and gh-ost, amongst many others. For PostgreSQL we have for example Slony-I, pgbouncer, pgAdmin and pgBackRest. All of these tools are free to use and are driven by community. 

Using open source software will also make us free from vendor lock-in, makes us independent from a vendor for products and services. We are free to use other vendors without substantial switching costs.

Run on Virtual Machines or Containers

Hardware virtualization allows us to make use of all of the resources available in a server. Despite the performance overhead due to physical resource sharing by the guest hosts, it gives us a cheaper alternative to have multiple instances running simultaneously without the cost of multiple physical servers. It is easier to manage, reusable for different purposes like testing and understanding how well our application and database communicate and scale across multiple hosts. 

Running your production database on bare-metal servers is the best option if performance matters. Most of the time, the performance overhead on hardware virtualization can be minimized if we plan proper isolation of the guest hosts with fair load distribution and if we allocate sufficient resources to avoid starvation when sharing resources.

Containers are better placed, at least theoretically, to achieve lower TCO (total cost of ownership) than traditional hardware virtualization. Containers are an operating system-level virtualization, so multiple containers can share the OS. Hardware virtualization uses a hypervisor to create virtual machines and each of those VMs has its own operating system. If you are running on virtualization with the same operating system over guest OSes, that could be a good justification to use container virtualization instead. You can pack more on to a server that is running containers on one version of an OS compared to a server running a hypervisor with multiple copies of an OS.

For databases, almost all popular DBMS container images are available for free in DockerHub:

There are also tons of articles and guidelines on how to run your open source database on Docker containers, for example this one which I like (because I wrote it! :-) ), MySQL Docker Containers: Understanding the Basics.

Embrace Automation

Automation can greatly reduce cost by shrinking the DBA/DevOps team size with all sorts of automation tools. Managing the database infrastructure lifecycle involves many risky and repetitive tasks which require expertise and experience. Hiring talented candidates, or building up a team to support the infrastructure can take a significant amount of time, and it comes with a handsome cost for salary, benefits and employee welfare. 

Human beings have feelings. They have bad days, personal problems, pressure for results, many types of distractions, and so on. It’s common to forget a step, or misfire a destructive command especially on a daily repetitive task. A well-defined configuration creates a stable process. The machine will never miss a single step.

Repetitive tasks like database deployment, configuration management, backup, restore and software upgrade can be automated with infrastructure provisioning tools like Terraform, Heat (OpenStack) or CloudFormation (AWS) together with configuration management tools like Ansible, Chef, Salt or Puppet. However, there are always missing parts and pieces that need to be covered by a collection of custom scripts or commands like failover, resyncing, recovery, scaling and many more. Rundeck, an open source runbook automation tool can be used to manage all the custom scripts, which can bring us closer to achieving full automation.

A fully automated database infrastructure requires all important components to work in-sync together like monitoring, alerting, notification, management, scaling, security and deployment. ClusterControl is a pretty advanced automation tool to deploy, manage, monitor and scale your MySQL, MariaDB, PostgreSQL and MongoDB servers. It supports handling of complex topologies with all kinds of database clustering and replication technologies offered by the supported DBMS. ClusterControl has all the necessary tools to replace specialized DBAs to maintain your database infrastructure. We believe that existing sysadmins or devops teams alongside ClusterControl would be enough to handle most of the operational burden of your database infrastructure.

Utlize Automatic Scaling

Automatic scaling is something that can help you reduce the cost if you are running on multiple database nodes in a database cluster or replication chain. If you are running on cloud infrastructure with on-demand or pay-per-use subscription, you probably want to turn off underutilized instances to avoid accumulating unnecessary usage charges. If you are running on AWS, you may use Amazon CloudWatch to detect and shut down unused EC2 instances, as shown in this guide. For GCP, there is a way to auto-schedule nodes using Google Cloud Scheduler.

There are a number of ways to make database automatic scaling possible. We could use Docker containers with the help of orchestration tools like Kubernetes, Apache Mesos or Docker Swarm. For Kubernetes, there are a number of database operators available that we can use to deploy or scale a cluster. Some of them are:

Automatic database scaling is somehow trivial with the ClusterControl CLI. It's a command line client that you can use to control, manage, monitor your database cluster and it can perform basically anything that the ClusterControl UI is capable of. For example, adding a new MySQL slave node is just a command away:

$ s9s cluster --add-node --cluster-id=42 --nodes='192.168.0.93?slave' --log

Removing a database node is also trivial:

$ s9s cluster --remove-node --cluster-id=42 --nodes='192.168.0.93' --log

The above commands can be automated with a simple bash script, where you can combine with infrastructure automation tools like Terraform or CloudFormation to decommission unused instances. If you are running on supported clouds (AWS, GCP and Azure), ClusterControl CLI can also be used create a new EC2 instance in the default AWS region with a command line:

$ s9s container --create aws-apsoutheast1-mysql-db1 --log

Or you could also remove the instance created in AWS directly:

$ s9s container --delete aws-apsoutheast1-mysql-db1 --log

The above CLI makes use of the ClusterControl Cloud module where one has to configure the cloud credentials first under ClusterControl -> Integrations -> Cloud Providers -> Add Cloud Credentials. Note that the "container" command in ClusterControl means a virtual machine or a host that sits on top of a virtualization platform, not a container on top of OS-virtualization like Docker or LXC.

Using SSH Tunneling as a VPN Alternative

$
0
0

Using a VPN connection is the most secure way to access a network if you are working remotely, but as this configuration could require hardware, time, and knowledge, you should probably want to know alternatives to do it. Using SSH is also a secure way to access a remote network without extra hardware, less time consuming, and less effort than configuring a VPN server. In this blog, we’ll see how to configure SSH Tunneling to access your databases in a secure way.

What is SSH?

SSH (Secure SHell), is a program/protocol that allows you to access a remote host/network, run commands, or share information. You can configure different encrypted authentication methods and it uses the 22/TCP port by default, but it’s recommended changing it for security reasons.

How to Use SSH?

The most secure way to use it is by creating an SSH Key Pair. With this, you don’t only need to have the password but also the private key to be able to access the remote host.

Also, you should have a host with only the SSH server role, and keep it as isolated as possible, so in case of an external attack, it won’t affect your local servers. Something like this:

Let’s see first, how to configure the SSH server.

Server configuration

Most of the Linux Installation has SSH Server installed by default, but there are some cases where it could be missing (minimal ISO), so to install it, you just need to install the following packages:

RedHat-based OS

$ yum install openssh-clients openssh-server

Debian-based OS

$ apt update; apt install openssh-client openssh-server

Now you have the SSH Server installed, you can configure it to only accept connections using a key.

vi /etc/ssh/sshd_config

PasswordAuthentication no

Make sure you change it after having the public key in place, otherwise you won’t be able to log in.

You can also change the port and deny root access to make it more secure:

Port 20022

PermitRootLogin no

You must check if the selected port is open in the firewall configuration to be able to access it.

This is a basic configuration. There are different parameters to change here to improve the SSH security, so you can follow the documentation for this task.

Client configuration

Now, let’s generate the key pair for the local user “remote” to access the SSH Server. There are different types of keys, in this case, we’ll generate an RSA key.

$ ssh-keygen -t rsa

Generating public/private rsa key pair.

Enter file in which to save the key (/home/remote/.ssh/id_rsa):

Created directory '/home/remote/.ssh'.

Enter passphrase (empty for no passphrase):

Enter same passphrase again:

Your identification has been saved in /home/remote/.ssh/id_rsa.

Your public key has been saved in /home/remote/.ssh/id_rsa.pub.

The key fingerprint is:

SHA256:hT/36miDBbRa3Povz2FktC/zNb8ehAsjNZOiX7eSO4w remote@local

The key's randomart image is:

+---[RSA 3072]----+

|                 |

|        ..  .    |

|       o.+.=.    |

|        *o+.o..  |

|       +S+o+=o . |

|      . o +==o+  |

|         =oo=ooo.|

|        .E=*o* .+|

|         ..BB ooo|

+----[SHA256]-----+

This will generate the following files in a directory called “.ssh” inside the user’s home directory:

$ whoami

remote

$ pwd

/home/remote/.ssh

$ ls -la

total 20

drwx------ 2 remote remote 4096 Apr 16 15:40 .

drwx------ 3 remote remote 4096 Apr 16 15:27 ..

-rw------- 1 remote remote 2655 Apr 16 15:26 id_rsa

-rw-r--r-- 1 remote remote  569 Apr 16 15:26 id_rsa.pub

The “id_rsa” file is the private key (keep it as secure as possible), and the “id_rsa.pub” is the public one that must be copied to the remote host to access it. For this, run the following command as the corresponding user:

$ whoami

remote

$ ssh-copy-id -p 20022 remote@35.166.37.12

/usr/bin/ssh-copy-id: INFO: Source of key(s) to be installed: "/home/remote/.ssh/id_rsa.pub"

/usr/bin/ssh-copy-id: INFO: attempting to log in with the new key(s), to filter out any that are already installed

/usr/bin/ssh-copy-id: INFO: 1 key(s) remain to be installed -- if you are prompted now it is to install the new keys

remote@35.166.37.12's password:


Number of key(s) added:        1


Now try logging into the machine, with:   "ssh -p '20022''remote@35.166.37.12"

and check to make sure that only the key(s) you wanted were added.

In this example, I’m using the port 20022 for SSH, and my remote host is 35.166.37.12. I have also the same user (remote) created in both local and remote hosts. You can use another user in the remote host, so in that case, you should change the user to the correct one in the ssh-copy-id command:

$ ssh-copy-id -p 20022 user@35.166.37.12

This command will copy the public key to the authorized_keys file in the remote .ssh directory. So, in the SSH Server you should have this now:

$ pwd

/home/remote/.ssh

$ ls -la

total 20

drwx------ 2 remote remote 4096 Apr 16 15:40 .

drwx------ 3 remote remote 4096 Apr 16 15:27 ..

-rw------- 1 remote remote  422 Apr 16 15:40 authorized_keys

-rw------- 1 remote remote 2655 Apr 16 15:26 id_rsa

-rw-r--r-- 1 remote remote  569 Apr 16 15:26 id_rsa.pub

Now, you should be able to access the remote host:

$ ssh -p 20022 remote@35.166.37.12

But this is not enough to access your database node, as you are in the SSH Server yet.

SSH Database Access

To access your database node you have two options. The classic way is, if you are in the SSH Server, you can access it from there as you are in the same network, but for this, you should open two or three connections.

First, the SSH connection established to the SSH Server:

$ ssh -p 20022 remote@35.166.37.12

Then, the SSH connection to the Database Node:

$ ssh remote@192.168.100.120

And finally, the database connection, that in case of MySQL, is:

$ mysql -h localhost -P3306 -udbuser -p

And for PostgreSQL:

$ psql -h localhost -p 5432 -Udbuser postgres

If you have the database client installed in the SSH Server, you can avoid the second SSH connection and just run the database connection directly from the SSH Server:

$ mysql -h 192.168.100.120 -P3306 -udbuser -p

or:

$ psql -h 192.168.100.120 -p 5432 -Udbuser postgres

But, this could be annoying as you used to use the database connection directly from your computer connected in the office, so let’s see how to use the SSH Tunneling for this.

SSH Tunneling

Following the same example, we have:

  • SSH Server Public IP Address: 35.166.37.12
  • SSH Server Port: 20022
  • Database Node Private IP Address: 192.168.100.120
  • Database Port: 3306/5432
  • SSH user (local and remote): remote
  • Database user: dbuser

Command Line

So, if you run the following command in your local machine:

$ ssh -L 8888:192.168.100.120:3306 remote@35.166.37.12 -p 20022 -N

This will open the port 8888 in your local machine, which will access the remote database node, port 3306, via the SSH Server, port 20022, using the “remote” user.

So, to make it more clear, after running this command, you can access the remote database node, running this in your local machine:

$ mysql -h localhost -P8888 -udbuser -p

Graphic Tools

If you are using a graphic tool to manage databases, most probably it has the option to use SSH Tunneling to access the database node. 

Let’s see an example using MySQL Workbench:

And the same for PgAdmin:

As you can see, the information asked here is pretty similar to the used for the command line SSH Tunneling connection.

Conclusion

Security is important for all companies, so if you are working from home, you must keep data as secure as you are while working in the office. As we mentioned, for this, probably the best solution is having a VPN connection to access the databases, but if for some reason it is not possible, you need to have an alternative to avoid handling data over the internet in an insecure way. As you could see, configuring SSH Tunneling for accessing your databases is not rocket science, and is probably the best alternative in this case.

An Overview of MongoDB User Management

$
0
0

Database User Management is a particularly important part of data security, as we must understand who is accessing the database and set the access rights of each user. If a database does not have a proper user management, user access is going to get very messy and difficult to maintain as time goes on.

MongoDB is a NoSQL database and document store. Applying the RBAC (Role Based-Access Control) concept is key to implementing proper user management to manage user credentials.

What is Role Based Access Control (RBAC)?

RBAC is an approach which restricts the system only to authorized users. In an organization, roles are created for various job functions, in the database we then create the access rights to carry out some operations assigned to a particular role. 

Staff members (or other system users) are assigned certain roles and through them are assigned permissions to perform computer system functions. Users are not given permissions directly, but only get them through their role (or roles). Managing individual user rights becomes a matter of simply placing the appropriate role into the user's account; this simplifies general operations (such as adding users or changing user departments).

Three main rules are set for RBAC are:

  • Role Assignment: A subject can execute permissions only if the subject has been chosen or has been assigned a role.
  • The Role of Authorization: the active role of a subject must be authorized for the subject. With rule 1 above, this rule ensures that users can take roles only for those who are authorized.
  • Permission Authorization: A subject can execute permits only if permission is authorized for the active role of the subject. With rules 1 and 2, this rule ensures that users can exercise permission only for those who are authorized.

This blog will briefly review Role Based Access Control in the MongoDB database.

MongoDB User Roles

MongoDB has several types of roles in the database, those are...

Built-in Roles

Provides access to data and actions to MongoDB through role-based authorization and has built-in roles that provide several levels of access in the database.

Role gives several privileges to do something on the resource that has been created. MongoDB built-in roles have several categories:

  • User Database: Roles Database users have a role to manipulate data in non-system collection. Examples of User Database roles are: read, readWrite.
  • Database Administration: Roles Database Administration deals with administrative management of databases such as user administration, schema, and objects in it. 
  • Examples of Database Administration roles are: dbAdmin, userAdmin, dbOwner.
  • Cluster Administration: The role of cluster administration is to administer the entire MongoDB system, including its replicasets and shards. Examples of cluster administration roles are: clusterAdmin, clusterManager.
  • Backup and Restoration: This Roles is specific for functions related to database backup in MongoDB. Examples of roles are: backup, restore.
  • All-Database Roles: Roles are in the database admin and have access to all databases except local and config. Examples are: readAnyDatabase, readWriteAnyDatabase, userAdminAnyDatabase.
  • Superuser: Roles has the ability to grant access to every user, to every privilege, in all databases. Example of this role: root

User Defined Roles

In addition to built-in roles, we can create our own roles according to our needs, what privileges we will give to those roles. To create roles, you can use the db.createRole () function command. Besides being able to create roles, there are several other functions to manage existing roles such as: db.dropRole () which is useful for deleting existing roles in the database, db.getRole () functions to get all information from specific roles.

Privilege Actions in MongoDB

Privileges actions in MongoDB are actions that can be performed by a user on a resource. MongoDB has several action categories, namely:

  • Database Management Actions, actions related to commands relating to database administration such as changePassword, createCollection, createIndex actions. 
  • Query and Write Actions, actions related to executing data manipulation in a collection. For example in the insert action, the command that can be executed in that action is the insert command which can insert into documents.
  • Deployment Management Actions, actions relating to changes in database configuration. Some actions that fall into the Deployment Management category are cpuProfiler, storageDetails, killOp. 
  • Replication Actions, actions relating to the execution of database replication resources such as replSetConfigure, replSetHeartbeat.
  • Server Administration Actions, actions related to commands from server administration resources on mongoDB such as logrotate actions that are used to rotate log databases at the operating system level.
  • Sharding Actions, actions related to commands from database sharding databases such as addShard to add new shard nodes.
  • Session Actions, actions related to resource sessions in a database such as listSessions, killAnySession.
  • Diagnostic Actions, actions related to the diagnosis of resources such as dbStats to find out the latest conditions in the database.
  • Free Monitoring Actions, actions related to monitoring in the database.

Managing MongoDB User & Roles

You can create a user and then assign the user to built-in roles, for example as follows:

db.createUser( {

user: "admin",

pwd: "thisIspasswordforAdmin",

roles: [ { role: "root", db: "admin" } ]

} );

In the script above, meaning the admin user will be made with a password that has been defined with builtin root roles, where the role is included in the Superuser category.

Besides that, you can assign more than one roles to a user, here is an example:

db.createUser(

{user:'businessintelligence', 

pwd:'BIpassw0rd', 

roles:[{'role':'read', 'db':'oltp'}, { 'role':'readWrite', 'db':'olapdb'}]

});

Business intelligence users have 2 roles, first the read roles in the oltp database, and the readWrite roles in the olapdb database.

Creating user defined roles can use the db.createRole () command. You must determine the purpose of creating the role so that you can determine what actions will be in that role. The following is an example of making a role for monitoring the Mongodb database :

use admin

db.createRole(

   {

     role: "RoleMonitoring",

     privileges: [

       { resource: { cluster: true }, actions: [ "serverStatus" ] }

     ],

     roles: []

   }

)

Then we can assign the user defined role to the user that we will create, can use the following command:

db.createUser( {

user: "monuser",

pwd: "thisIspasswordforMonitoring",

roles: [ { role: "RoleMonitoring", db: "admin" } ]

} );

Meanwhile, to assign the role to an existing user, you can use the following command:

db.grantRolesToUser(

    "existingmonuser",

    [

      { role: "RoleMonitoring", db: "admin" }

    ]

)

To revoke an existing user of a role, you can use the following command :

db.revokeRolesFromUser(

    "oldmonguser",

    [

      { role: "RoleMonitoring", db: "admin" }

    ]

)

By using user defined roles, we can create roles as we wish according to the actions we will take on those roles, such as roles to restrict users can only delete rows on certain databases. 

Conclusion

The application of access rights can improve security. Mapping roles and users in the database makes it easy for you to manage user access.

Make sure all of this information regarding roles and rights are documented properly with restrictive access to the document. This helps you share the information to the other DBA or support personnel and is handy for audits and troubleshooting.


Tips for Managing PostgreSQL Remotely

$
0
0

A wide range of resources are available for you when managing your PostgreSQL database clusters remotely. With the right tools managing it remotely is not a difficult task. 

Using fully-managed services for PostgreSQL offers an observability that can deliver most of what you need to manage your database. They provide you with an alerting system, metrics, automation of time-consuming system administration tasks, managing your backups, etc.

When running on-prem it’s a different challenge. That's what we'll cover in this blog. We'll share tips on managing your PostgreSQL database cluster remotely.

Database Observability

The term observability might not be a familiar thing to some folks. Observability is not a thing of the past, it's the trend when managing your databases (or even PaaS or SaaS applications). Observability deals with monitoring, but to some extent it covers the ability to determine the state of your database health and performance and has a proactive and reactive capability which decides based on a certain status of your database nodes. 

A good example of this is in ClusterControl. When ClusterControl detects warnings based on the checks on a given configuration it will send alerts to the provided channels. These can be setup and customized by the system or Database Administrator. 

If your primary database has been degraded and unable to process transactions (either read or writes) ClusterControl will react accordingly and start to trigger a failover so that a new node can process the unwarranted cause of overflowing traffic. While this occurs, ClusterControl can notify the engineers what happened by triggering alarms and sending alerts. Logs are also centralized and which investigation and diagnostic tasks can be done in one place, allowing you to provide a quick result.

Although this might not mean that ClusterControl is a complete package for Observability, it is one of the powerful tools. There are tools that are more architectured also to manage especially in containerized environments such as Rancher mixed with Datadog

How Does This Help You In Managing Remotely?

One basic principle of management is to have peace of mind. If a problem occurs, the tools you are using for observability must be able to notify you via email, sends you SMS, or through a pager applications (like PagerDuty) to alert you to the status of your databases cluster,

or you can receive alerts such like below...

It is very important that it notifies you when changes occur. You can then improve and analyze the state of your infrastructure and avoid any impacts that can affect the business.

Database Automation

It is very important that most of the time-consuming tasks are automated. Automation allows you to downsize the manpower. What does it mean to automate your PostgreSQL database clusters? 

Failover

Failover is an automatic approach that occurs when an unprecedented incident occurs (such as a failure on hardware, a system crash, power loss in your main primary node, or a network loss within the entire data center). Your failover capacity must be regularly tested and follow industry standard practices. The service discovery of an internal failure must go to the point that it has been determined as true and it's actually happening.

In ClusterControl, when an incident occurs it triggers the failover mechanism and promotes the most updated standby node and then triggers alarms as seen below...

Then, it works in the background for a failover as you have seen below, the progress is on the move.

leaving the result as it finishes below...

Backup Scheduling

Backups are a very important part of Disaster and Recovery Planning (DRP). Backups serve as your backbone when your cluster data goes adrift after a split brain or network partition encounters. There are certain occasions where pg_rewind can be beneficial also but automation of your backups are always very important to avoid any such huge loss of data and lesser RPO and RTO.

In ClusterControl you can take or create a backup without any special tools or add utility work to script an automated backup. All are there and it will be up to your organization when the backup will take place and what are the policies of your backup including its retention. In fact, the most important thing here is, backup shall not interfere with your production environment and shall not lockup your nodes when backup takes place.

Backup verification plays also a very important role here. Rest assured, your backup must be a valid type of backup and is a reliable copy when crisis takes place. Adding the mechanism to store your backup not only in your premises or data center, but also store it elsewhere securely like in the cloud or to AWS S3 or Google Cloud Storage for example.

With ClusterControl, this has been taken easily and single handedly all in the platform by just following the GUI as shown below,

This allows you to pick up the backup method you choose, store it in the cloud to add more backup retention and assurance by spreading your backup copy not only in one source but also in the cloud. Then, you have an option to verify the backup once it's finishing creating the backup to verify if it's a valid one or not. Part of it is also you can choose to encrypt your backup which is a very important practice when storing your data at rest and complying security regulatory guidelines.

Database Security

Security is usually the majority's primary concern when it comes to managing your PostgreSQL database cluster remotely. Who will be able to access the database remotely or should it be only local? How to add security restrictions and how to manage the users and review the user's permission by a Security Analyst. It is very important to have a more set in place and provide a clear picture of your architecture so it can be dissected where are the loopholes and what are the necessary things to improve or tighten the security.

ClusterControl provides you an overview of and management of your PostgreSQL users and provides you a visualization and an editor for your pg_hba.conf, which manages how the users can be authenticated. 

For User Management it provides an overview of the list of users and it's privileges in the database cluster. It also allows you here to modify or change the user's privileges if it's not in accordance to your security and company guidelines. Managing remotely requires that all of your users must have specific permissions and roles and when it can only be used or accessed and limits the role to avoid damage in your database.

It's also very important in your PostgreSQL to review and verify that there's no lapses with the authentication of the user. When it can be allowed and its scope to be able to connect to the servers. It is best that this is visualized like we have below,

This allows you to easily verify and avoid the authentication overlooked for such possible loopholes that an attacker might be able to log in due to weak rules in authentication.

Using SSL and encryption adds more security and robustness when your database is accessed remotely. But if you are accessing your database remotely outside your organization premise, it is best to encapsulate your data such as logging in through a VPN. You can check out our blog on Multi-DC PostgreSQL: Setting Up a Standby Node at a Different Geo-Location Over a VPN.

Centralized Database Logs

Centralization of aggregated logs provides you a very convenient way to investigate and implement a security analysis tool to understand your database clusters and how they behave. This is very beneficial when managing remote databases. Some common approaches are using Logstash using the ELK stack or the powerful open-source management for logs, Graylog

Why is it Important to Centralize Your Database Logs? 

In case you need to investigate a cluster-wide problem and see what has been going through your database clusters, proxies, or load balancers. It is very convenient to just look upon one place. Some very rich and powerful tools like I mentioned above let you search dynamically and in real time. They also provide metrics and graphs which is a very convenient way for analysis.

With ClusterControl, there's a convenience provided when accessing the logs. Although the logs are not collected and stored centrally, it offers you an overview and ability to read the logs. See below...


You may even review the jobs of what did ClusterControl detected and had acted either based on the Alarms or going through the Jobs just like below,

Conclusion

Managing your PostgreSQL database clusters remotely can be daunting, especially when it comes to security, monitoring, and failover. If you have the right tools, industry standards, and best practices for implementation, security, and observability then you can have peace of mind when you manage your database; regardless of your location.

My Favorite PostgreSQL Extensions - Part Two

$
0
0

This is the second part of my blog “My Favorite PostgreSQL Extensions” wherein I had introduced you to two  PostgreSQL extensions, postgres_fdw and pg_partman. In this part I will explore three more.

pgAudit

The next PostgreSQL extension of interest is for the purpose of satisfying auditing requirements by various government, financial and other certifying bodies such as ISO, BSI, and FISCAM, etc. The standard logging facility which PostgreSQL offers natively with log_statement = all is useful for monitoring, but it does not provide the details required to comply or face the audit. The pgAudit extension focuses on the details of what happened under the hood, while a database was satisfying an application request.

An audit trail or audit log is created and updated by a standard logging facility provided by PostgreSQL, which provides detailed session and/or object audit logging. The audit trail created by pgAudit can get enormous in size depending on audit settings, so care must be observed to decide on what and how much auditing is required beforehand. A brief demo in the following section shows how pgAudit is configured and put to use.

The log trail is created within the PostgreSQL database cluster log found in the PGDATA/log location but the audit log messages are prefixed with a “AUDIT: “ label to distinguish between regular database background messages and audit log records. 

Demo

The official documentation of pgAudit explains that there exists a separate version of pgAudit for each major version of PostgreSQL in order to support new functionality introduced in every PostgreSQL release. The version of PostgreSQL in this demo is 11, so the version of pgAudit will be from the 1.3.X branch. The pgaudit.log is the fundamental parameter to be set that controls what classes of statements will be logged. It can be set with a SET for a session level or within the postgresql.conf file to be applied globally. 

postgres=# set pgaudit.log = 'read, write, role, ddl, misc';

SET


cat $PGDATA/pgaudit.log

pgaudit.log = 'read, write, role, ddl, misc'


db_replica=# show pgaudit.log;

         pgaudit.log

------------------------------

 read, write, role, ddl, misc

(1 row)


2020-01-29 22:51:49.289 AEDT 4710 db_replica postgres [local] psql LOG:  AUDIT: SESSION,3,1,MISC,SHOW,,,show pgaudit.log;,<not logged>


db_replica=# create table t1 (f1 integer, f2 varchar);

CREATE TABLE


2020-01-29 22:52:08.327 AEDT 4710 db_replica postgres [local] psql LOG:  AUDIT: SESSION,4,1,DDL,CREATE TABLE,,,"create table t1 (f1 integer, f2 varchar);",<not logged>


db_replica=#  insert into t1 values (1,'one');

INSERT 0 1

db_replica=#  insert into t1 values (2,'two');

INSERT 0 1

db_replica=#  insert into t1 values (3,'three');

INSERT 0 1

2020-01-29 22:52:19.261 AEDT 4710 db_replica postgres [local] psql LOG:  AUDIT: SESSION,5,1,WRITE,INSERT,,,"insert into t1 values (1,'one');",<not logged>

20-01-29 22:52:38.145 AEDT 4710 db_replica postgres [local] psql LOG:  AUDIT: SESSION,6,1,WRITE,INSERT,,,"insert into t1 values (2,'two');",<not logged>

2020-01-29 22:52:44.988 AEDT 4710 db_replica postgres [local] psql LOG:  AUDIT: SESSION,7,1,WRITE,INSERT,,,"insert into t1 values (3,'three');",<not logged>


db_replica=# select * from t1 where f1 >= 2;

 f1 |  f2

----+-------

  2 | two

  3 | three

(2 rows)


2020-01-29 22:53:09.161 AEDT 4710 db_replica postgres [local] psql LOG:  AUDIT: SESSION,9,1,READ,SELECT,,,select * from t1 where f1 >= 2;,<not logged>


db_replica=# grant select on t1 to usr_replica;

GRANT


2020-01-29 22:54:25.283 AEDT 4710 db_replica postgres [local] psql LOG:  AUDIT: SESSION,13,1,ROLE,GRANT,,,grant select on t1 to usr_replica;,<not logged>


db_replica=# alter table t1 add f3 date;

ALTER TABLE


2020-01-29 22:55:17.440 AEDT 4710 db_replica postgres [local] psql LOG:  AUDIT: SESSION,23,1,DDL,ALTER TABLE,,,alter table t1 add f3 date;,<not logged>


db_replica=# checkpoint;

CHECKPOINT


2020-01-29 22:55:50.349 AEDT 4710 db_replica postgres [local] psql LOG:  AUDIT: SESSION,33,1,MISC,CHECKPOINT,,,checkpoint;,<not logged>


db_replica=# vacuum t1;

VACUUM


2020-01-29 22:56:03.007 AEDT 4710 db_replica postgres [local] psql LOG:  AUDIT: SESSION,34,1,MISC,VACUUM,,,vacuum t1;,<not logged>


db_replica=# show log_statement;

 log_statement

---------------

 none


2020-01-29 22:56:14.740 AEDT 4710 db_replica postgres [local] psql LOG:  AUDIT: SESSION,36,1,MISC,SHOW,,,show log_statement;,<not logged>

The log entries, as shown in the demo above, are only written to the server background logfile when the parameter log_statement is set, however in this case it is not configured but the audit messages are written by virtue of pgaudit.log parameter as evidenced in the demo. There are more powerful options available to fulfill all your database auditing requirements within PostgreSQL, which can be configured by following the official documentation of pgaudit here or on the github repository.pg_repack

This is a favourite extension among many PostgreSQL engineers that are involved directly with managing and keeping the general health of a PostgreSQL cluster. The reason for that will be discussed a little later but this extension offers the functionality to remove database bloat within a PostgreSQL database, which is one of the nagging concerns among very large PostgreSQL database clusters requiring database re-org. 

As a PostgreSQL database undergoes constant and heavy WRITES (updates & deletes), the old data is marked as deleted while the new version of the row gets inserted, but the old data is not actually wiped from a data block. This requires a periodic maintenance operation called vacuuming, which is an automated procedure that executes in the background that clears all the “marked as deleted” rows. This process is sometimes referred to as garbage collection in colloquial terms. 

The vacuuming process generally gives way to the database operations during busier times. The least restrictive manner of vacuuming in favour of database operations results in a large number of “marked as deleted” rows causing databases to grow out of proportion referred to as “database bloat”. There is a forceful vacuuming process called VACUUM FULL, but that results in acquiring an exclusive lock on the database object being processed, stalling database operations on that object.

pg_repack

It is for this reason that pg_repack is a hit among PostgreSQL DBAs and engineers, because it does the job of a normal vacuuming process but offers an efficiency of VACUUM FULL by not acquiring an exclusive lock on a database object, in short, it works online. The official documentation here explains more about the other methods of reorganizing a database but a quick demo as below will put things in appropriate light for better understanding. There is a requirement that the target table must have at least one column defined as a PRIMARY KEY, which is a general norm in most of the production database setups.

Demo

The basic demo shows the installation and usage of pg_repack in a test environment. This demo uses the version 1.4.5 of pg_repack which is the latest version of this extension at the time of publishing this blog. A demo table t1 initially has 80000 rows which undergoes a massive operation of delete, which deletes every 5th row of the table. An execution of pg_repack shows the size of the table before and after.

mydb=# CREATE EXTENSION pg_repack;

CREATE EXTENSION


mydb=# create table t1 (no integer primary key, f_name VARCHAR(20), l_name VARCHAR(20), d_o_b date);

CREATE TABLE

mydb=# insert into t1 (select generate_series(1,1000000,1),'a'||

mydb(# generate_series(1,1000000,1),'a'||generate_series(1000000,1,-1),

mydb(# cast( now() - '1 year'::interval * random()  as date ));

INSERT 0 1000000


mydb=# SELECT pg_size_pretty( pg_total_relation_size('t1'));

 pg_size_pretty

----------------

 71 MB

(1 row)


mydb=# CREATE or replace FUNCTION delete5() RETURNS void AS $$

mydb$# declare

mydb$# counter integer := 0;

mydb$# BEGIN

mydb$#

mydb$#  while counter <= 1000000

mydb$# loop

mydb$# delete from t1 where no=counter;

mydb$# counter := counter + 5;

mydb$# END LOOP;

mydb$# END;

mydb$# $$ LANGUAGE plpgsql;

CREATE FUNCTION

The delete5 function deletes 200000 rows from t1 table using a counter which increments 5 counts

mydb=# select delete5();

 delete5

------


(1 row)

mydb=# SELECT pg_size_pretty( pg_total_relation_size('t1'));

 pg_size_pretty

----------------

 71 MB

(1 row)


$ pg_repack -t t1 -N -n -d mydb -p 5433

INFO: Dry run enabled, not executing repack

INFO: repacking table "public.t1"


$ pg_repack -t t1 -n -d mydb -p 5433

INFO: repacking table "public.t1"


mydb=# SELECT pg_size_pretty( pg_total_relation_size('t1'));

 pg_size_pretty

----------------

 57 MB

(1 row)

As shown above, the original size of the table does not change after executing the delete5  function, which shows that the rows still exist in the table. The execution of pg_repack clears those ‘marked as deleted’ rows from the t1 table bringing down the size of t1 table to 57 MBs. One other good thing about pg_repack is an option for dry run with -N flag, using which you can check what will be executed during an actual run.

HypoPG

The next interesting extension is identical to a popular concept called invisible indexes among proprietary database servers. The HypoPG extension enables a DBA to see the effect of introducing a hypothetical index (which does not exist) and whether it will improve the performance of one or more queries, and hence the name HypoPG.

The creation of a hypothetical index does not require any CPU or disk resources, however, it consumes a connection’s private memory. As the hypothetical index is not stored in any database catalog tables, so there is no impact of table bloat. It is for this reason, that a hypothetical index cannot be used in an EXPLAIN ANALYZE statement while a plain EXPLAIN is a good way to assess if a potential index will be used by a given problematic query. Here is a quick demo to explain how HypoPG works.

Demo

I am going to create a table containing 100000 rows using generate_series and execute a couple of simple queries to show the difference in cost estimates with and without hypothetical indexes.

olap=# CREATE EXTENSION hypopg;

CREATE EXTENSION


olap=# CREATE TABLE stock (id integer, line text);

CREATE TABLE


olap=# INSERT INTO stock SELECT i, 'line ' || i FROM generate_series(1, 100000) i;

INSERT 0 100000


olap=# ANALYZE STOCK;

ANALYZE


olap=#  EXPLAIN SELECT line FROM stock WHERE id = 1;

                       QUERY PLAN

---------------------------------------------------------

 Seq Scan on stock  (cost=0.00..1791.00 rows=1 width=10)

   Filter: (id = 1)

(2 rows)

olap=# SELECT * FROM hypopg_create_index('CREATE INDEX ON stock (id)') ;

 indexrelid |       indexname

------------+-----------------------

      25398 | <25398>btree_stock_id

(1 row)


olap=# EXPLAIN SELECT line FROM stock WHERE id = 1;

                                     QUERY PLAN

------------------------------------------------------------------------------------

 Index Scan using <25398>btree_stock_id on stock  (cost=0.04..8.06 rows=1 width=10)

   Index Cond: (id = 1)

(2 rows)


olap=# EXPLAIN ANALYZE SELECT line FROM stock WHERE id = 1;

                                             QUERY PLAN

----------------------------------------------------------------------------------------------------

 Seq Scan on stock  (cost=0.00..1791.00 rows=1 width=10) (actual time=0.028..41.877 rows=1 loops=1)

   Filter: (id = 1)

   Rows Removed by Filter: 99999

 Planning time: 0.057 ms

 Execution time: 41.902 ms

(5 rows)


olap=# SELECT indexname, pg_size_pretty(hypopg_relation_size(indexrelid))

olap-#   FROM hypopg_list_indexes() ;

       indexname       | pg_size_pretty

-----------------------+----------------

 <25398>btree_stock_id | 2544 kB

(1 row)


olap=# SELECT pg_size_pretty(pg_relation_size('stock'));

 pg_size_pretty

----------------

 4328 kB

(1 row)

The above exhibit shows how the estimated total cost can be reduced from 1791 to 8.06 by adding an index to the “id” field of the table to optimize a simple query. It also proves that the index is not really used when the query is executed with an EXPLAIN ANALYZE which executes the query in real time. There is also a way to find out approximately how much disk space the index occupies using the hypopg_list_indexes function of the extension. 

The HypoPG has a few other functions to manage hypothetical indexes and in addition to that, it also offers a way to find out if partitioning a table will improve performance of queries fetching a large dataset. There is a hypothetical partitioning option of HypoPG extension and more of it can be followed by referring to the official documentation.

Conclusion

As stated in part one, PostgreSQL has evolved over the years in only getting bigger, better and faster with rapid development both in the native source code as well as plug and play extensions. An open source version of the new PostgreSQL can be most suitable for plenty of IT shops that are running one of the major proprietary database servers, in order to reduce their IT CAPEX and OPEX. 

There are plenty of PostgreSQL extensions that offer features ranging from monitoring to high-availability and from scaling to dumping binary datafiles into human readable format. It is hoped that the above demonstrations have shed enormous light on the maximum potential and power of a PostgreSQL database.


Amazon RDS for PostgreSQL Alternatives - ClusterControl for PostgreSQL

$
0
0

Amazon RDS for PostgreSQL is a managed service for PostgreSQL available as part of Amazon Web Services. It comes with a handful of management functions that are intended to reduce the workload of managing the databases. Let’s take a look at this functionality and see how it compares with options available in ClusterControl.

PostgreSQL Deployment

PostgreSQL RDS

PostgreSQL RDS supports numerous versions of PostgreSQL, starting from 9.5.2 up to 12.2:

For Aurora it is 9.6.8 to 11.6:

You can pick if the cluster should be highly available or not at the deployment time.

ClusterControl

ClusterControl supports PostgreSQL in versions 9.6, 10, 11 and 12:

You can deploy a master and multiple slaves using streaming replication.

ClusterControl supports asynchronous and semi-synchronous replication. You can deploy the rest of the high availability stack (i.e. load balancers) at any point in time.

PostgreSQL Backup Management

PostgreSQL RDS

Amazon RDS supports snapshots as the way of taking backups. You can rely on the automated backups or take backups manually at any time.

Restoration is done as a separate cluster. Point-in-time recovery is possible with up to one second granularity. Backups can also be encrypted.

ClusterControl

ClusterControl supports several backup methods for PostgreSQL.

It is possible to store the backup locally or upload it to the cloud. Point-in-time recovery is supported for most of the backup methods.

When restoring, it is possible to do it on an existing cluster, create a new cluster or restore it on a standalone host. It is possible to schedule a backup verification job. Backups can be encrypted.

PostgreSQL Database Monitoring

PostgreSQL RDS

RDS comes with features that provide visibility into your database operations.

Using Performance Insights, you can check the state of the nodes in CloudWatch:

ClusterControl

ClusterControl provides insight into the database operations using the Overview section:

It is also possible to enable agent-based monitoring for more detailed dashboards:

PostgreSQL Scalability

PostgreSQL RDS

In couple of clicks you can scale your RDS cluster by adding replicas to RDS or readers to Aurora:

ClusterControl

ClusterControl provides an easy way to scale up your PostgreSQL cluster by adding a new replica:

PostgreSQL High Availability (HA)

PostgreSQL RDS

Aurora clusters can benefit from a load balancer deployed in front of them. Regular RDS clusters do not have this feature available.

In the Aurora cluster it is possible to promote readers to become master. For RDS clusters you can failover to a read replica but then the replica will become a new node, without any other replicas. You would have to deploy new replicas after the failover completes.

It is possible to deploy highly available clusters for both RDS and Aurora. Failed master nodes are handled automatically, by promotion of one of the available replicas.

ClusterControl

ClusterControl can be used to deploy a full high availability stack that consists of master - slave database cluster, load balancers (HAProxy) and keepalived to provide VIP across load balancers.

It is possible to promote a slave. If the master is unavailable, one of the slaves will be promoted as a new master and remaining slaves will be slaved off the new master.

PostgreSQL Configuration Management

PostgreSQL RDS

In PostgreSQL RDS configuration management can be performed using parameter groups. You can create custom groups with your custom configuration and then assign them to new or existing instances.

This lets you share the same configuration across multiple instances or across whole clusters. There is a separate parameter group for Aurora and RDS. Some of the configuration settings cannot be configured, especially the ones related to backups and replication.

ClusterControl

ClusterControl provides a way of managing the configuration of the PostgreSQL nodes. You can change given parameter on some or all of the nodes:

It is also possible to make the configuration change by directly modifying the configuration files:

In ClusterControl you have full control over the configuration.

Conclusion

These are the main features that can be compared between ClusterControl and Amazon RDS for PostgreSQL

There are also other features that ClusterControl provides that are not available in RDS: Query Monitoring, User Management, & Operational Reports to name a few. 

If you are interested in trying them out, you can download ClusterControl for free and see for yourself how it can help you with managing PostgreSQL clusters.

PGTune Alternatives - ClusterControl PostgreSQL Configuration

$
0
0

If you are new to PostgreSQL the most common challenge you face is about how to tune up your database environment. 

When PostgreSQL is installed it automatically produces a basic postgresql.conf file. This configuration file is normally kept inside the data directory depending on the operating system you are using. For example, in Ubuntu PostgreSQL places the configurations (pg_hba.conf, postgresql.conf, pg_ident.conf) inside /etc/postgresql directory. Before you can tune your PostgreSQL database, you first have to locate the postgresql.conf files. 

But what are the right settings to use? and what are the values set to initially? Using external tools such as PGTune (and alternative tools like ClusterControl) will help you solve this specific problem. 

What is PGTune?

PGTune is a configuration wizard which was originally created by Greg Smith from 2ndQuadrant. It's based on a Python script which is, unfortunately, no longer supported. (It does not support newer versions of PostgreSQL.) It then transitioned into pgtune.leopard.in.ua (which is based on the original PGTune) and is now a configuration wizard you can use for your PG database configuration settings.

PGTune is used to calculate configuration parameters for PostgreSQL based on the maximum performance for a given hardware configuration. It isn't a silver bullet though, as many settings depend not only on the hardware configuration, but also on the size of the database, the number of clients and the complexity of queries. 

How to Use PGTune

The old version of PGTune was based on python script which you can invoked via shell command (using Ubuntu):

root@debnode4:~/pgtune-master# $PWD/pgtune -L -T Mixed -i /etc/postgresql/9.1/main/postgresql.conf | sed -e '/#.*/d' | sed '/^$/N;/^\n/D' 

stats_temp_directory = '/var/run/postgresql/9.1-main.pg_stat_tmp'

datestyle = 'iso, mdy'

default_text_search_config = 'pg_catalog.english'

default_statistics_target = 100

maintenance_work_mem = 120MB

checkpoint_completion_target = 0.9

effective_cache_size = 1408MB

work_mem = 9MB

wal_buffers = 16MB

checkpoint_segments = 32

shared_buffers = 480MB

But the new one is much more easier and way convenient since you can just access via browser. Just go to https://pgtune.leopard.in.ua/. A good example is like below:

All you need to do is specify the following fields below:

  • DB version - the version of your PostgreSQL. It supports versions of PostgreSQL from 9.2, 9.3, 9.4, 9.5, 9.6, 10, 11, and 12.
  • OS Type- the type of OS (Linux, OS X, Windows)
  • DB Type - the database type which is mainly what kind of transactional processing your database will handle (Web Application, OLTP, Data Warehousing, Desktop Application, Mixed Type of Applications)
  • Total Memory (RAM) - The total memory that your PG instance will handle. Need to specify it in GiB.
  • Number of CPUs- Number of CPUs, which PostgreSQL can use CPUs = threads per core * cores per socket * sockets
  • Number of Connections - Maximum number of PostgreSQL client connections
  • Data Storage- Type of data storage device which you can choose from SSD, HDD, or SAN based storage.

Then hit the Generate button. Alternatively, you can also run ALTER SYSTEM statement which generates postgresql.auto.conf, but it won't take until you hit a PostgreSQL restart.

How Does It Sets The Values

The algorithm for this tool can be basically found here in configuration.js. It does share the same algorithm from the old PGTune starting here pgtune#L477. For example, versions of PostgreSQL < 9.5 supports checkpoint_segments, but PG >= 9.5 uses the min_wal_size and max_wal_size. 

Setting the checkpoint_segments or min_wal_size/max_wal_size depends on what type of PostgreSQL version and the DB type of database application transaction. See how in the snippet below:

if (dbVersion < 9.5) {

  return [

    {

      key: 'checkpoint_segments',

      value: ({

        [DB_TYPE_WEB]: 32,

        [DB_TYPE_OLTP]: 64,

        [DB_TYPE_DW]: 128,

        [DB_TYPE_DESKTOP]: 3,

        [DB_TYPE_MIXED]: 32

      }[dbType])

    }

  ]

} else {

  return [

    {

      key: 'min_wal_size',

      value: ({

        [DB_TYPE_WEB]: (1024 * SIZE_UNIT_MAP['MB'] / SIZE_UNIT_MAP['KB']),

        [DB_TYPE_OLTP]: (2048 * SIZE_UNIT_MAP['MB'] / SIZE_UNIT_MAP['KB']),

        [DB_TYPE_DW]: (4096 * SIZE_UNIT_MAP['MB'] / SIZE_UNIT_MAP['KB']),

        [DB_TYPE_DESKTOP]: (100 * SIZE_UNIT_MAP['MB'] / SIZE_UNIT_MAP['KB']),

        [DB_TYPE_MIXED]: (1024 * SIZE_UNIT_MAP['MB'] / SIZE_UNIT_MAP['KB'])

      }[dbType])

    },

    {

      key: 'max_wal_size',

      value: ({

        [DB_TYPE_WEB]: (4096 * SIZE_UNIT_MAP['MB'] / SIZE_UNIT_MAP['KB']),

        [DB_TYPE_OLTP]: (8192 * SIZE_UNIT_MAP['MB'] / SIZE_UNIT_MAP['KB']),

        [DB_TYPE_DW]: (16384 * SIZE_UNIT_MAP['MB'] / SIZE_UNIT_MAP['KB']),

        [DB_TYPE_DESKTOP]: (2048 * SIZE_UNIT_MAP['MB'] / SIZE_UNIT_MAP['KB']),

        [DB_TYPE_MIXED]: (4096 * SIZE_UNIT_MAP['MB'] / SIZE_UNIT_MAP['KB'])

      }[dbType])

    }

  ]

}

Just to explain short, it detects if dbVersion < 9.5, then it determines the suggested values for variables checkpoint_segments or min_wal_size/max_wal_size based on the type of dbType value set during the web UI form.

Basically, you can learn more about the algorithm on how it decides to suggest the values by looking at this script configuration.js.

PostgreSQL Configuration Tuning with ClusterControl

If you are using ClusterControl to create, build, or import a cluster, it automatically does an initial tuning based on the given hardware specs. For example, creating a cluster with the following job specs below,

{

  "command": "create_cluster",

  "group_id": 1,

  "group_name": "admins",

  "job_data": {

    "api_id": 1,

    "cluster_name": "pg_11",

    "cluster_type": "postgresql_single",

    "company_id": "1",

    "datadir": "/var/lib/postgresql/11/",

    "db_password": "dbapgadmin",

    "db_user": "dbapgadmin",

    "disable_firewall": true,

    "disable_selinux": true,

    "generate_token": true,

    "install_software": true,

    "nodes": [

      {

        "hostname": "192.168.30.40",

        "hostname_data": "192.168.30.40",

        "hostname_internal": "",

        "port": "5432"

      },

      {

        "hostname": "192.168.30.50",

        "hostname_data": "192.168.30.50",

        "hostname_internal": "",

        "port": "5432",

        "synchronous": false

      }

    ],

    "port": "5432",

    "ssh_keyfile": "/home/vagrant/.ssh/id_rsa",

    "ssh_port": "22",

    "ssh_user": "vagrant",

    "sudo_password": "",

    "user_id": 1,

    "vendor": "default",

    "version": "11"

  },

  "user_id": 1,

  "user_name": "paul@severalnines.com"

}

Provides me the following tuning as shown below:

[root@ccnode ~]# s9s job --log  --job-id 84919 | sed -n '/stat_statements/,/Writing/p'

192.168.30.40:5432: Enabling stat_statements plugin.

192.168.30.40:5432: Setting wal options.

192.168.30.40:5432: Performance tuning.

192.168.30.40: Detected memory: 1999MB.

192.168.30.40:5432: Selected workload type: mixed

Using the following fine-tuning options:

  checkpoint_completion_target: 0.9

  effective_cache_size: 1535985kB

  maintenance_work_mem: 127998kB

  max_connections: 100

  shared_buffers: 511995kB

  wal_keep_segments: 32

  work_mem: 10239kB

Writing file '192.168.30.40:/etc/postgresql/11/main/postgresql.conf'.

192.168.30.50:5432: Enabling stat_statements plugin.

192.168.30.50:5432: Setting wal options.

192.168.30.50:5432: Performance tuning.

192.168.30.50: Detected memory: 1999MB.

192.168.30.50:5432: Selected workload type: mixed

Using the following fine-tuning options:

  checkpoint_completion_target: 0.9

  effective_cache_size: 1535985kB

  maintenance_work_mem: 127998kB

  max_connections: 100

  shared_buffers: 511995kB

  wal_keep_segments: 32

  work_mem: 10239kB

Writing file '192.168.30.50:/etc/postgresql/11/main/postgresql.conf'.

Additionally, it also tunes up your system or kernel parameters such as,

192.168.30.50:5432: Tuning OS parameters.

192.168.30.50:5432: Setting vm.swappiness = 1.

Conclusion

The ClusterControl tuning parameters are also based on the algorithm shared in pgtune#L477. It's not fancy, but you can change it to whatever values you would like. With these setting values, it allows you to have a raw start which is ready enough to handle a production load based on the initial given values.

pgDash Alternatives - PostgreSQL Database Monitoring with ClusterControl

$
0
0

Database monitoring and alerting is a particularly important part of database operations, as we must understand the current state of the database. If you don’t have good database monitoring in place, you will not be able to find problems in the database quickly. This could then result in downtime. 

One tool available for monitoring is pgDash, a SaaS application for monitoring and alerting for the PostgreSQL database. 

pgDash Installation Procedure

Registration for pgDash can be done via the website or can also be downloaded (self-hosted) as provided by RapidLoop.

The installation process of pgDash is simple, we just need to download the package needed from pgDash to be configured on the host / database server side. 

You can run the process as follow:

[postgres@n5 ~]$ curl -O -L https://github.com/rapidloop/pgmetrics/releases/download/v1.9.0/pgmetrics_1.9.0_linux_amd64.tar.gz

  % Total    % Received % Xferd  Average Speed   Time    Time     Time  Current

                                 Dload  Upload   Total   Spent    Left  Speed

100   647  100   647    0     0    965      0 --:--:-- --:--:-- --:--:--   964

100 3576k  100 3576k    0     0   189k      0  0:00:18  0:00:18 --:--:--  345k

[postgres@n5 ~]$ tar xvf pgmetrics_1.9.0_linux_amd64.tar.gz

pgmetrics_1.9.0_linux_amd64/LICENSE

pgmetrics_1.9.0_linux_amd64/README.md

pgmetrics_1.9.0_linux_amd64/pgmetrics

[postgres@n5 ~]$ curl -O -L https://github.com/rapidloop/pgdash/releases/download/v1.5.1/pgdash_1.5.1_linux_amd64.tar.gz

  % Total    % Received % Xferd  Average Speed   Time    Time     Time  Current

                                 Dload  Upload   Total   Spent    Left  Speed

100   644  100   644    0     0   1370      0 --:--:-- --:--:-- --:--:--  1367

100 2314k  100 2314k    0     0   361k      0  0:00:06  0:00:06 --:--:--  560k

[postgres@n5 ~]$ tar xvf pgdash_1.5.1_linux_amd64.tar.gz

pgdash_1.5.1_linux_amd64/LICENSE

pgdash_1.5.1_linux_amd64/README.md

pgdash_1.5.1_linux_amd64/pgdash

[postgres@n5 ~]$ ./pgmetrics_1.9.0_linux_amd64/pgmetrics --no-password -f json ccdb | ./pgdash_1.5.1_linux_amd64/pgdash -a NrxaHk3JH2ztLI06qQlA4o report myserver1

Apart from pgDash you will need another package, pgmetrics, to be installed for monitoring.  pgmetrics is an open source utility whose job is to collect information and statistics in the database needed by pgDash, while the job of pgdash is to send that information to the dashboard. 

If you want to add more databases to the monitoring platform, you would need to repeat the above process for each database.

Although the installation of pgDash is simple, there are repetitive processes that can become a concern if there are additional databases that need to be monitored. You will most likely need to make an automation script for that.

pgDash Metrics

There are 3 main features under pgDash Dashboard, those are: 

  • Dashboard: consists of sub-menus such as: Overview, Database, Queries, Backend, Locks, Tablespace, Replication, WAL Files, BG Writers, Vacuum, Roles, Configuration.
  • Tools: consists of sub-menus, such as Index Management, Tablespace Management, Diagnostics, and Top-K. 
  • Alerts: consist of sub-menus such as Alerts & Change Alerts.

PostgreSQL Monitoring by ClusterControl 

Monitoring conducted by ClusterControl uses the ssh method and direct connection from the controller node to the target database node in gathering information needed to be displayed on the dashboard.

ClusterControl also has an Agent Based Monitoring feature that can easily be activated. You can see it below...

ClusterControl will then carry out the prometheus installation process, node exporters, and PostgreSQL exporters, in the targeted database that aims to gather and to collect information required by the dashboard to display metrics.

If Agent Based Monitoring is active, any new target database will be automatically added and monitored by Agent Based Monitoring.

ClusterControl Dashboards

Here you can see information in the PostgreSQL Cluster Overview and System Information screens. In this function you can see detailed information such as db version, transaction ID, Last Checkpoint and Date and Time when the server is alive. This information is depicted below:

In System Information page, we can get the information such as Load Average, Memory Usage, Swap Usage, see the picture below:

  • Database: you can get the information such as db name, db size, number of tables, index and also tablespace.
  • Queries: you can monitor Calls, Disk Write, Disk Read, Buffer Hit from queries. Also, you can search any query that runs within a specific time period.
  • Backend: you can monitor current state of database backend, within this information, critical details are provided, such as backends waiting for the locks, other waiting backends, transaction open too long, backend idling in transaction. You can also see all the backends that run in the database.
  • Locks: You can check the number of total locks, locks not granted, and blocked queries. 
  • Tablespace: provides information related to tablespace, ie. tablespace size, usage of Disk and Inodes.
  • Replications: you can monitor your Replication status in PostgreSQL database, start from Replication Slot, Incoming Replication, Outgoing Replication, Replication Publications, and Replication Subscriptions.
  • Wal Files: provides information related to WAL (Write Ahead Log) and also statistics eg:  WAL File Counts, WAL Generation Rate, WAL Files Generated Each Hours. 
  • BG Writers: provides information related to checkpoint database, buffer written, and parameters related to the Background Writer. 
  • Vacuum Progress: contains information related to the Vacuum which runs in the database, also vacuum parameters. 
  • Roles: contains information related to the roles which exist in the database including privileges.
  • Configuration: contains parameters in database PostgreSQL.

Inside Tools, there are sub-menus such as Index Management that provided information ie. Unused Index, Bloat Index, dan Index with Low Cache Hit Ratio. Tablespace Management provides information related to Tablespace dan other objects available under.

Diagnostics, to understand the potential issues that may occur through Top 10 Most Bloated Tables, Top 10 Most Bloated Indexes, List of Inactive Replication Slots, Top 10 Longest Running Transactions, etc.

ClusterControl has several metrics under separated menu, those are Overview,  Nodes, Dashboard, Query Monitor, and Performance, see picture below :

When Agent Based Monitoring is enabled, hence all of the information related to statistics and other information related to the database will be stored in a time series database (prometheus). You can see those information in ClusterControl as depicted below :

In the Query Monitor, you can find Top Queries, Running Queries, Query Outliers, or Query Statistics menus. They provide information related to running query, top query, and statistics of the database. You can also configure slow queries and non-indexing queries. 

On Performance, there are sub-menus such as DB Growth that can show information of database and table size statistics. Schema Analyzer provides information related to Redundant Index and Table without primary key.

PostgreSQL Alerting

There are two parts of alerting...

  • Alert Rules: alert rules play a major role, you can define limits as parameters that can trigger alarm to the DBA. 
  • Third Party Integration: is an integration channel to the incident management platform for communication and collaboration such as: PagerDuty, OpsGenie, Slack, or via Email.

PgDash has many options of database parameters you can set related to the alert rule, divided in several layers starting from Server, Database, Table, Index, Tablespace, and Query. You can see those information in pgDash as depicted below...

As for the third party integration channel, pgDash has support for several channels such as Slack, Pagerduty, VictorOps, Xmatters, e-mail, or making their own webhooks so they can be consumed by other services.

The following is the appearance of the Third party Integration of pgDash :

In contrast to pgDash, ClusterControl has a broader and more general event alert option, starting with alerts related to the host, network, cluster, and database itself. The following are examples of event options that can be selected :

ClusterControl can select several database clusters in one event alert. Third party integration from ClusterControl supports several incident management and communication / collaboration tools such as PagerDuty, VictorOps, Telegram, OpsGenie, Slack, ServiceNow, or can create your own webhook. 

In the alert rules section, both pgDash and ClusterControl have advantages and disadvantages. The advantage of pgDash is that you can set very detailed database alerts related to what will be sent, while the drawback is that you have to do these settings in each database (although there is a feature to import from other database configurations.

ClusterControl lacks detailed event alerts, only general database events, but ClusterControl can send alerts not only related to the database, but can send event alerts from nodes, clusters, networks, etc. Besides that you can set these alerts for several database clusters.

In the Third party Integration section, pgDash and ClusterControl both have support for various third party incident management and communication channels. Infact both of them can make their own webhook so that it can be consumed by other services (eg. Grafana).

MySQL Workbench Alternatives - ClusterControl Configuration Management

$
0
0

MySQL configuration management consists of two major components - MySQL configuration files and runtime configuration. Applying configuration changes on the runtime environment can be done through MySQL server clients with no privilege for session variables but SUPER privileges for global variables. Applying the same configuration changes into MySQL configuration file is also necessary to make the changes persistent across MySQL restarts, otherwise the default values will get loaded during the startup.

In this blog post, we are going to look at ClusterControl Configuration Management as an alternative to MySQL Workbench configuration management.

MySQL Workbench Configuration Management

MySQL Workbench is a graphical client for working with MySQL servers and databases for server versions 5.x and higher. It is freely available and commonly being used by SysAdmins, DBAs and developers to perform SQL development, data modelling, MySQL server administration and data migration.

You can use MySQL Workbench to perform MySQL/MariaDB configuration management on a remote MySQL server. However, there are some initial steps required to enable this feature. From MySQL Workbench, select an existing connection profile and choose Configure Remote Management. You will be presented with a step-by-step configuration wizard to help you to set up remote management for the connection profile:

At the start, a connection attempt is made to determine the server version and operating system of the target machine. This allows connection settings to be validated and allows the wizard to pick a meaningful configuration preset. If this attempt fails you can still continue to the next step, where you can customize the settings further to suit the remote server environment.

Once the remote connection configuration is complete, double clicks on the connection profile to start connecting to the MySQL instance. Then, go to the Instance -> Options File to open the configuration manager section. You should see something similar to the following screenshot:

All existing configuration variables from the configuration file are pre-loaded into this configuration manager so you can see what options have been enabled with its respective values. Configurations are categorized to a number of sections - General, logging, InnoDB, networking and so on - which really helps us focus on specific features that we want to tweak or enable.

Once you are satisfied with the changes, and before clicking "Apply", make sure you choose the correct MySQL group section from the dropdown menu (right next to the Discard button). Once applied, you should see the configuration is applied to the MySQL server where a new line will appear (if it didn't exist) in the MySQL configuration file.

Note that clicking on the "Apply" button will not push the corresponding change into MySQL runtime. One has to perform restart operation on the MySQL server to load the new configuration changes by going to Instance -> Startup/Shutdown. This will take a hit on your database uptime.

To see all the loaded system status and variables, go to Management -> Status and System Variables:

ClusterControl Configuration Management

ClusterControl Configuration Manager can be accessed under Manage -> Configurations. ClusterControl pulls a number of important configuration files and displays them in a tree structure. A centralized view of these files is key to efficiently understanding and troubleshooting distributed database setups. The following screenshot shows ClusterControl's configuration file manager which listed out all related configuration files for this cluster in one single view with syntax highlighting:

As you can see from the screenshot above, ClusterControl understands MySQL"!include" parameter and will follow through all configuration files associated with it. For instance, there are two MySQL configuration files being pulled from host 192.168.0.21, /etc/my.cnf and /etc/my.cnf.d/secrets-backup.cnf. You can open multiple configuration files in another editor tab which make it easier to compare the content side-by-side. ClusterControl also pulls the last file modification information from the OS timestamp, as shown at the bottom right of the text editor.

ClusterControl eliminates the repetitiveness when changing a configuration option of a database cluster. Changing a configuration option on multiple nodes can be performed via a single interface and will be applied to the database node accordingly. When you click on "Change/Set Parameter", you can select the database instances that you would want to change and specify the configuration group, parameter and value:

You can add a new parameter into the configuration file or modify an existing parameter. The parameter will be applied to the chosen database nodes' runtime and into the configuration file if the option passes the variable validation process. Some variables might require a follow-up step like server restart or configuration reload, which will then be advised by ClusterControl.

All services configured by ClusterControl use a base configuration template available under /usr/share/cmon/templates on the ClusterControl node. You can directly modify the file to suit your deployment policy however, this directory will be replaced after a package upgrade. To make sure your custom configuration template files persist across upgrades, store your template files under /etc/cmon/templates directory. When ClusterControl loads up the template file for deployment, files under /etc/cmon/templates will always have higher priority over the files under /usr/share/cmon/templates. If two files having identical names exist on both directories, the one located under /etc/cmon/templates will be used.

Go to Performance -> DB Variables to check the runtime configuration for all servers in the cluster:

Notice a line highlighted in red in the screenshot above? That means the configuration is not identical in all nodes. This provides more visibility on the configuration difference among hosts in a particular database cluster.

Workbench v ClusterControl: Advantages and Disadvantages

Every product has its own set of advantages and disadvantages. For ClusterControl, since it understands cluster and topology, it's the best configuration manager to manage multiple database nodes at once. It supports multiple MySQL vendors like MariaDB, Percona as well as all Galera Cluster variants. It also understands database load balancer configuration format for HAProxy, MariaDB MaxScale, ProxySQL and Keepalived. Since ClusterControl requires passwordless SSH configuration at the beginning of importing/deploying the cluster, configuration management requires no remote setup like Workbench and it works out-of-the-box after the hosts are managed by ClusterControl. MySQL configuration changes performed by ClusterControl will be loaded into runtime automatically (for all supported variables) as well as written into MySQL configuration files for persistence. In terms of disadvantages, ClusterControl configuration management does not come with configuration descriptions which could help us anticipate what would happen if we changed the configuration option. It does not support all platforms that MySQL can run, particularly only certain Linux distributions like CentOS, RHEL, Debian and Ubuntu.

MySQL Workbench supports remote management of many operating systems like Windows, FreeBSD, MacOS, Open Solaris and Linux. MySQL Workbench is available for free and can also be used with other MySQL vendors like Percona and MariaDB (despite not listed here, it does work with some older MariaDB versions). It also supports managing installation from the TAR bundle. It allows some customizations on configuration file path, service/stop commands and MySQL group sections naming. One of the neat features is that MySQL Workbench uses dropdown menu for fixed values, which can be a huge help in reducing the risk of misconfiguration from a user, as shown in the following screenshot:

On the downside, MySQL Workbench does not support multiple host configuration management where you have to perform the config change on every host separately. It also does not push the configuration changes into runtime, without explicit MySQL restart which can compromise the database service uptime.

The following table simplifies the significant differences taken from the all the mentioned points:

Configuration Aspect

MySQL Workbench

ClusterControl

Supported OS for MySQL server

  • Linux
  • Windows
  • FreeBSD
  • Open Solaris
  • Mac OS
  • Linux (Debian, Ubuntu, RHEL, CentOS)

MySQL vendor

  • Oracle
  • Percona
  • Oracle
  • Percona
  • MariaDB
  • Codership

Support other software

 
  • HAProxy
  • ProxySQL
  • MariaDB MaxScale
  • Keepalived

Configuration/Variable description

Yes

No

Config file syntax highlighting

No

Yes

Drop down configuration values

Yes

No

Multi-host configuration

No

Yes

Auto push configuration into runtime

No

Yes

Configuration templating

No

Yes

Cost

Free

Subscription required for configuration management

We hope this blog post will help you out in determining which tool is suitable to manage your MySQL servers' configurations. You can also try our new Configuration Files Management tool (currently in alpha)

NoSQL Data Streaming with MongoDB & Kafka

$
0
0

Developers describe Kafka as a "Distributed, fault-tolerant, high throughput, pub-sub, messaging system." Kafka is well-known as a partitioned, distributed, and replicated commit log service. It also provides the functionality of a messaging system, but with a unique design. On the other hand, MongoDB is known as "The database for giant ideas." MongoDB is capable of storing data in JSON-like documents that can vary in structure, offering a dynamic, flexible schema. MongoDB is designed for high availability and scalability, with built-in replication and auto-sharding.

MongoDB is classified under "Databases", while Kafka belongs to the "Message Queue" category of the tech stack. Developers consider Kafka "High-throughput", "Distributed" and "Scalable" as the key factors; whereas "Document-oriented storage", "No SQL" and "Ease of use" is considered as the primary reasons why MongoDB is favored.

Data Streaming in Kafka

In today’s data ecosystem, there is no single system that can provide all of the required perspectives to deliver real insight of the data. Deriving better visualization of data insights from data requires mixing a huge volume of information from multiple data sources. As such, we are eager to get answers immediately; if the time taken to analyze data insights exceeds 10s of milliseconds, then the value is lost or irrelevant. Applications such as fraud detection, high-frequency trading, and recommendation engines cannot afford to wait. This operation also is known as analyzing the inflow of data before it gets updated as the database of record with zero tolerance for data loss, and the challenge gets even more daunting.

Kafka helps you ingest and quickly move reliably large amounts of data from multiple data sources and then redirect it to the systems that need it by filtering, aggregating, and analyzing en-route. Kafka has a higher throughput, reliability, and replication characteristics, a scalable method to communicate streams of event data from one or more Kafka producers to one or more Kafka consumers. Examples of events include:

  • Air pollution data captured based on periodical basis
  • A consumer adding an item to the shopping cart in an online store
  • A Tweet posted with a specific hashtag

Streams of Kafka events are captured and organized into predefined topics. The Kafka producer chooses a topic to send a given event to, and consumers select which topics they pull events from. For example, a stock market financial application could pull stock trades from one topic and company financial information from another in order to look for trading opportunities.

MongoDB and Kafka collaboration make up the heart of many modern data architectures today. Kafka is designed for boundless streams of data that sequentially write events into commit logs, allowing real-time data movement between MongoDB and Kafka done through the use of Kafka Connect.

Figure1: MongoDB and Kafka working together

The official MongoDB Connector for Kafka was developed and is supported by MongoDB Inc. engineers. It is also verified by Confluent (who pioneered the enterprise-ready event streaming platform), conforming to the guidelines which were set forth by Confluent’s Verified Integrations Program. The connector enables MongoDB to be configured as both a sink and a source for Kafka. Easily build robust, reactive data pipelines that stream events between applications and services in real-time.

Figure 2: Connector enables MongoDB configured as both a sink and a source for Kafka.

MongoDB Sink Connector

The MongoDB Sink allows us to write events from Kafka to our MongoDB instance. The Sink connector converts the value from the Kafka Connect SinkRecords into a MongoDB Document and will do an insert or upsert depending on the configuration you chose. It expected the database created upfront, the targeted MongoDB collections created if they don’t exist.

MongoDB Kafka Source Connector

The MongoDB Kafka Source Connector moves data from a MongoDB replica set into a Kafka cluster. The connector configures and consumes change stream event documents and publishes them to a topic. Change streams, a feature introduced in MongoDB 3.6, generate event documents that contain changes to data stored in MongoDB in real-time and provide guarantees of durability, security, and idempotency. You can configure change streams to observe changes at the collection, database, or deployment level. It uses the following settings to create change streams and customize the output to save to the Kafka cluster.  It will publish the changed data events to a Kafka topic that consists of the database and collection name from which the change originated.

 MongoDB & Kafka Use Cases

eCommerce Websites

Use case of an eCommerce website whereby the inventory data is stored into MongoDB. When the stock inventory of the product goes below a certain threshold, the company would like to place an automatic order to increase the stock. The ordering process is done by other systems outside of MongoDB, and using Kafka as the platform for such event-driven systems are a great example of the power of MongoDB and Kafka when used together.

Website Activity Tracking

Site activity such as pages visited or adverts rendered are captured into Kafka topics – one topic per data type. Those topics can then be consumed by multiple functions such as monitoring, real-time analysis, or archiving for offline analysis. Insights from the data stored in an operational database such as MongoDB, where they can be analyzed alongside data from other sources.

Internet of Things (IoT)

IoT applications must cope with massive numbers of events that are generated by a multitude of devices. Kafka plays a vital role in providing the fan-in and real-time collection of all of that sensor data. A common use case is telematics, where diagnostics from a vehicle's sensors must be received and processed back at base. Once captured in Kafka topics, the data can be processed in multiple ways, including stream processing or Lambda architectures. It is also likely to be stored in an operational database such as MongoDB, where it can be combined with other stored data to perform real-time analytics and support operational applications such as triggering personalized offers.

Conclusion

MongoDB is well-known as non-relational databases, which published under a free-and-open-source license, MongoDB is primarily a document-oriented database, intended for use with semi-structured data like text documents. It is the most popular modern database built for handling huge and massive volumes of heterogeneous data. 

Kafka is a widely popular distributed streaming platform that thousands of companies like New Relic, Uber, and Square use to build scalable, high-throughput, and reliable real-time streaming systems.  

Together MongoDB and Kafka play vital roles in our data ecosystem and many modern data architectures.

Viewing all 1259 articles
Browse latest View live


<script src="https://jsc.adskeeper.com/r/s/rssing.com.1596347.js" async> </script>