If you’re looking for a monitoring system, you probably read about many different options with different features and different costs based on these features.
Manage Engine Applications Manager is an application performance management solution that proactively monitors business applications and helps businesses ensure their revenue-critical applications meet end-user expectations.
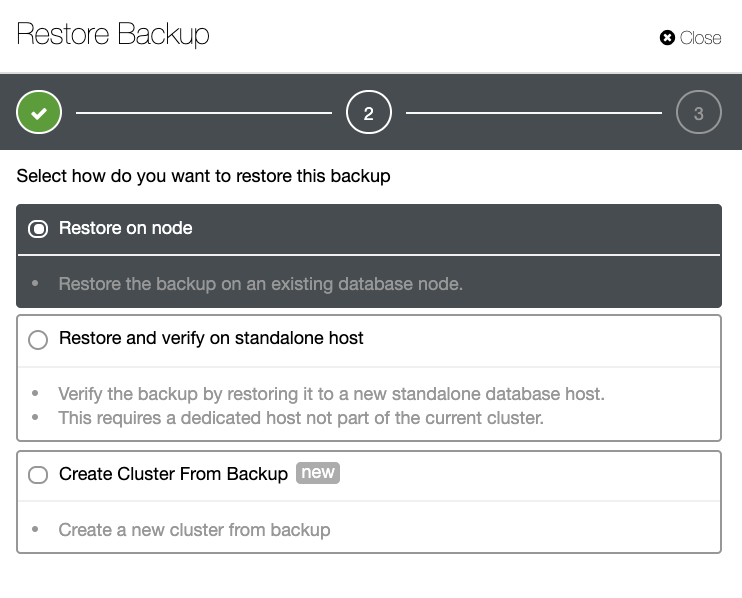
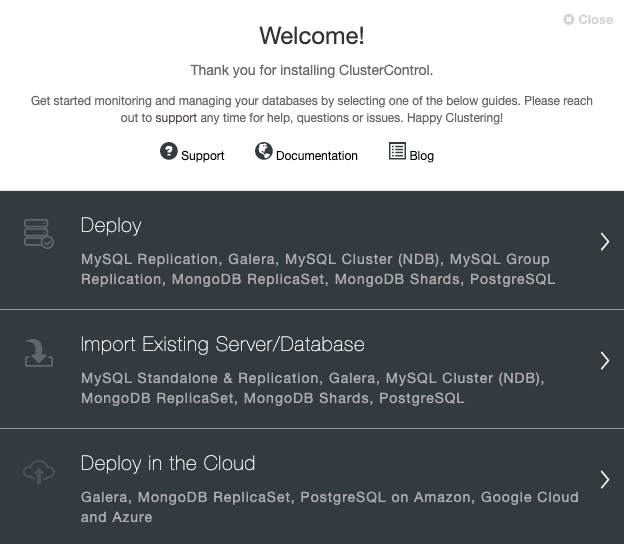
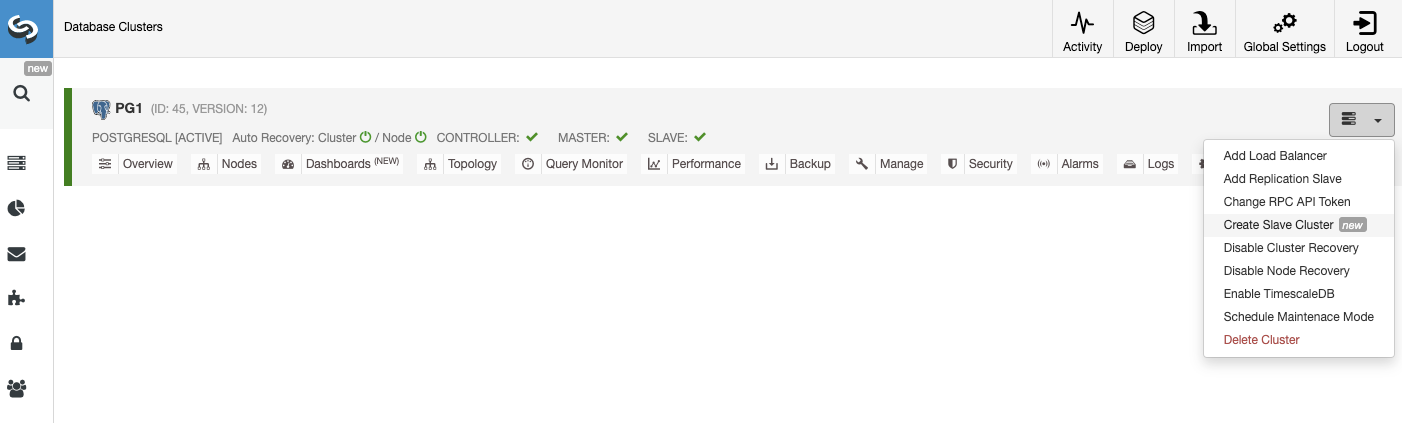
ClusterControl is an agentless management and automation software for database clusters. It helps deploy, monitor, manage, and scale your database server/cluster directly from the ClusterControl UI or using the ClusterControl CLI.
In this blog, we’ll take a look at some of the features of these products so you’ll be able to have an overview to help choose the correct one based on your requirements.
Database Monitoring Features Comparison
Manage Engine Applications Manager
There are three different versions of the product:
- Free: Supports monitoring up to 5 apps or servers
- Professional: Supports integrated performance monitoring for a heterogeneous set of applications
- Enterprise: Supports large deployments with its distributed monitoring capability
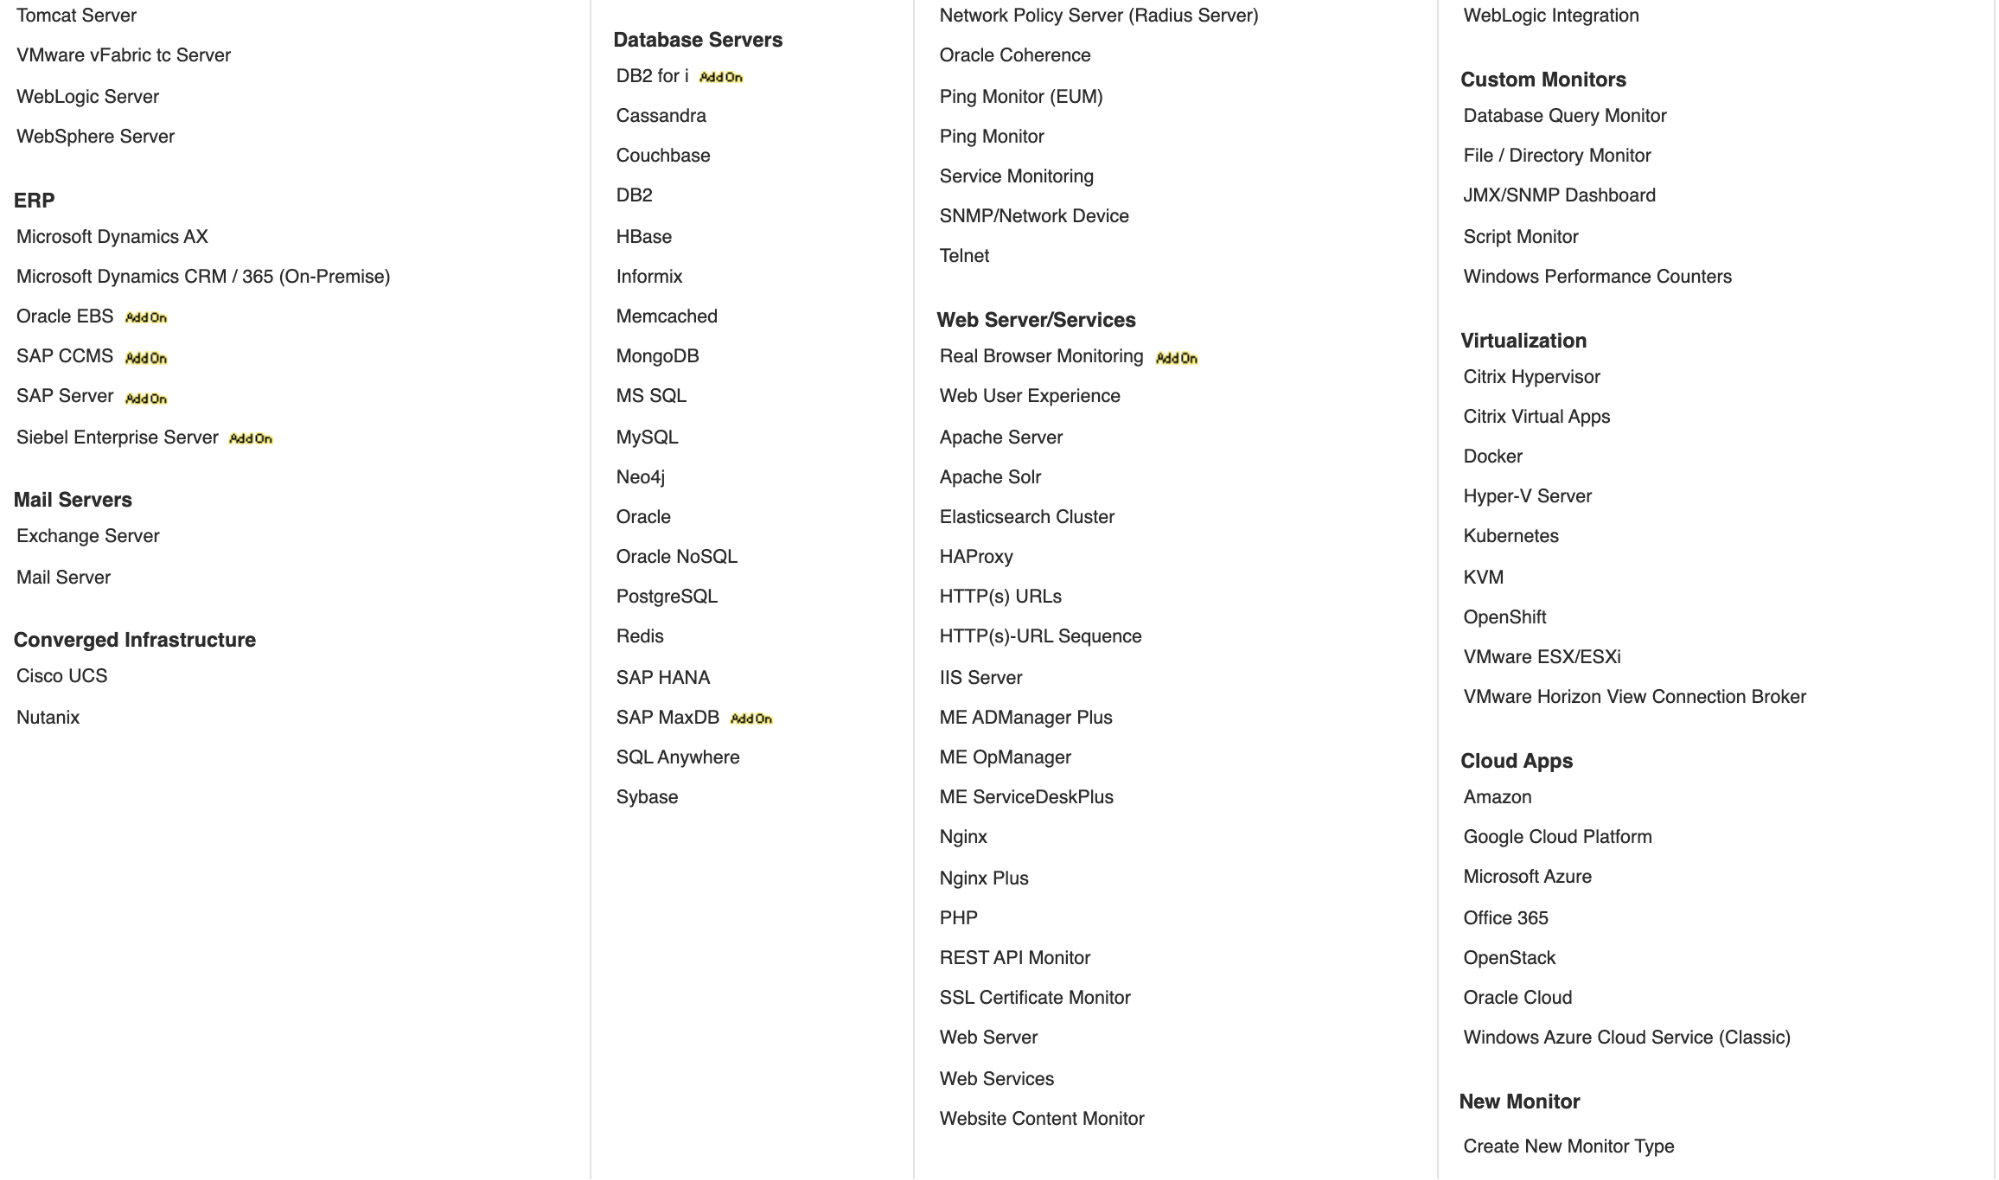
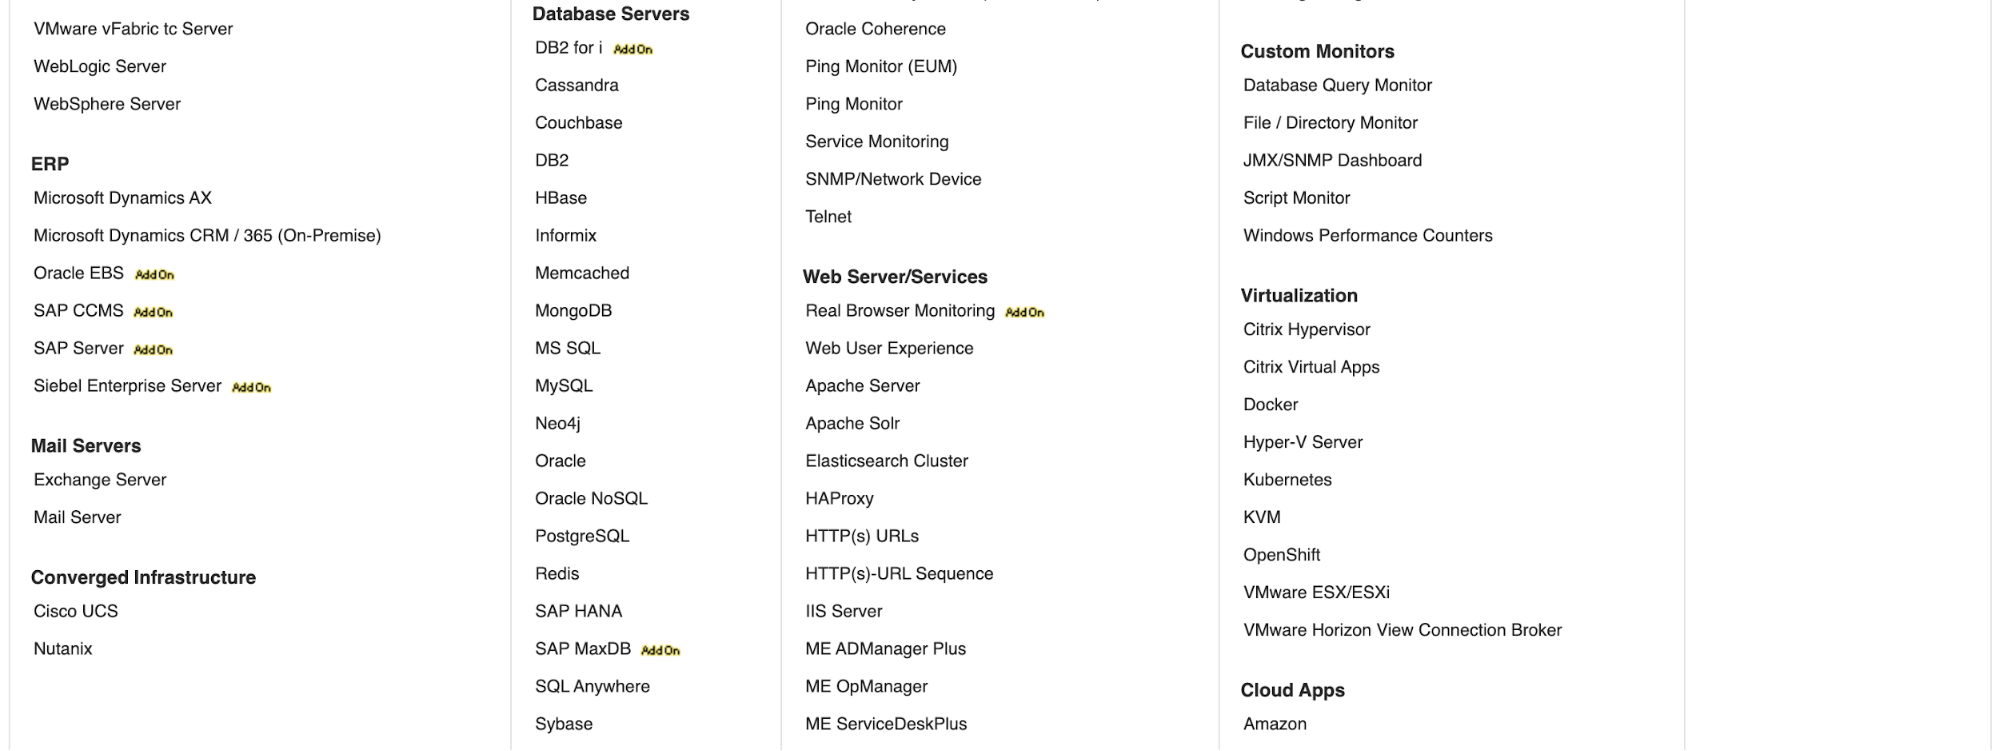
It can be installed on both Windows and Linux operating systems, and it can monitor not only Databases but also Applications, Mail Servers, Virtualization, and more.
ClusterControl
Like the previous one, there are three different versions of the product:
- Free Community: Great for deployment & monitoring. No limit on the number of servers but there is a limit on the available features
- Advanced: For high availability and scalability requirements
- Enterprise: With enterprise-grade and security features
It can be installed only on Linux operating systems, and it’s only for Database and Load Balancer servers.
The Installation Process
Manage Engine Applications Manager Installation Process
The installation process can be hard for a standard user, as the documentation doesn’t have a step-by-step guide and it’s not clear about the packages required.
Let’s see an example of this installation on CentOS 8.
It’s not mentioned in the documentation (at least I didn’t find it), but it requires the following packages: tar, unzip, and hostname. You need to install it for you own, otherwise, as the installer won’t install it, you’ll receive an error message like:
/opt/ManageEngine_ApplicationsManager_64bit.bin: line 686: tar: command not foundThen, you need to run the installer with the ”-i console” flag using a privileged user (non-root):
$ sudo /opt/ManageEngine_ApplicationsManager_64bit.bin -i consoleDuring the installation process, you can choose the Professional or Enterprise edition for your trial period. After your 30-day free trial ends, your installation will automatically convert to the free edition unless you have a commercial license:
===============================================================================

Edition Selection

-----------------

  ->1- Professional Edition

    2- Enterprise Edition(Distributed Setup)

    3- Free Edition

ENTER THE NUMBER FOR YOUR CHOICE, OR PRESS <ENTER> TO ACCEPT THE DEFAULT::
It supports different languages that you can choose here:
===============================================================================

Language Selection

------------------

  ->1- English

    2- Simplified Chinese

    3- Japanese

    4- Vietnamese

    5- French

    6- German

    7- European Spanish

    8- korean

    9- Hungarian

   10- Traditional Chinese

ENTER THE NUMBER FOR YOUR CHOICE, OR PRESS <ENTER> TO ACCEPT THE DEFAULT::
You can also add a license (if you have one), specify the web server and SSL port, local database (for this it supports PostgreSQL or Microsoft SQL Server), installation path, and if you want to register for technical support. You’ll see a summary before starting the installation process:
===============================================================================

Pre-Installation Summary

------------------------

Please Review the Following Before Continuing:

Product Name:

    ManageEngine Applications Manager14

Install Folder:

    /opt/ManageEngine/AppManager14

Link Folder:

    /root

Type Of Installation:

    PROFESSIONAL EDITION

DB Back-end :

    pgsql

Web Server Port :

    "9090"

Disk Space Information (for Installation Target):

    Required:  549,437,924 Bytes

    Available: 13,418,307,584 Bytes

PRESS <ENTER> TO CONTINUE:
When you receive the “Installation Complete” message, you’ll be ready to start it running the “startApplicationsManager.sh” script located in the installation path:
$ cd /opt/ManageEngine/AppManager14

$ sudo ./startApplicationsManager.sh

##########################################################################

 Note:It is recommended to start the product in nohup mode.

 Usage : nohup sh startApplicationsManager.sh &

##########################################################################

AppManager Info: Temporary image files are removed

This evaluation copy is valid for 29 days

[Tue May 05 01:28:31 UTC 2020] Starting Applications Manager "Primary" Server Modules, please wait ...

[Tue May 05 01:28:34 UTC 2020] Process : Site24x7IntegrationProcess [ Started ]

[Tue May 05 01:28:34 UTC 2020] Process : AMScriptProcess [ Started ]

[Tue May 05 01:28:35 UTC 2020] Process : AMExtProdIntegrationProcess [ Started ]

[Tue May 05 01:28:35 UTC 2020] Process : AuthMgr [ Started ]

[Tue May 05 01:28:35 UTC 2020] Process : AMDataCleanupProcess [ Started ]

[Tue May 05 01:28:35 UTC 2020] Process : DBUserStorageServer [ Started ]

[Tue May 05 01:28:35 UTC 2020] Process : NmsPolicyMgr [ Started ]

[Tue May 05 01:28:36 UTC 2020] Process : StartRelatedServices [ Started ]

[Tue May 05 01:28:36 UTC 2020] Process : AMUrlMonitorProcess [ Started ]

[Tue May 05 01:28:36 UTC 2020] Process : NMSMServer [ Started ]

[Tue May 05 01:28:36 UTC 2020] Process : NmsAuthManager [ Started ]

[Tue May 05 01:28:36 UTC 2020] Process : WSMProcess [ Started ]

[Tue May 05 01:28:38 UTC 2020] Process : APMTracker [ Started ]

[Tue May 05 01:28:38 UTC 2020] Process : RunJSPModule [ Started ]

[Tue May 05 01:28:38 UTC 2020] Process : StandaloneApplnProcess [ Started ]

[Tue May 05 01:28:38 UTC 2020] Process : AMRBMProcess [ Started ]

[Tue May 05 01:28:38 UTC 2020] Process : ApplnStandaloneBE [ Started ]

[Tue May 05 01:28:38 UTC 2020] Process : AMDistributionProcess [ Started ]

[Tue May 05 01:28:38 UTC 2020] Process : OAuthRefreshAccessToken [ Started ]

[Tue May 05 01:28:38 UTC 2020] Process : DiscoveryProcess [ Started ]

[Tue May 05 01:28:38 UTC 2020] Process : AMCAMProcess [ Started ]

[Tue May 05 01:28:39 UTC 2020] Process : NMSSAServer [ Started ]

[Tue May 05 01:28:39 UTC 2020] Process : AMServerStartUp [ Started ]

[Tue May 05 01:28:42 UTC 2020] Process : Collector [ Started ]

[Tue May 05 01:28:42 UTC 2020] Process : DBServer [ Started ]

[Tue May 05 01:28:43 UTC 2020] Process : MapServerBE [ Started ]

[Tue May 05 01:28:43 UTC 2020] Process : NmsConfigurationServer [ Started ]

[Tue May 05 01:28:44 UTC 2020] Process : AMFaultProcess [ Started ]

[Tue May 05 01:28:44 UTC 2020] Process : AMEventProcess [ Started ]

[Tue May 05 01:28:56 UTC 2020] Process : AMServerFramework [ Started ]

[Tue May 05 01:29:07 UTC 2020] Process : AMDataArchiverProcess [ Started ]

[Tue May 05 01:29:08 UTC 2020] Process : MonitorsAdder [ Started ]

[Tue May 05 01:29:11 UTC 2020] Process : EventFE [ Started ]

[Tue May 05 01:29:11 UTC 2020] Process : AlertFE [ Started ]

[Tue May 05 01:29:11 UTC 2020] Process : NmsMainFE [ Started ]

Verifying connection with web server... verified

Applications Manager started successfully.

Please connect your client to the web server on port: 9090
Now you can access the UI using the default user and password (admin/admin):
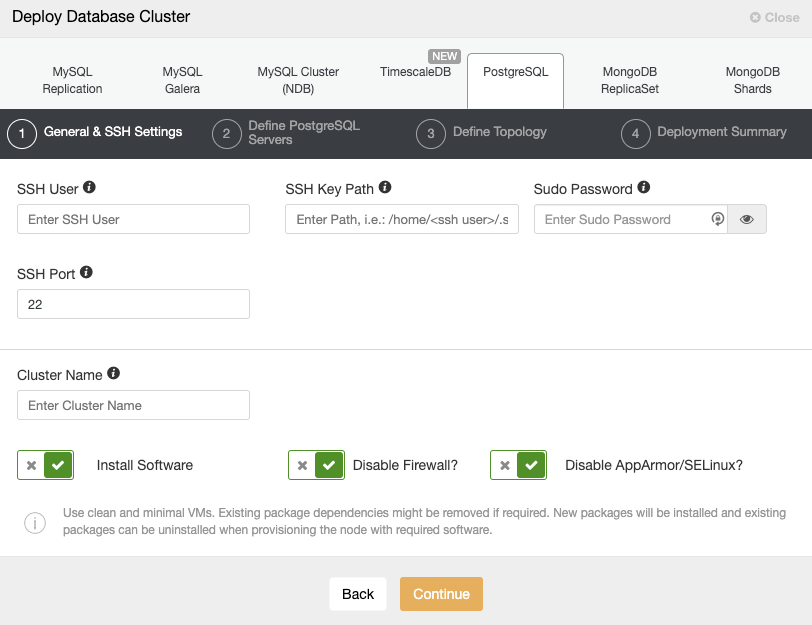
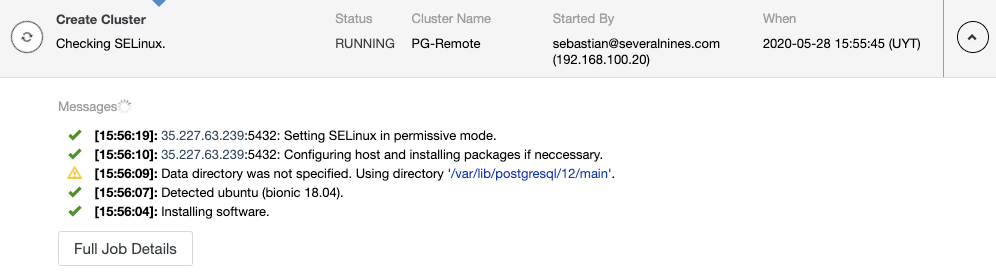
ClusterControl Installation Process
There are different installation methods as it’s mentioned in the documentation. In the case of a manual installation, the required packages are specified in the same documentation, and there is a step-by-step guide for all the process.
Let’s see an example of this installation on CentOS 8 using the automatic installation script.
$ wget http://www.severalnines.com/downloads/cmon/install-cc

$ chmod +x install-cc

$ sudo ./install-cc   # omit sudo if you run as root
The installation script will attempt to automate the following tasks:
- Install and configure a local MySQL server (used by ClusterControl to store monitoring data)
- Install and configure the ClusterControl controller package via package manager
- Install ClusterControl dependencies via package manager
- Configure Apache and SSL
- Configure ClusterControl API URL and token
- Configure ClusterControl Controller with minimal configuration options
- Enable the CMON service on boot and start it up
Running the mentioned script, you’ll receive a question about sending diagnostic data:
$ sudo ./install-cc

!!

Only RHEL/Centos 6.x|7.x|8.x, Debian 7.x|8.x|9.x|10.x, Ubuntu 14.04.x|16.04.x|18.04.x LTS versions are supported

Minimum system requirements: 2GB+ RAM, 2+ CPU cores

Server Memory: 1024M total, 922M free

MySQL innodb_buffer_pool_size set to 512M


Severalnines would like your help improving our installation process.

Information such as OS, memory and install success helps us improve how we onboard our users.

None of the collected information identifies you personally.

!!

=> Would you like to help us by sending diagnostics data for the installation? (Y/n):
Then, it’ll start installing the required packages. The next question is about the hostname that will be used:
=> The Controller hostname will be set to 192.168.100.131. Do you want to change it? (y/N):When the local database is installed, the installer will secure it creating a root password that you must enter:
=> Starting database. This may take a couple of minutes. Do NOT press any key.

Redirecting to /bin/systemctl start mariadb.service

=> Securing the MySQL Server ...

=> !! In order to complete the installation you need to set a MySQL root password !!

=> Supported special password characters: ~!@#$%^&*()_+{}<>?

=> Press any key to proceed ...
And a CMON user password, which will be used by ClusterControl:
=> Set a password for ClusterControl's MySQL user (cmon) [cmon]

=> Supported special characters: ~!@#$%^&*()_+{}<>?

=> Enter a CMON user password:
That’s it. In this way, you’ll have all in place without installing or configuring anything manually.
=> ClusterControl installation completed!
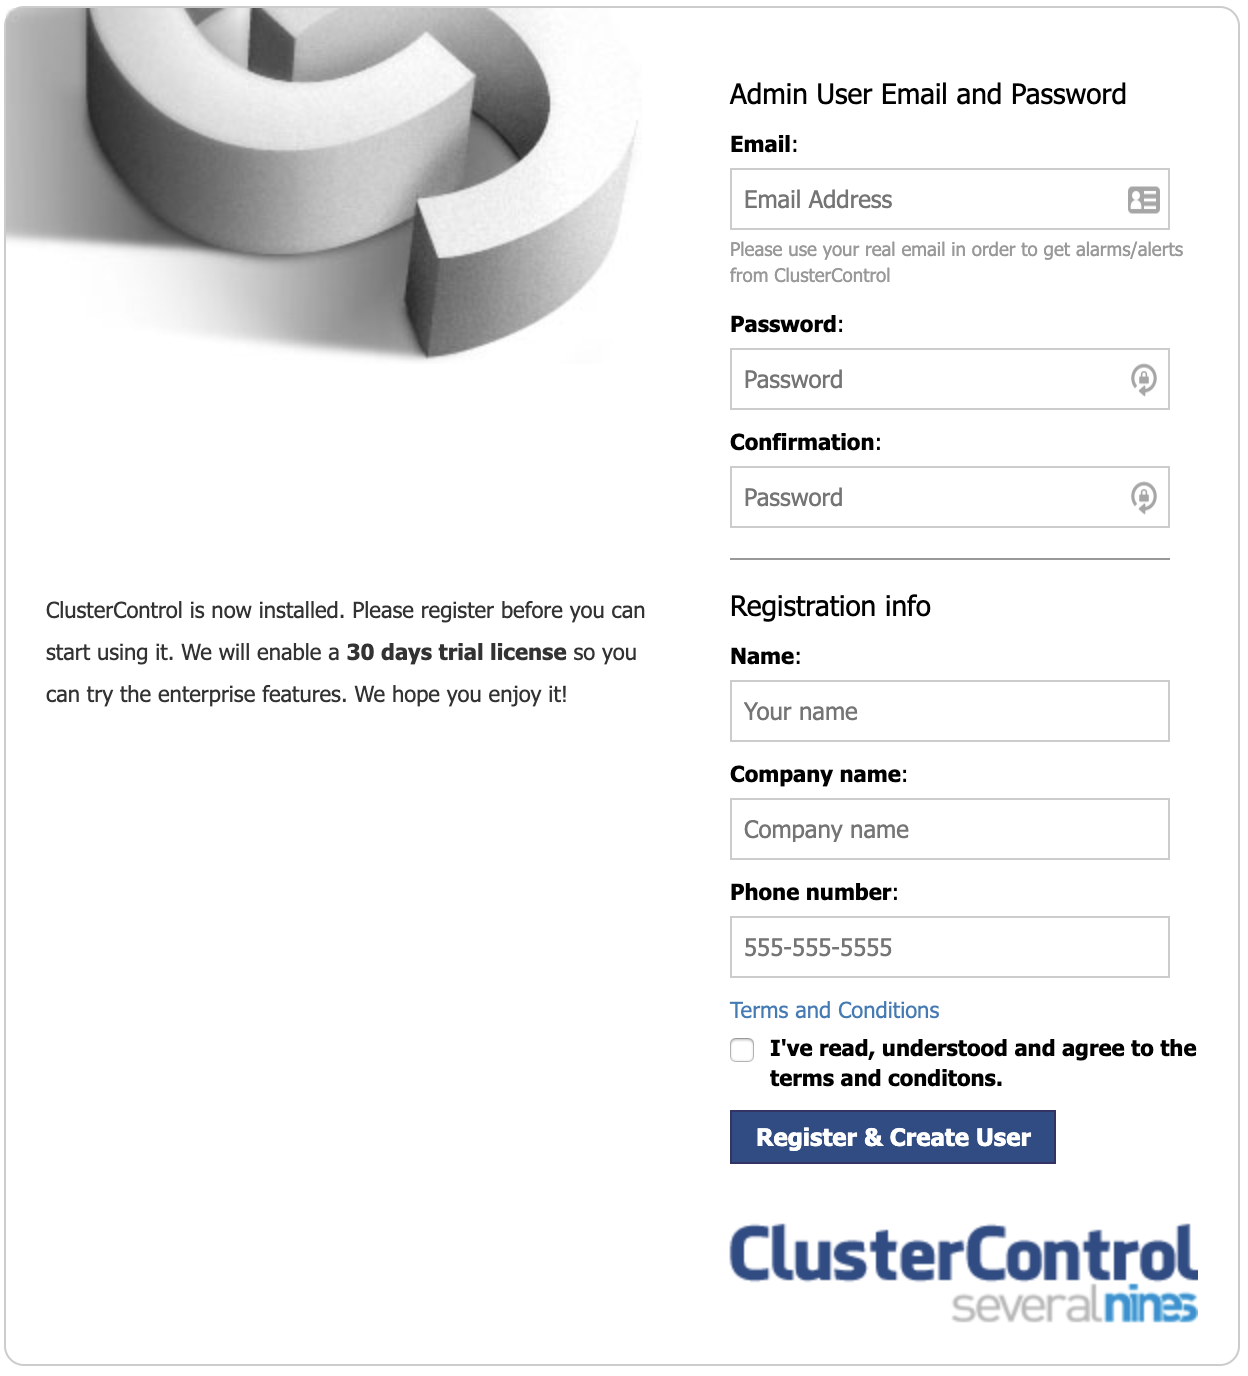
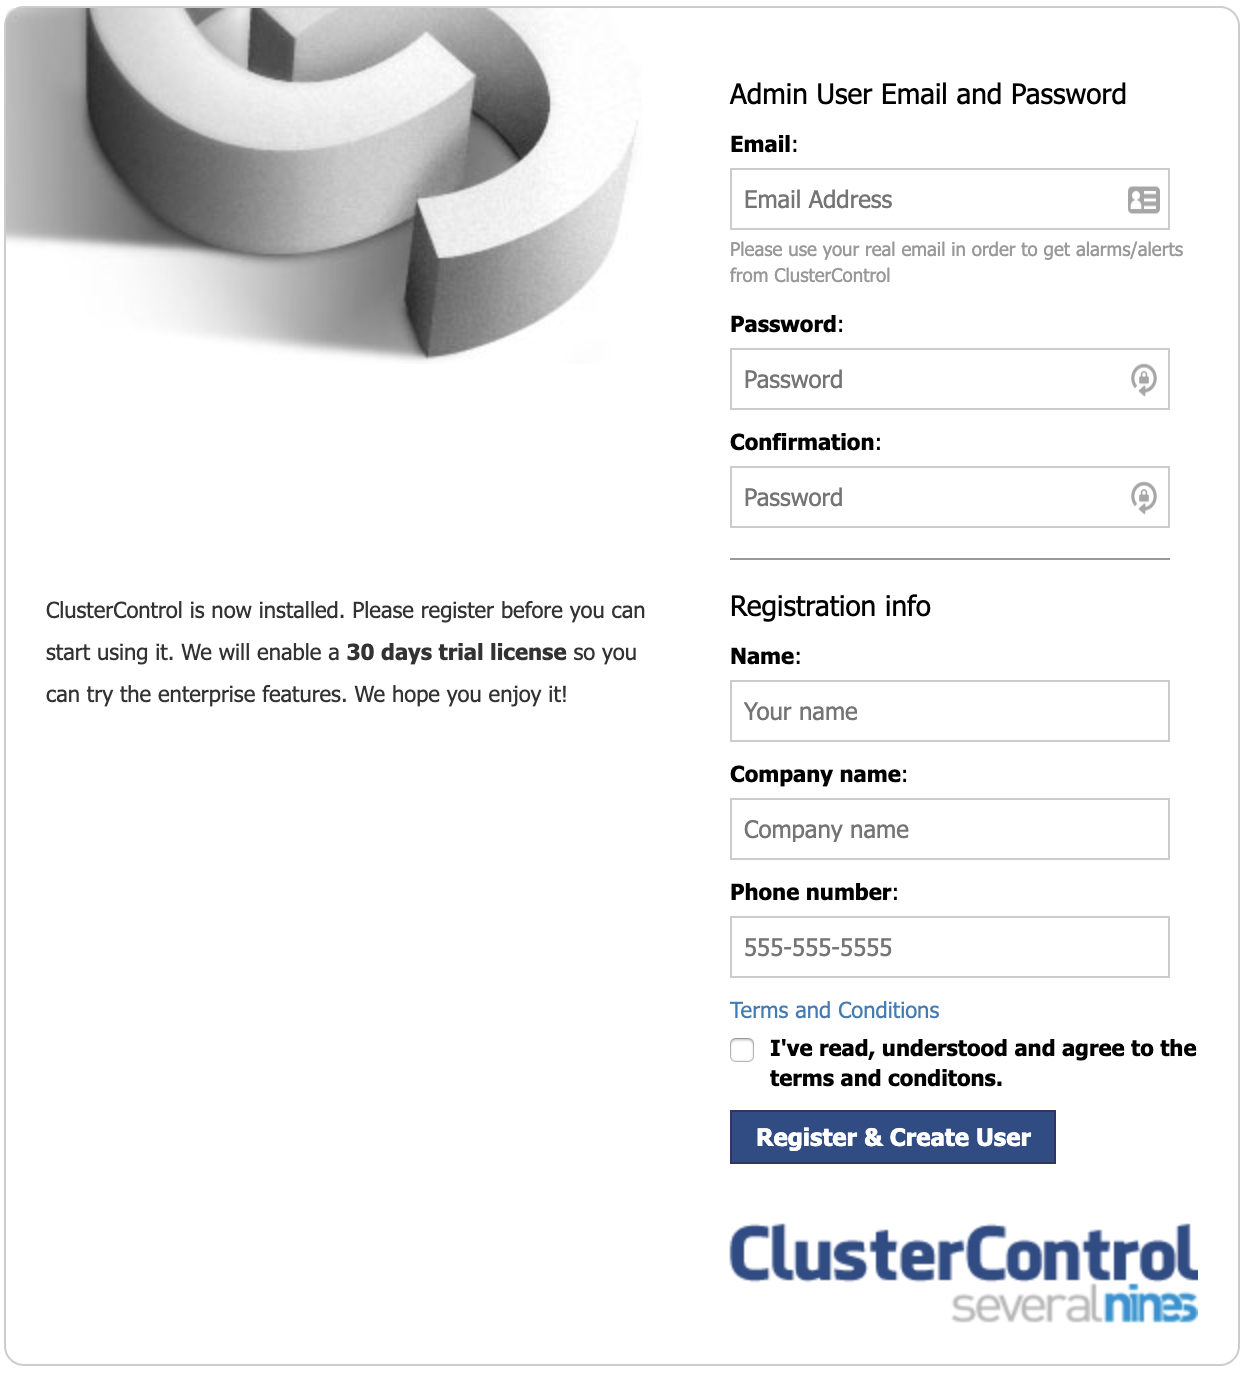
Open your web browser to http://192.168.100.131/clustercontrol and
enter an email address and new password for the default Admin User.
Determining network interfaces. This may take a couple of minutes. Do NOT press any key.
Public/external IP => http://10.10.10.10/clustercontrol
Installation successful. If you want to uninstall ClusterControl then run install-cc --uninstall.The first time you access the UI, you will need to register for the 30-day free trial period.
After your 30-day free trial ends, your installation will automatically convert to the community edition unless you have a commercial license.
Database Monitoring Usage Comparison
Manage Engine Applications Manager
To start using it, you need to add a new monitor using the corresponding section, where you have different options to be used. As we mentioned in the features section, it allows you to monitor different things like Applications, Databases, Virtualization, and even more.
Let’s say you want to monitor a MySQL instance. For this, you’ll need to add a MySQL Java Connector in the Application Manager directory, in “/opt/ManageEngine/AppManager14/working/mysql/MMMySQLDriver”, and then, restart the Applications Manager software. Then, you need to create the user to access the database.
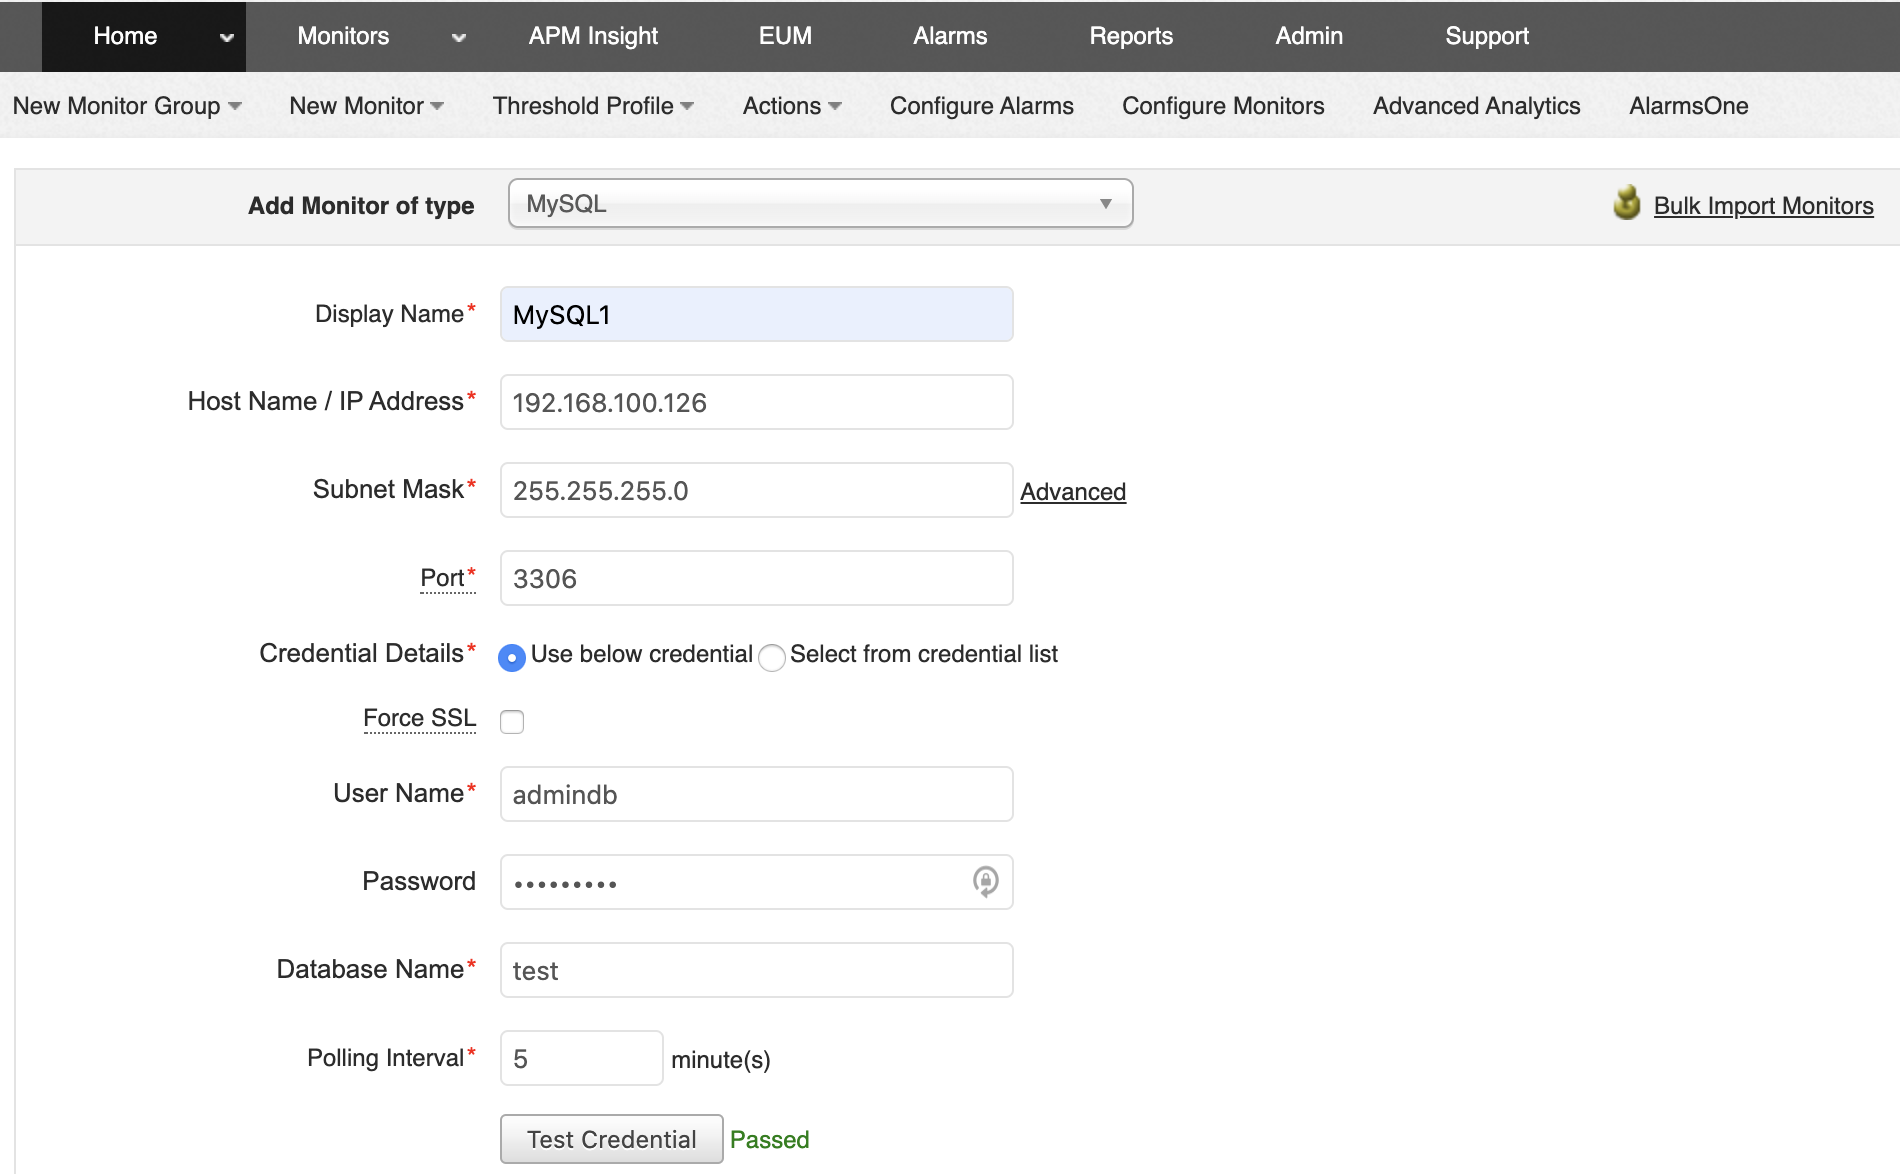
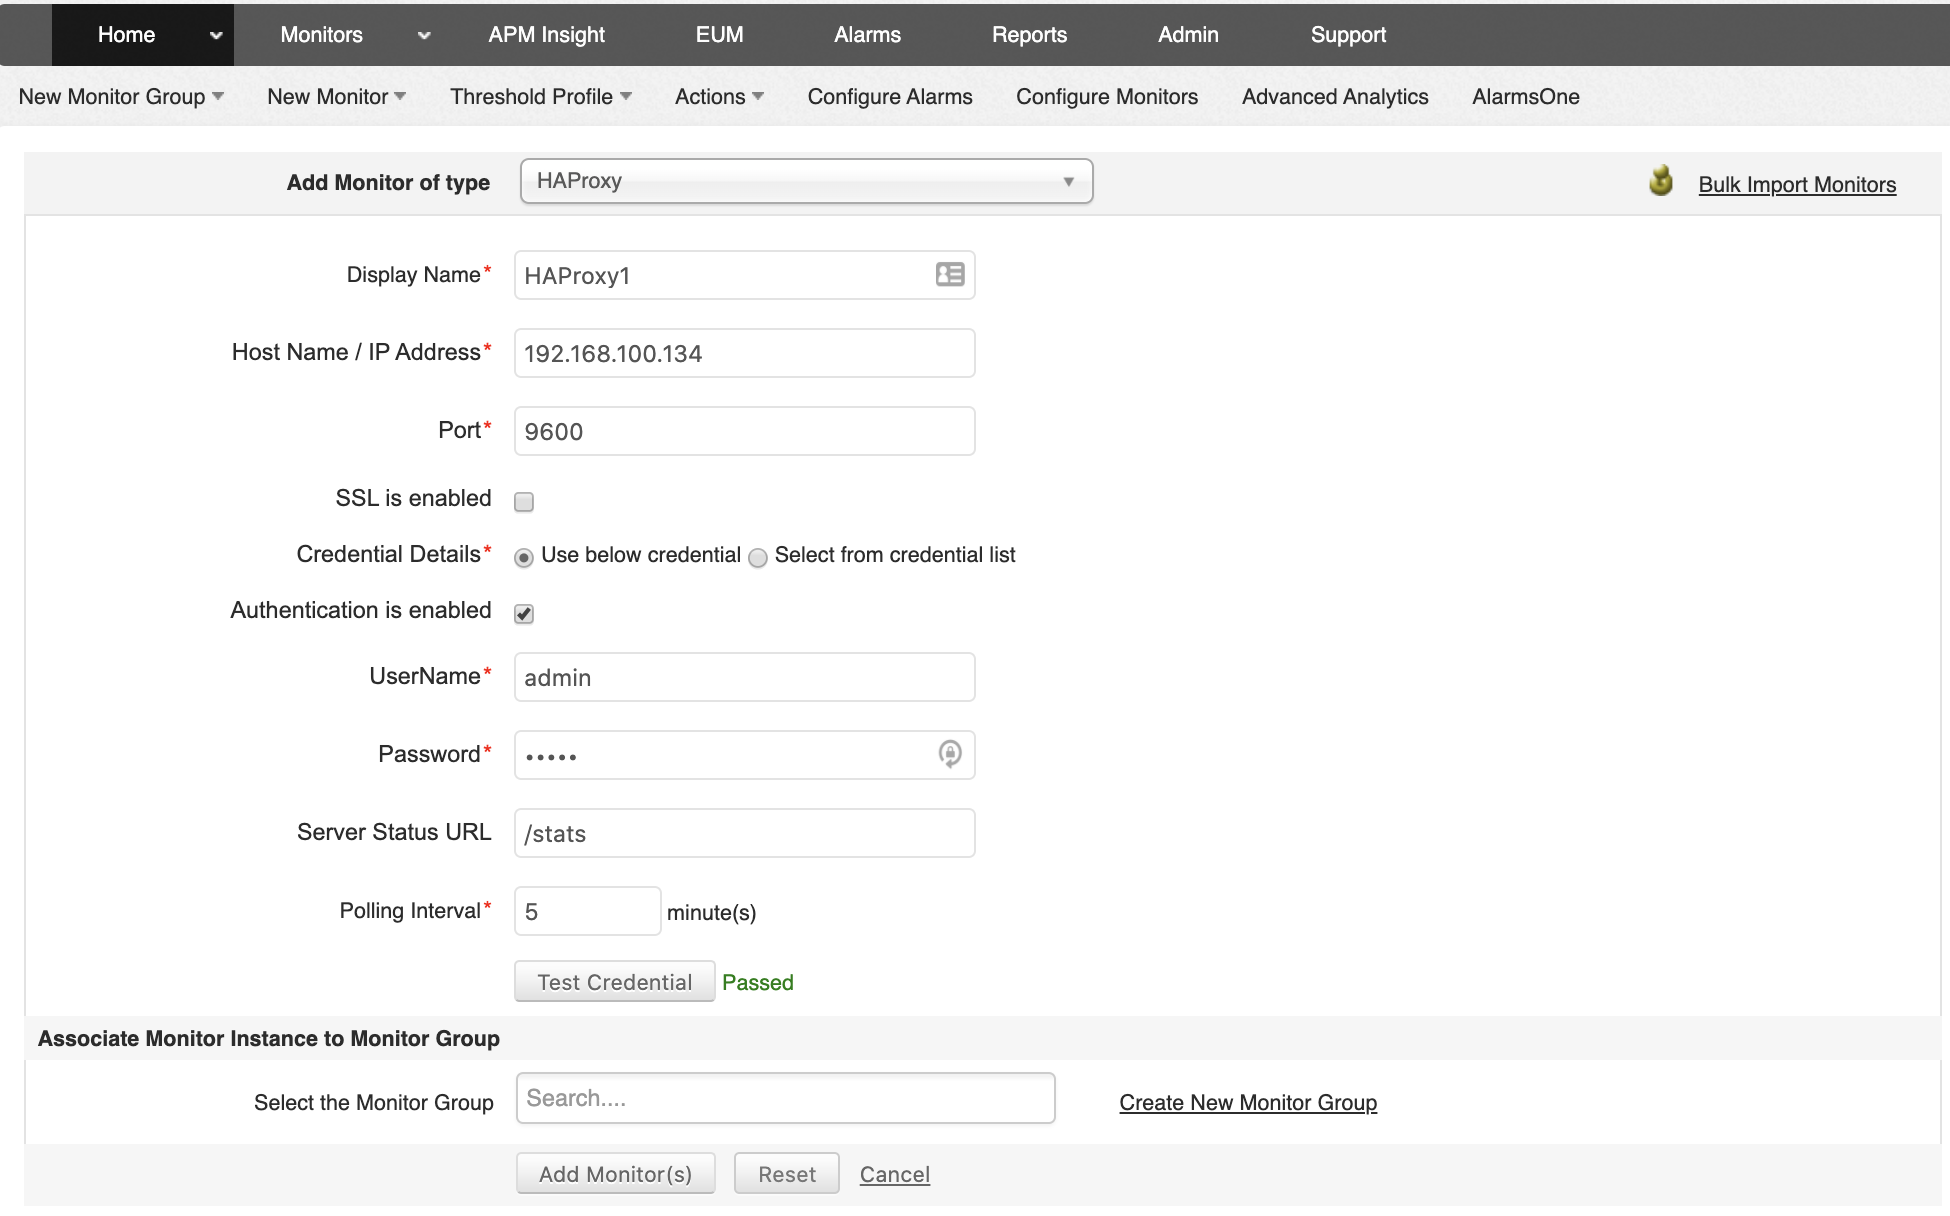
To add this monitor, you must specify the display name, hostname/IP address, database port, credentials, and database to be monitored. The database service must be running, and the database and user must be created previously.
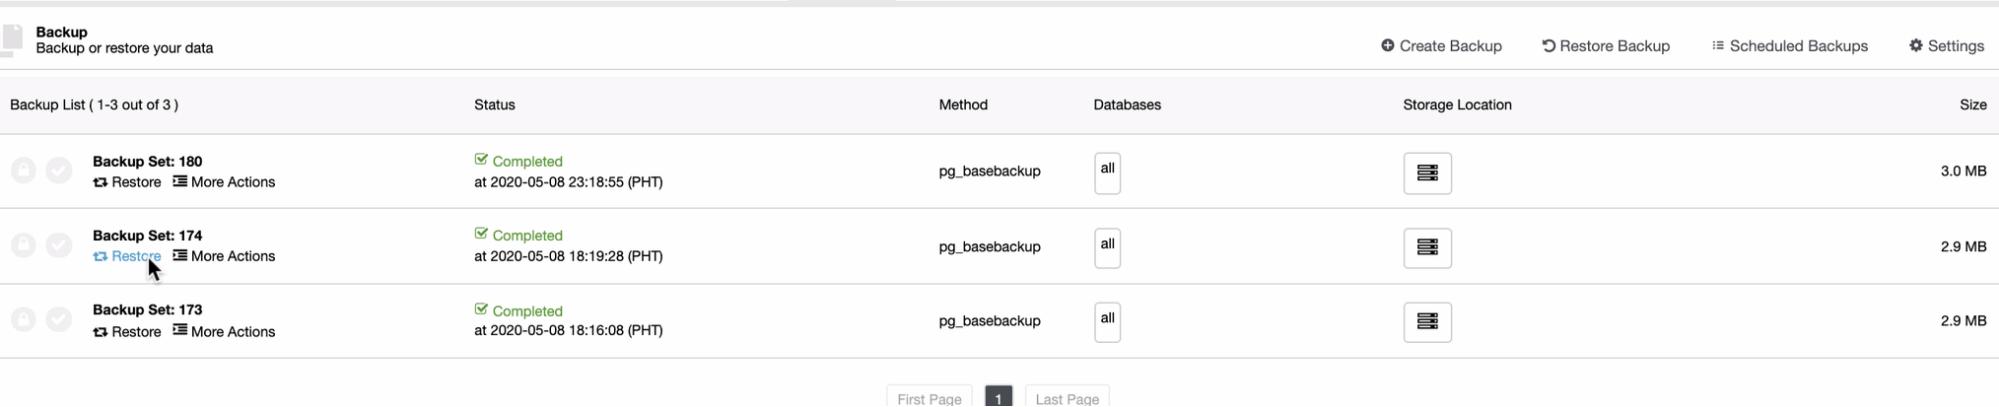
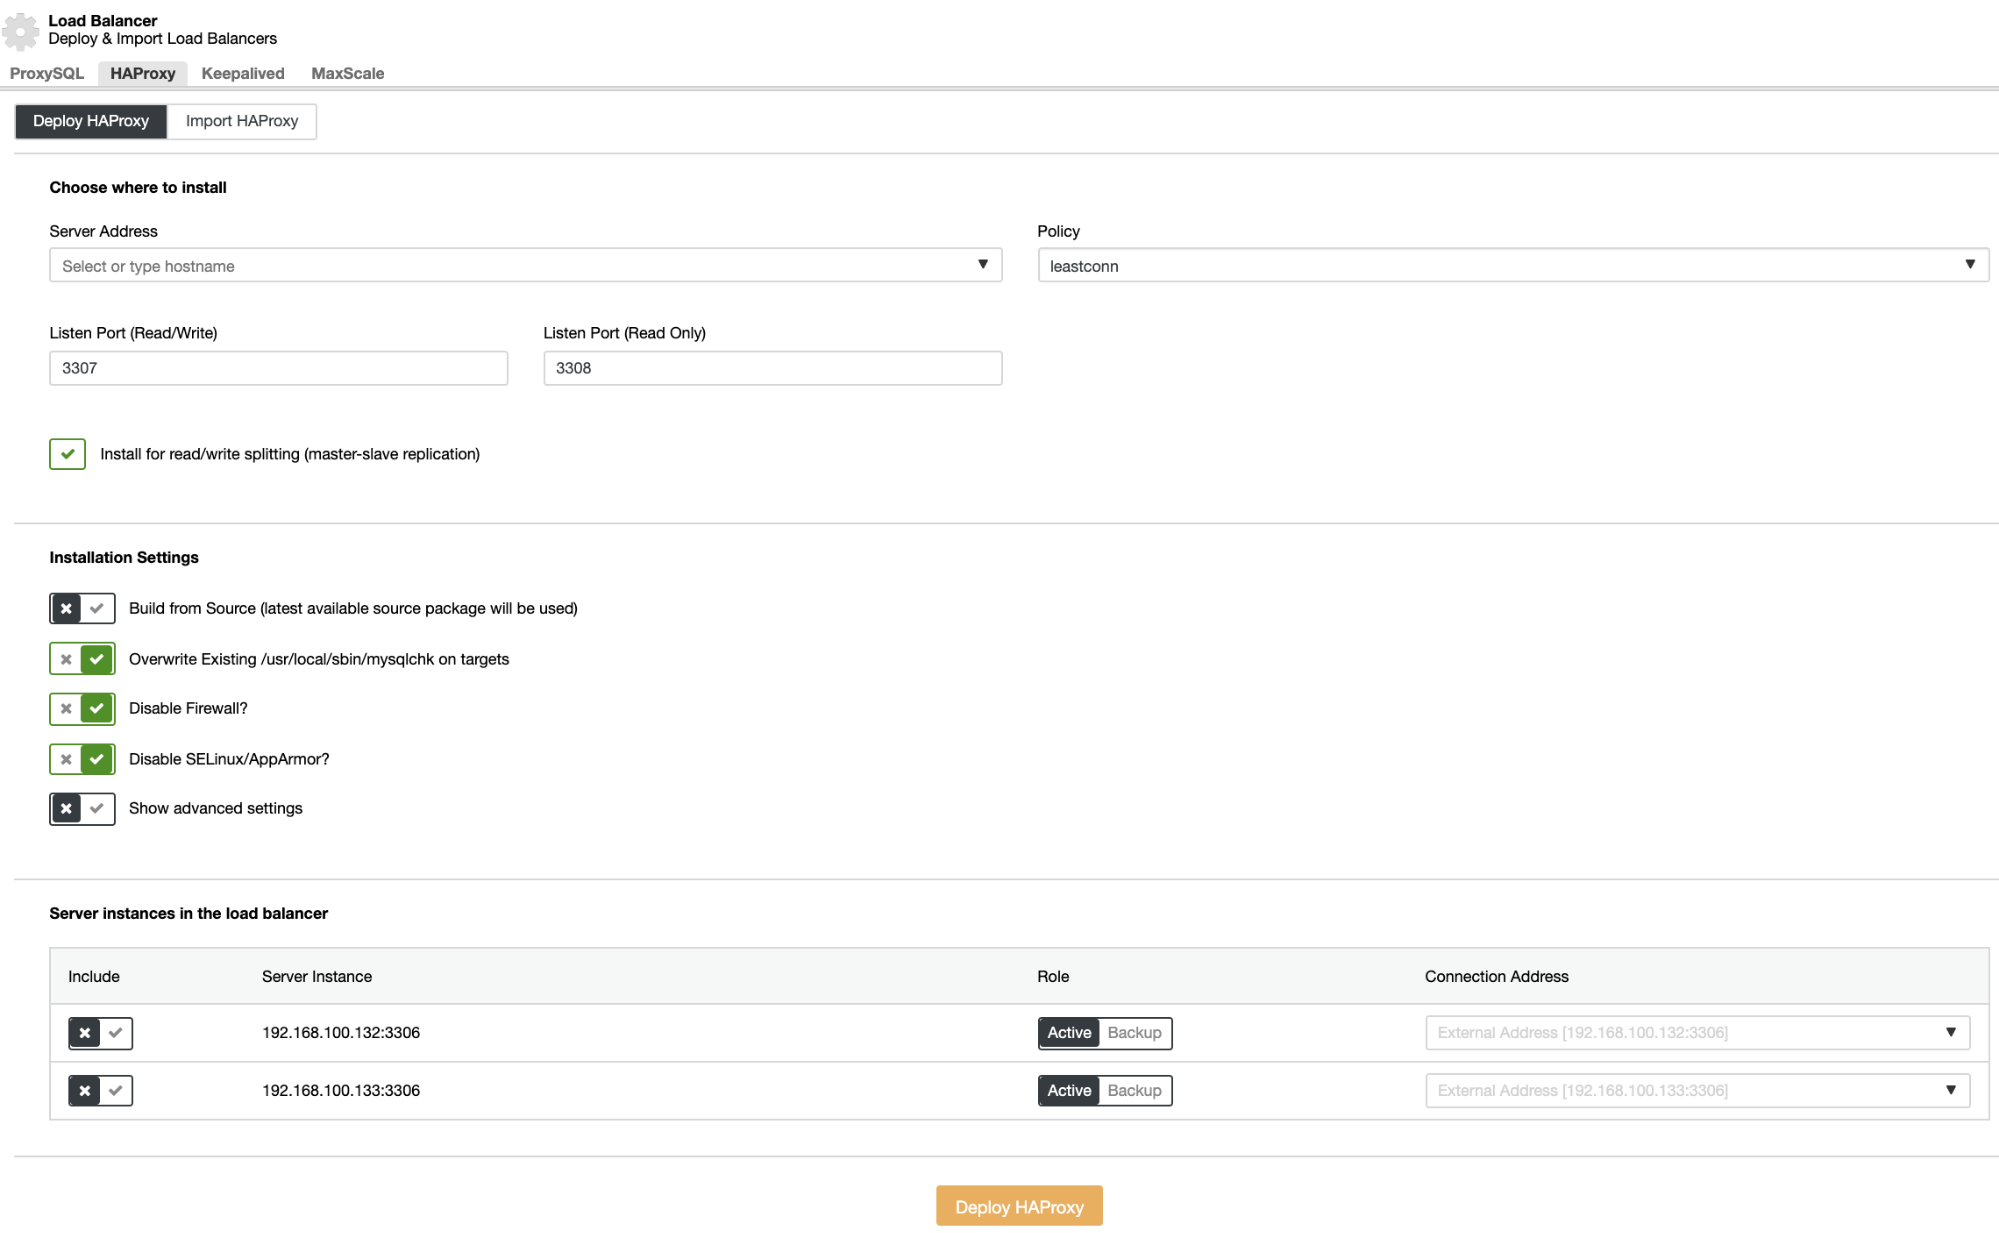
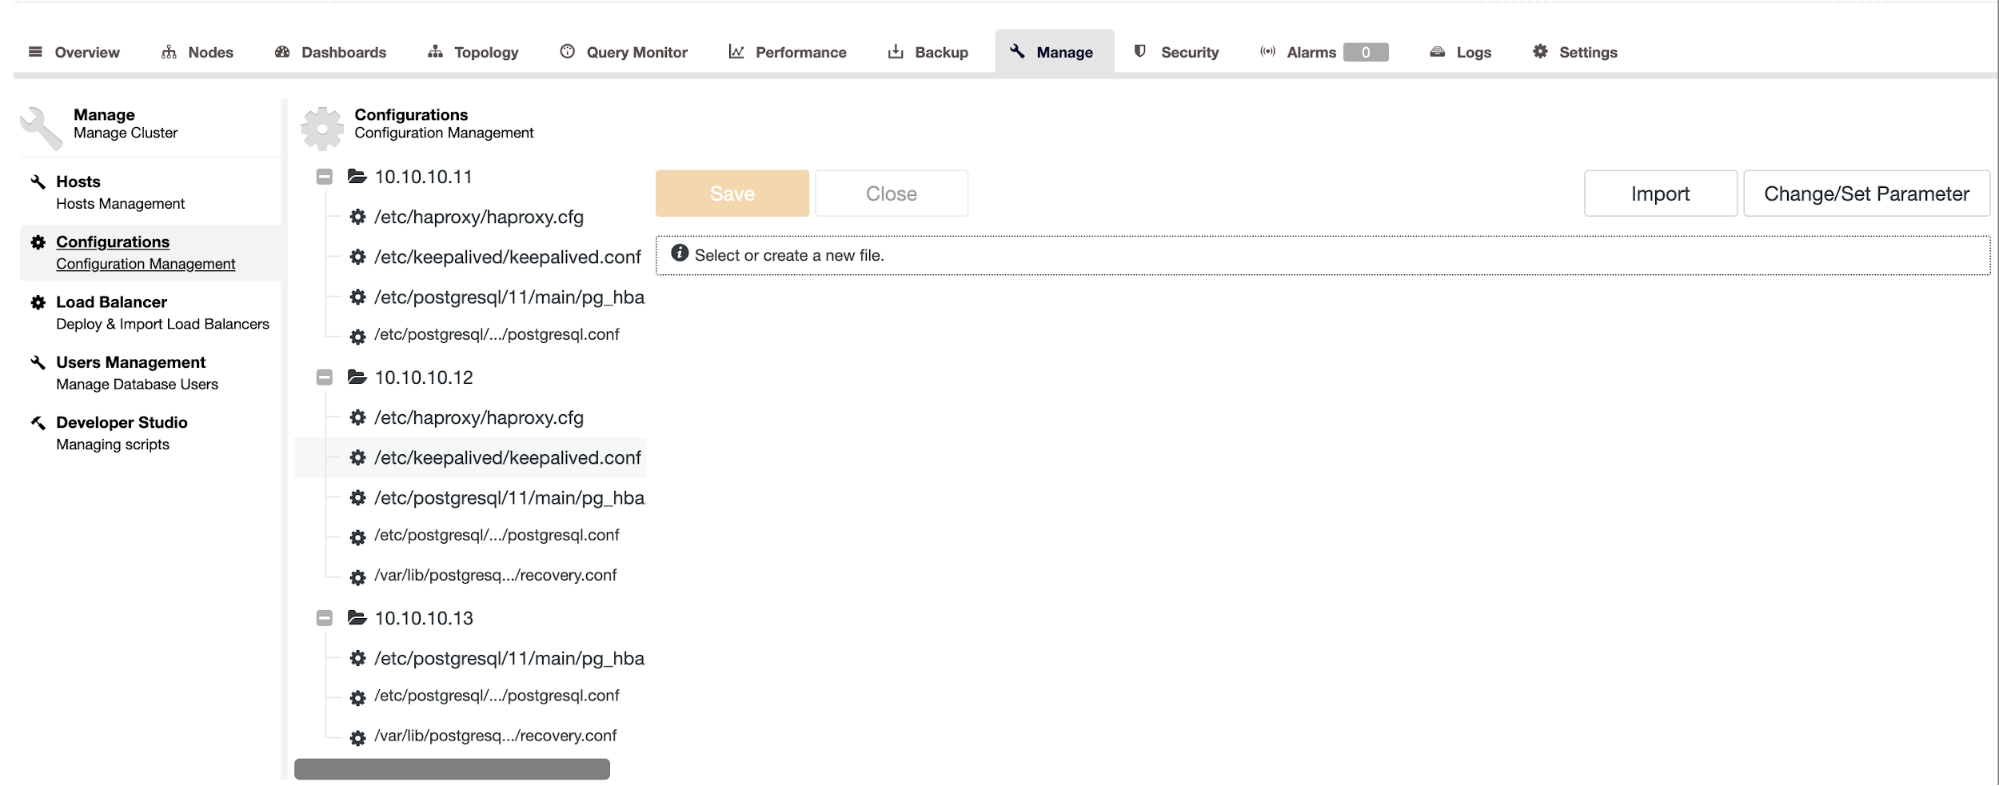
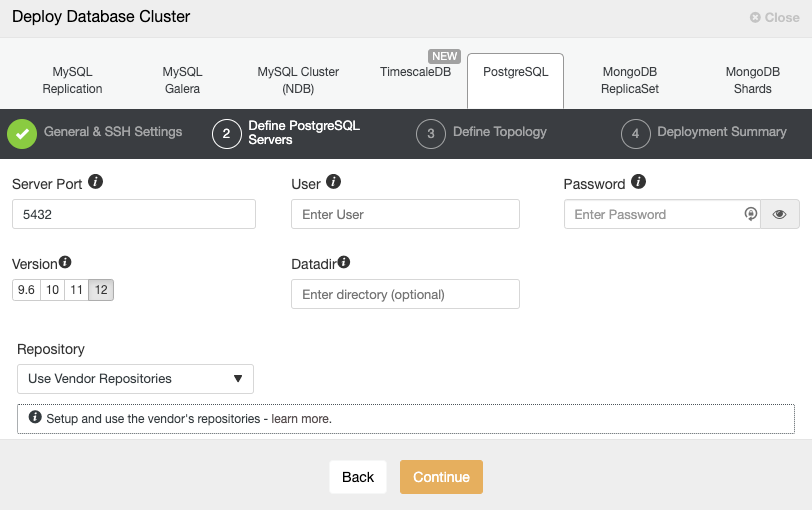
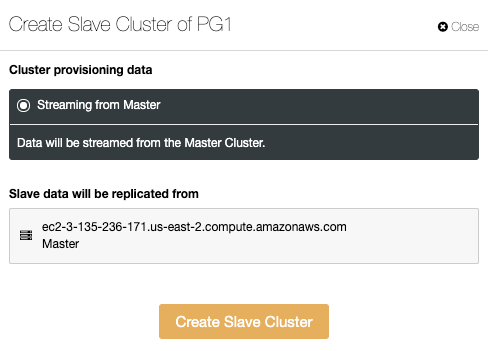
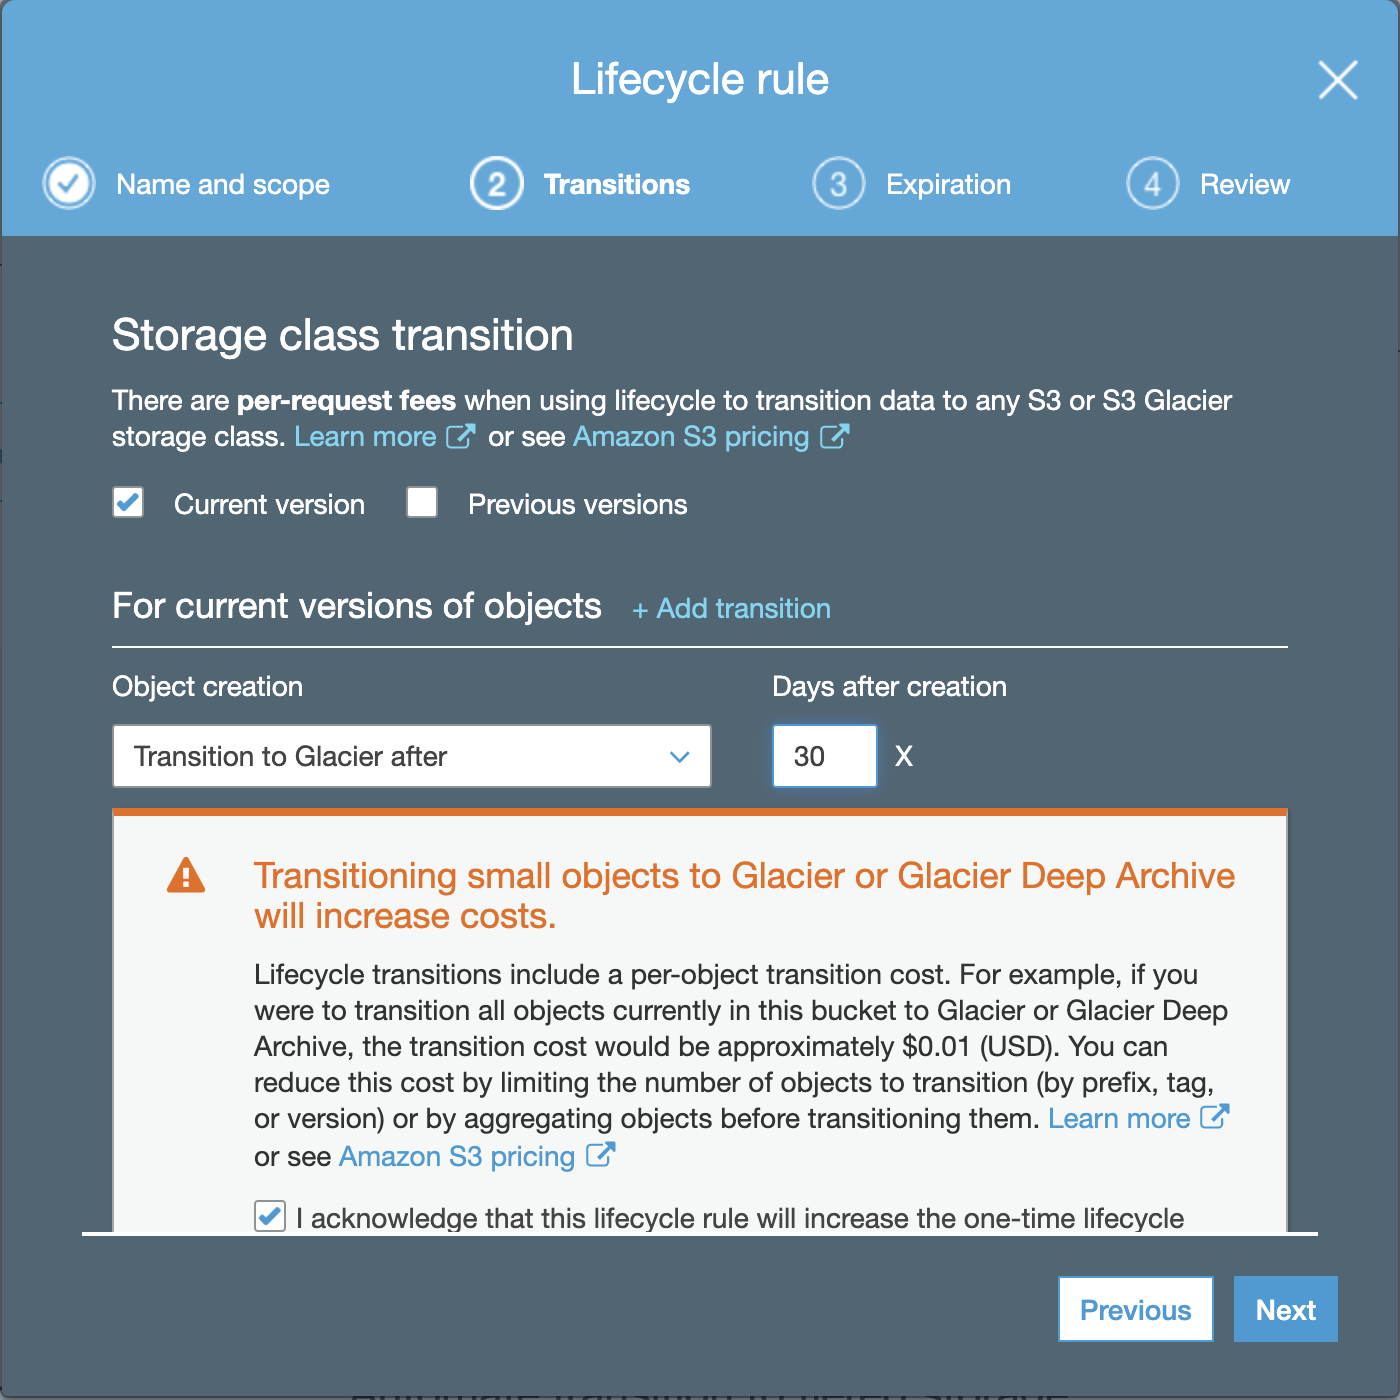
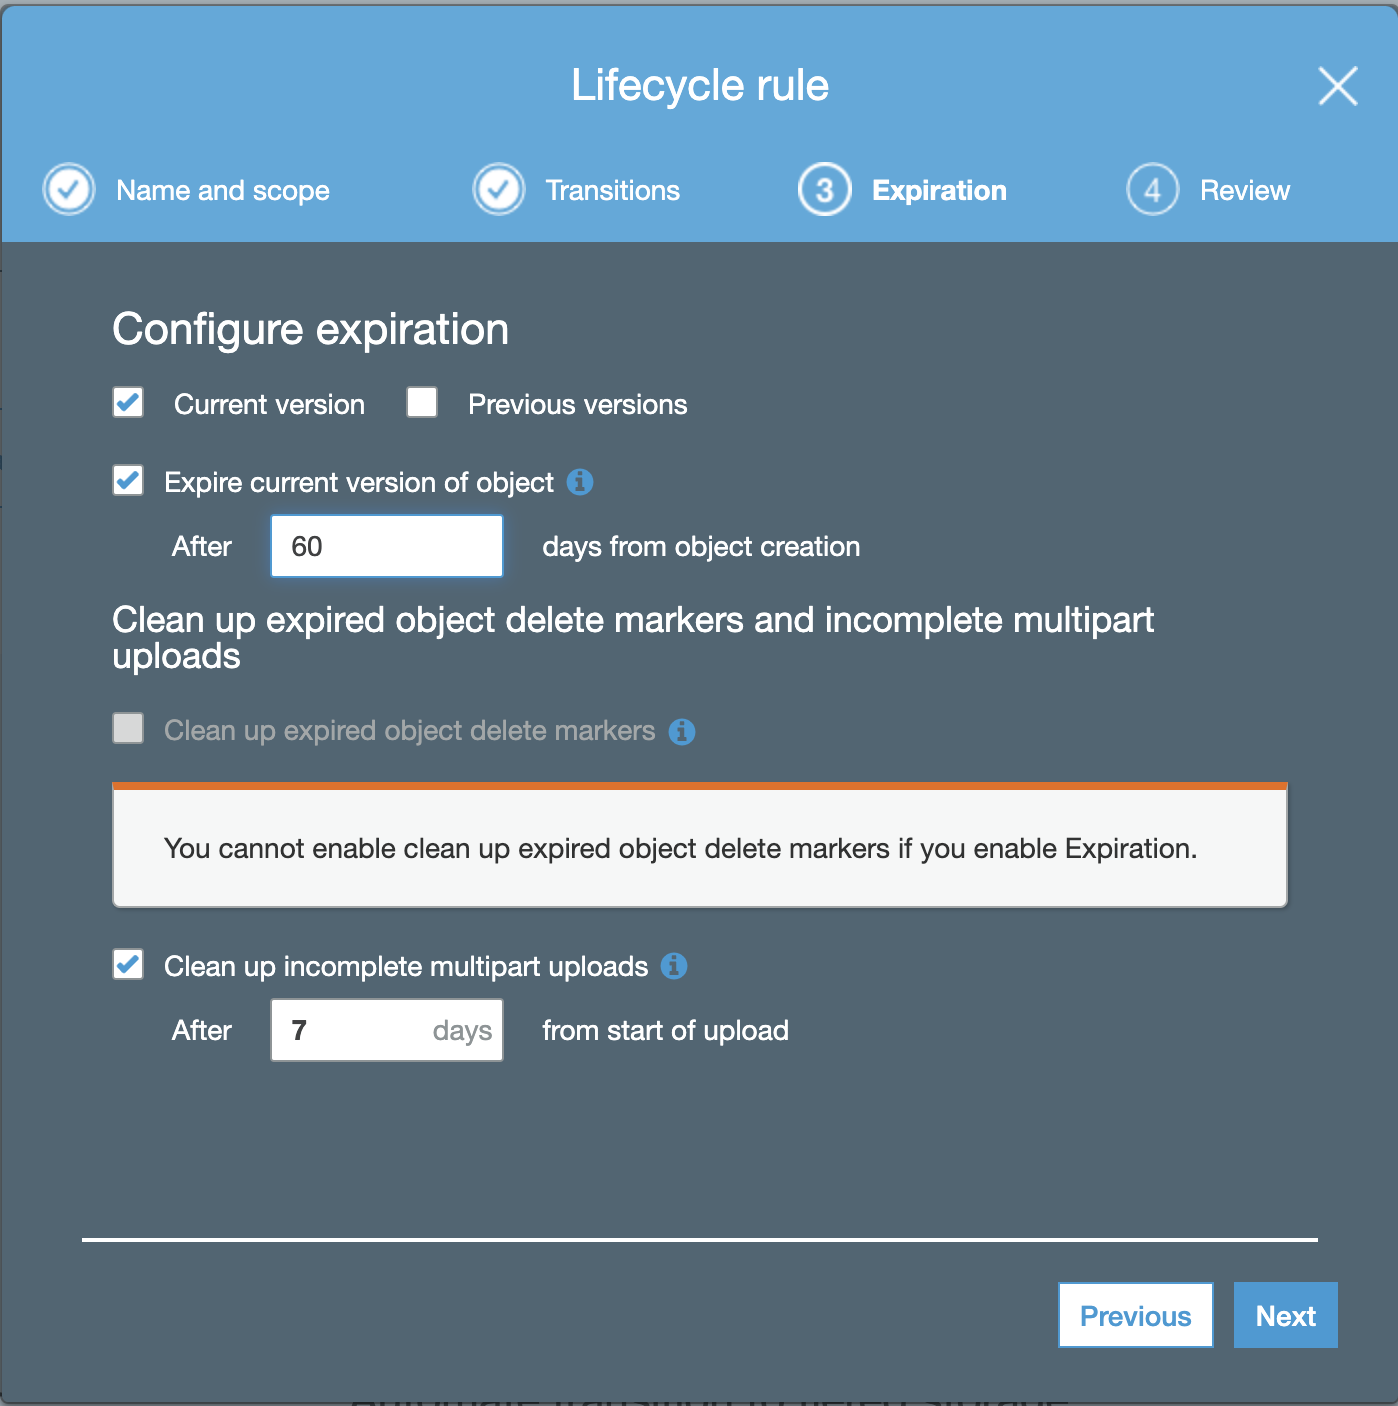
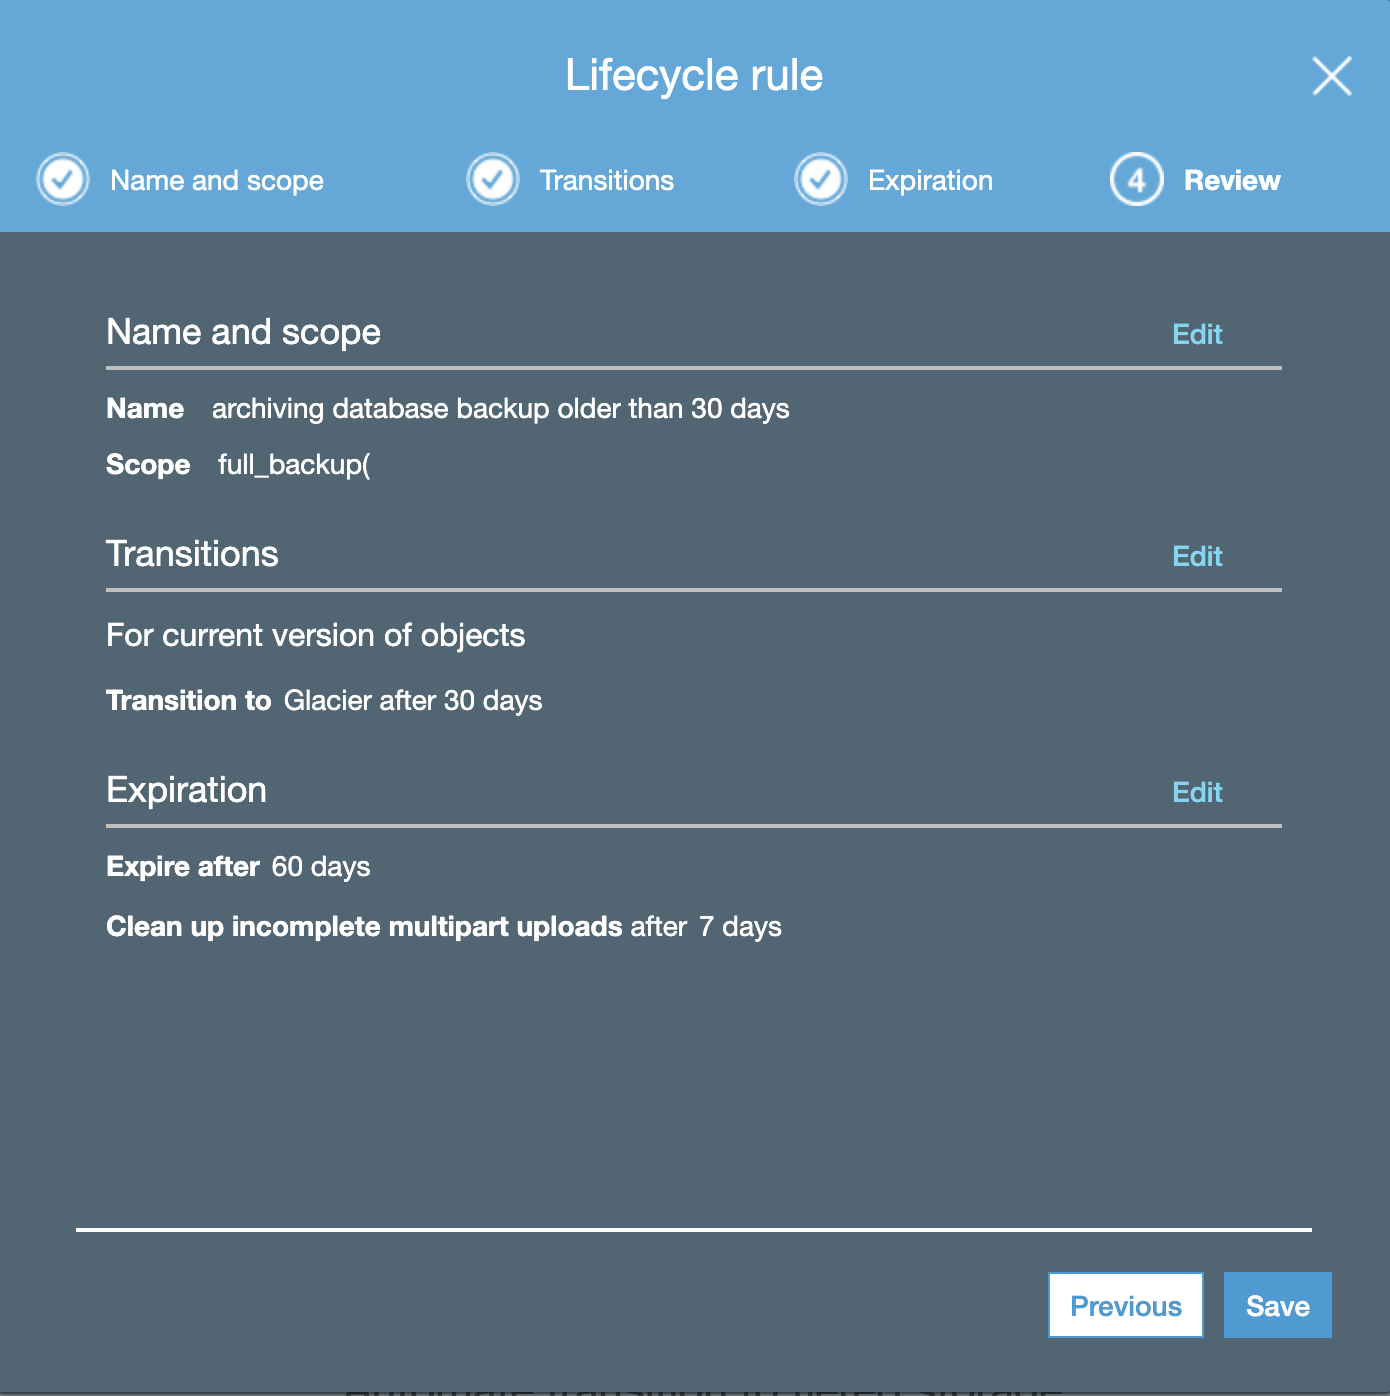
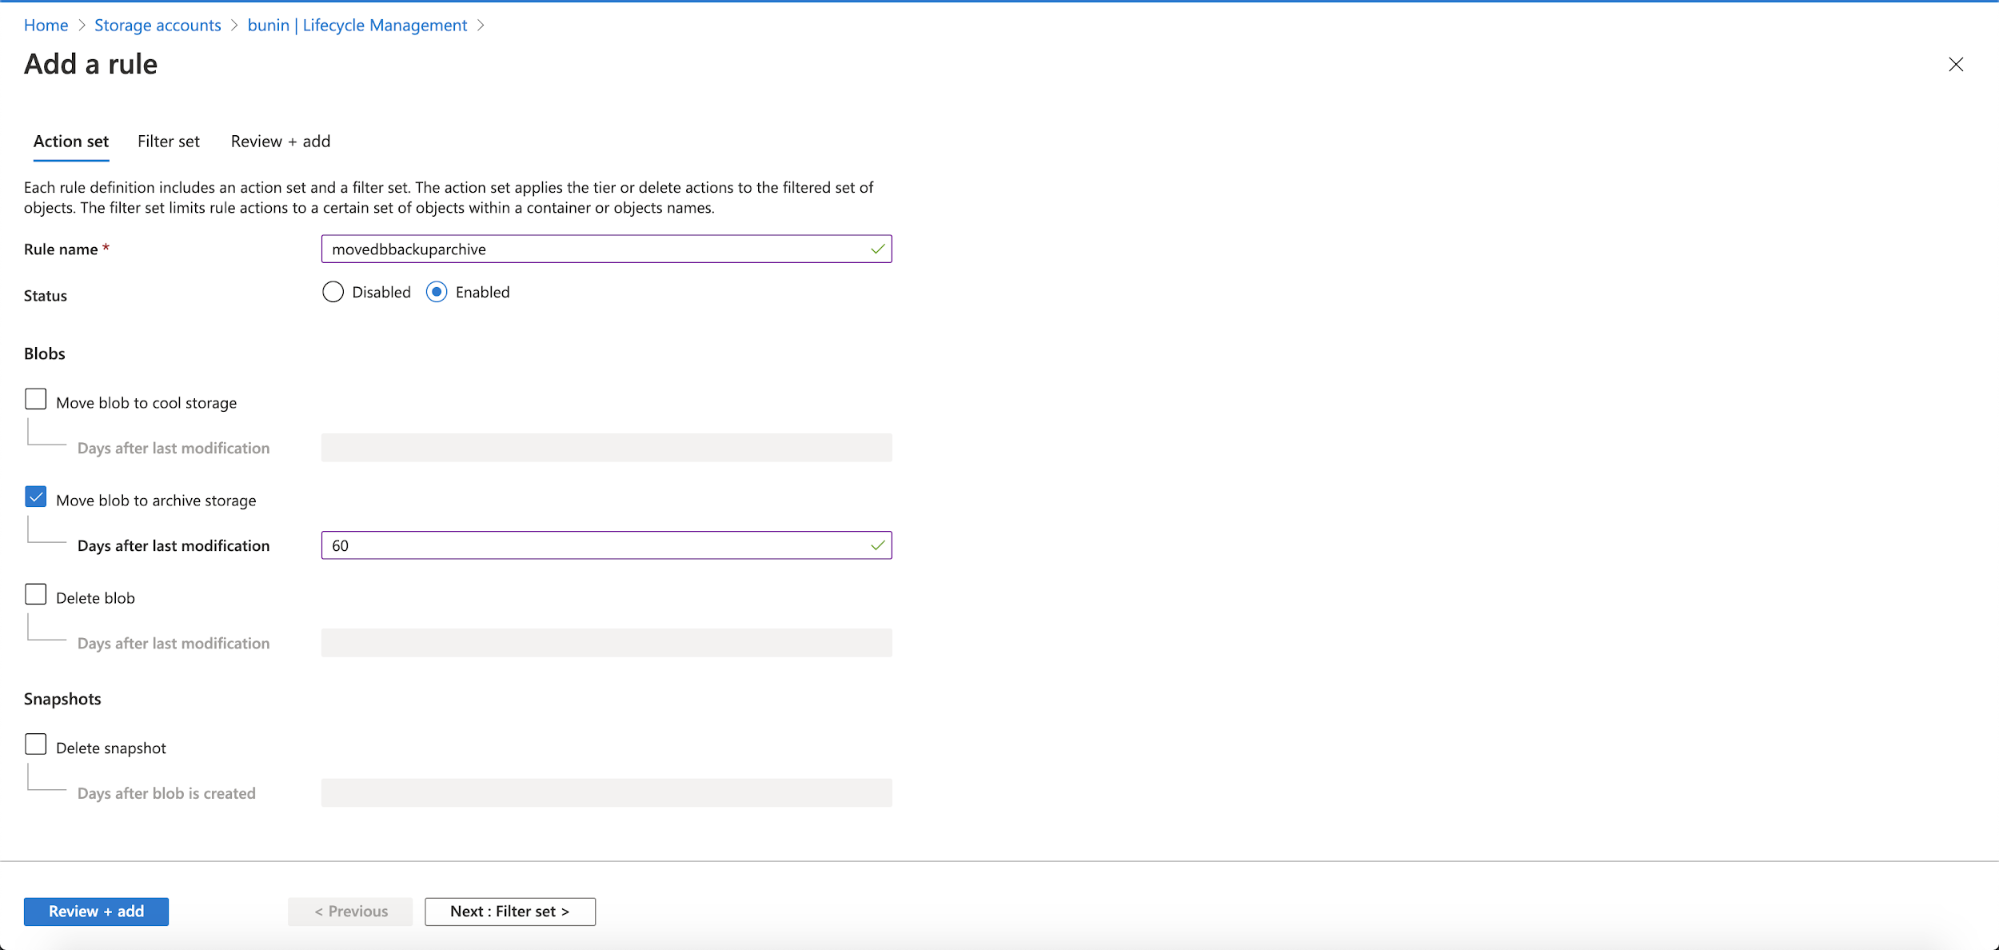
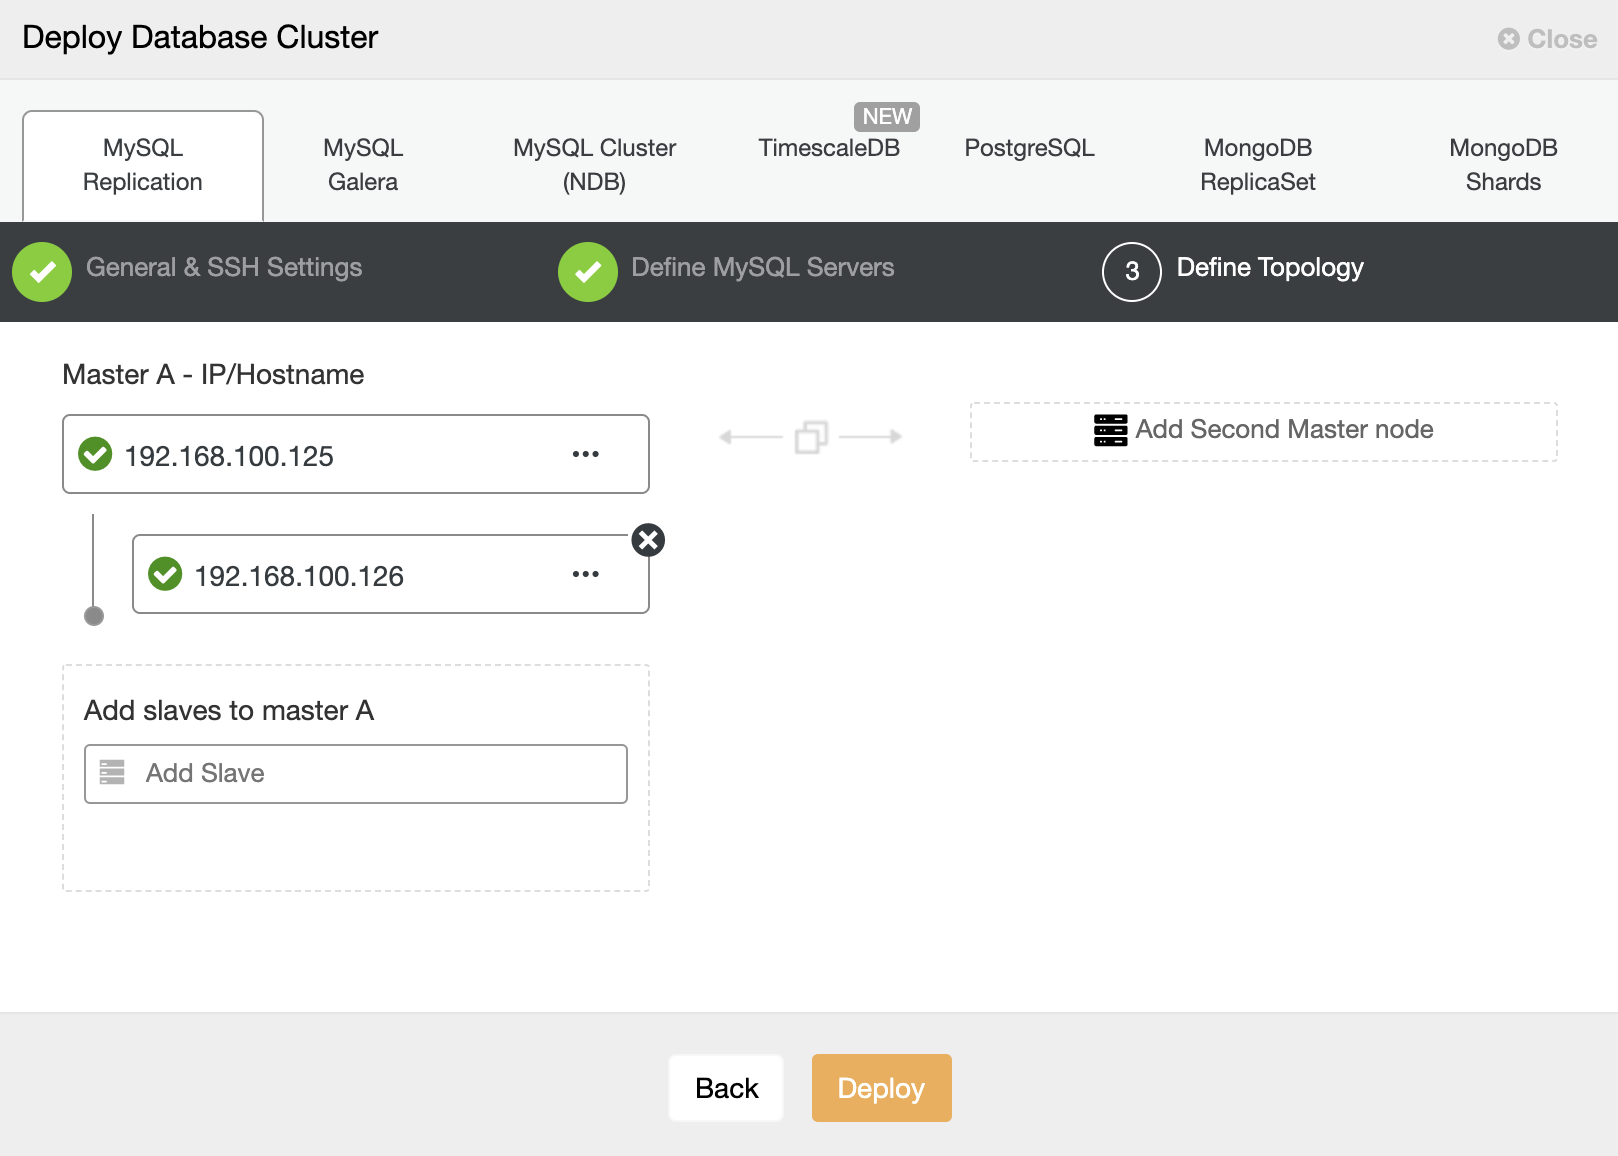
ClusterControl
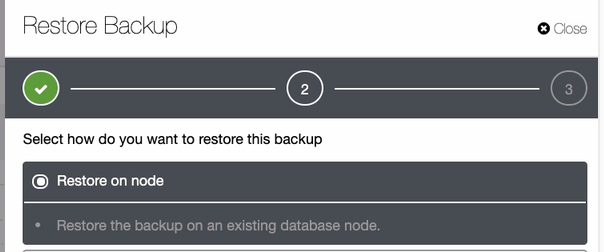
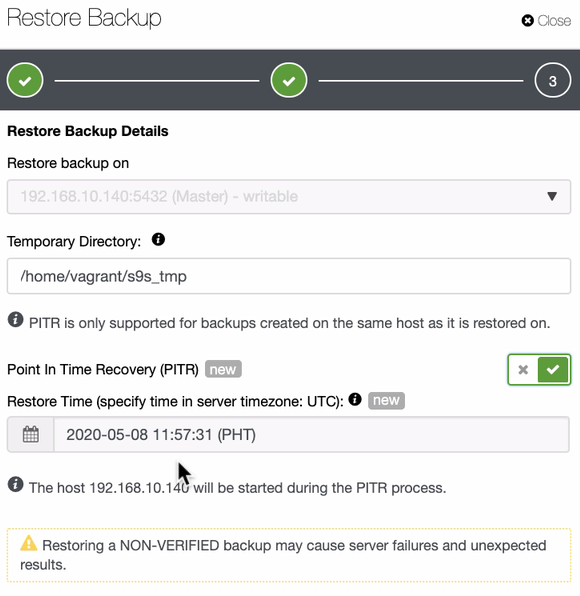
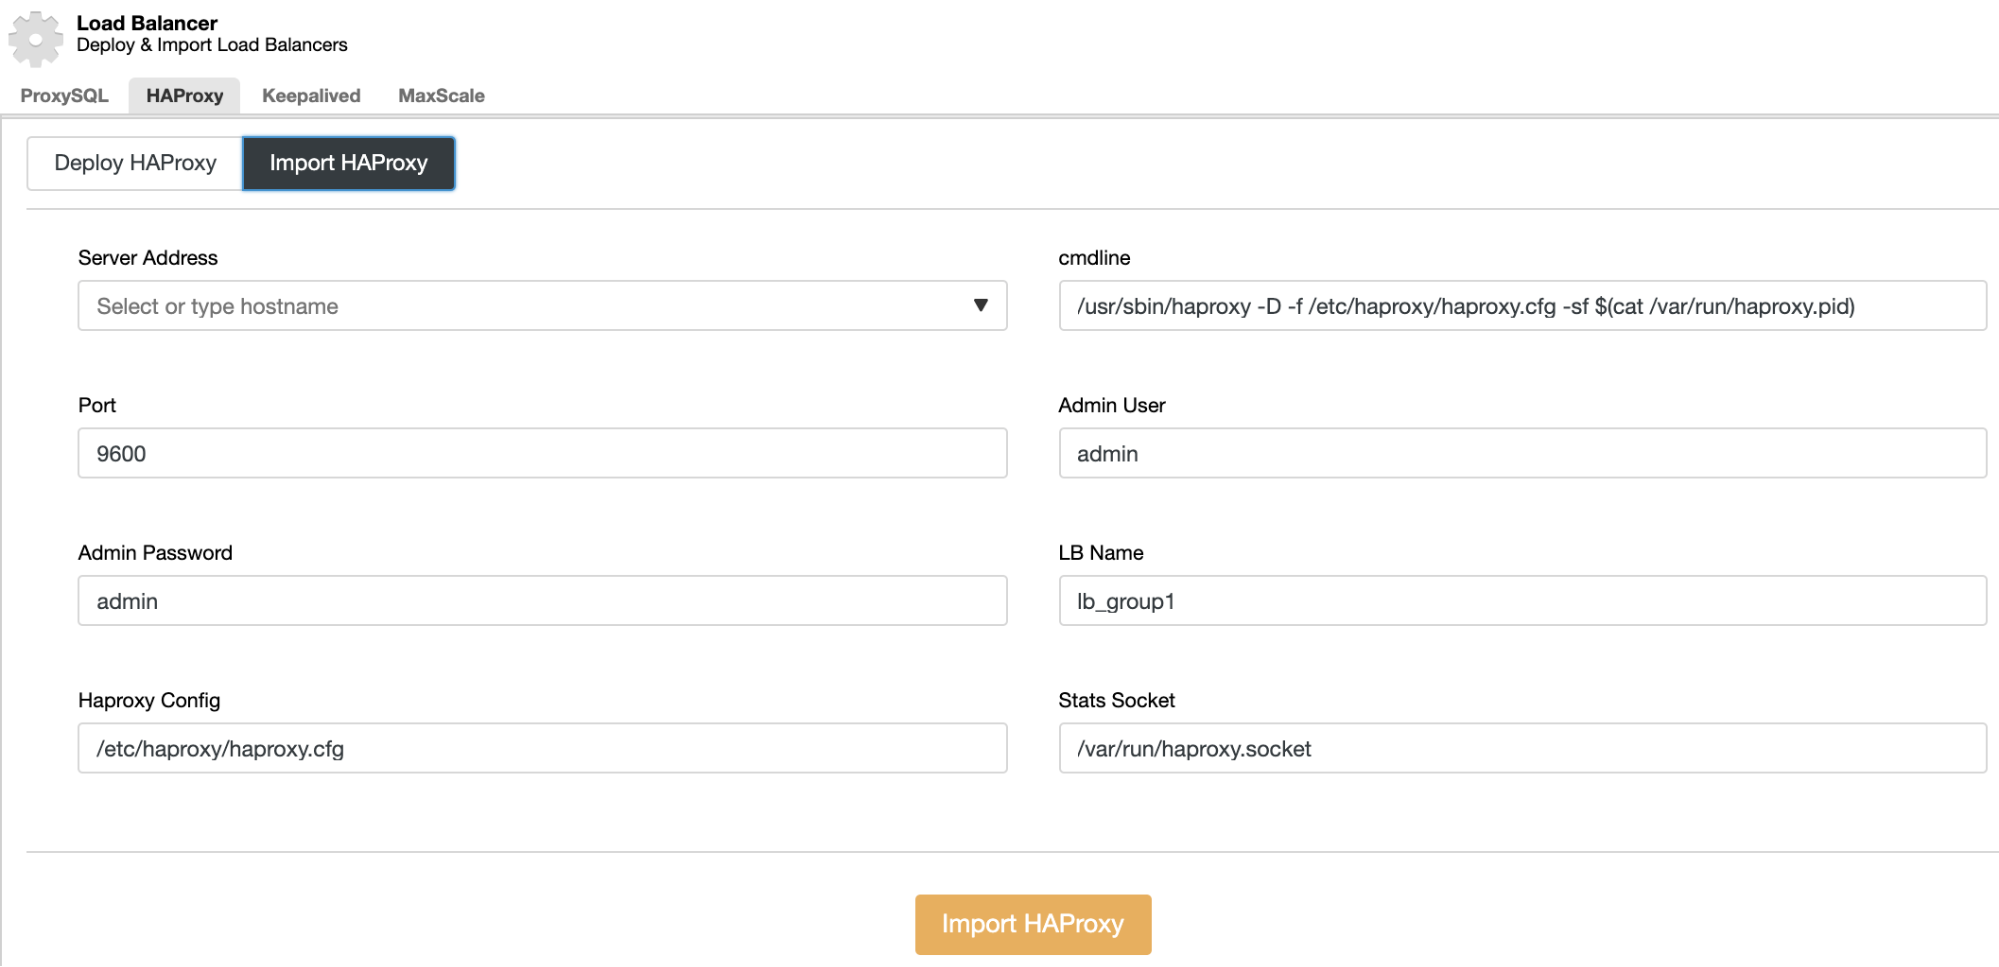
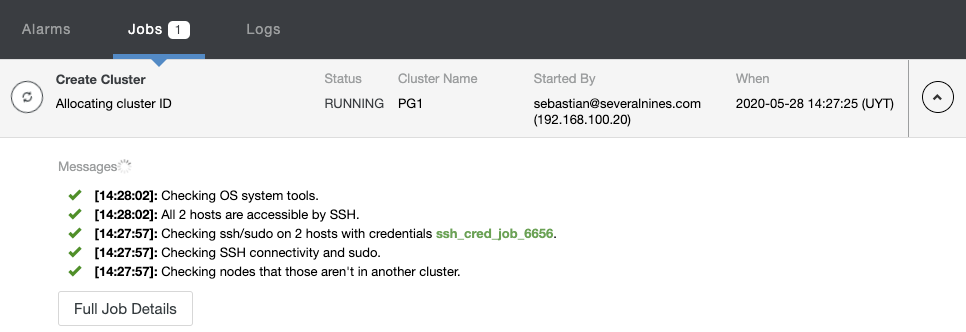
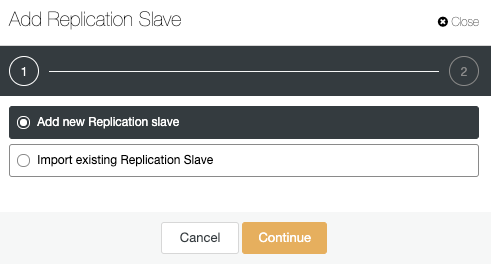
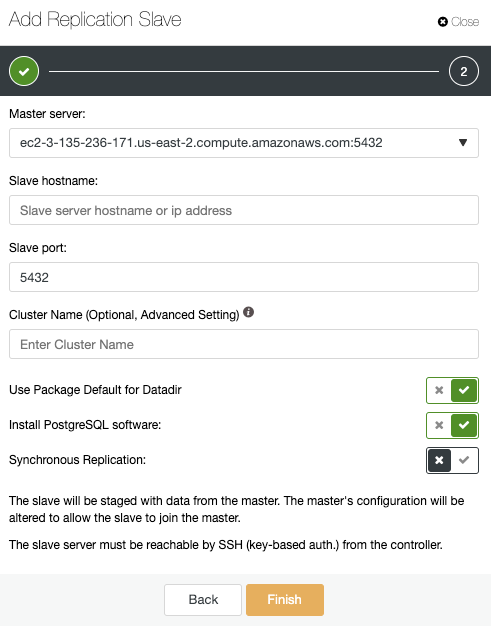
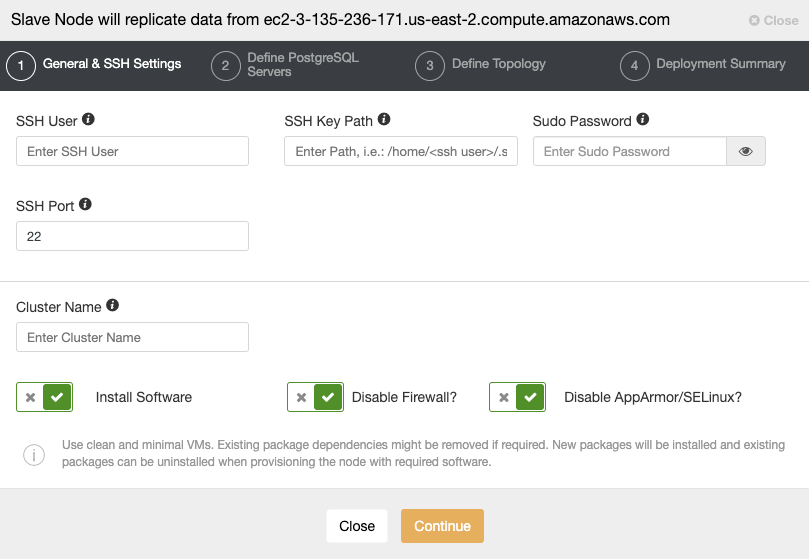
To add the first database node to be monitored, you must go to the deploy/import section. ClusterControl requires SSH access to the remote node for both deploy and import actions.
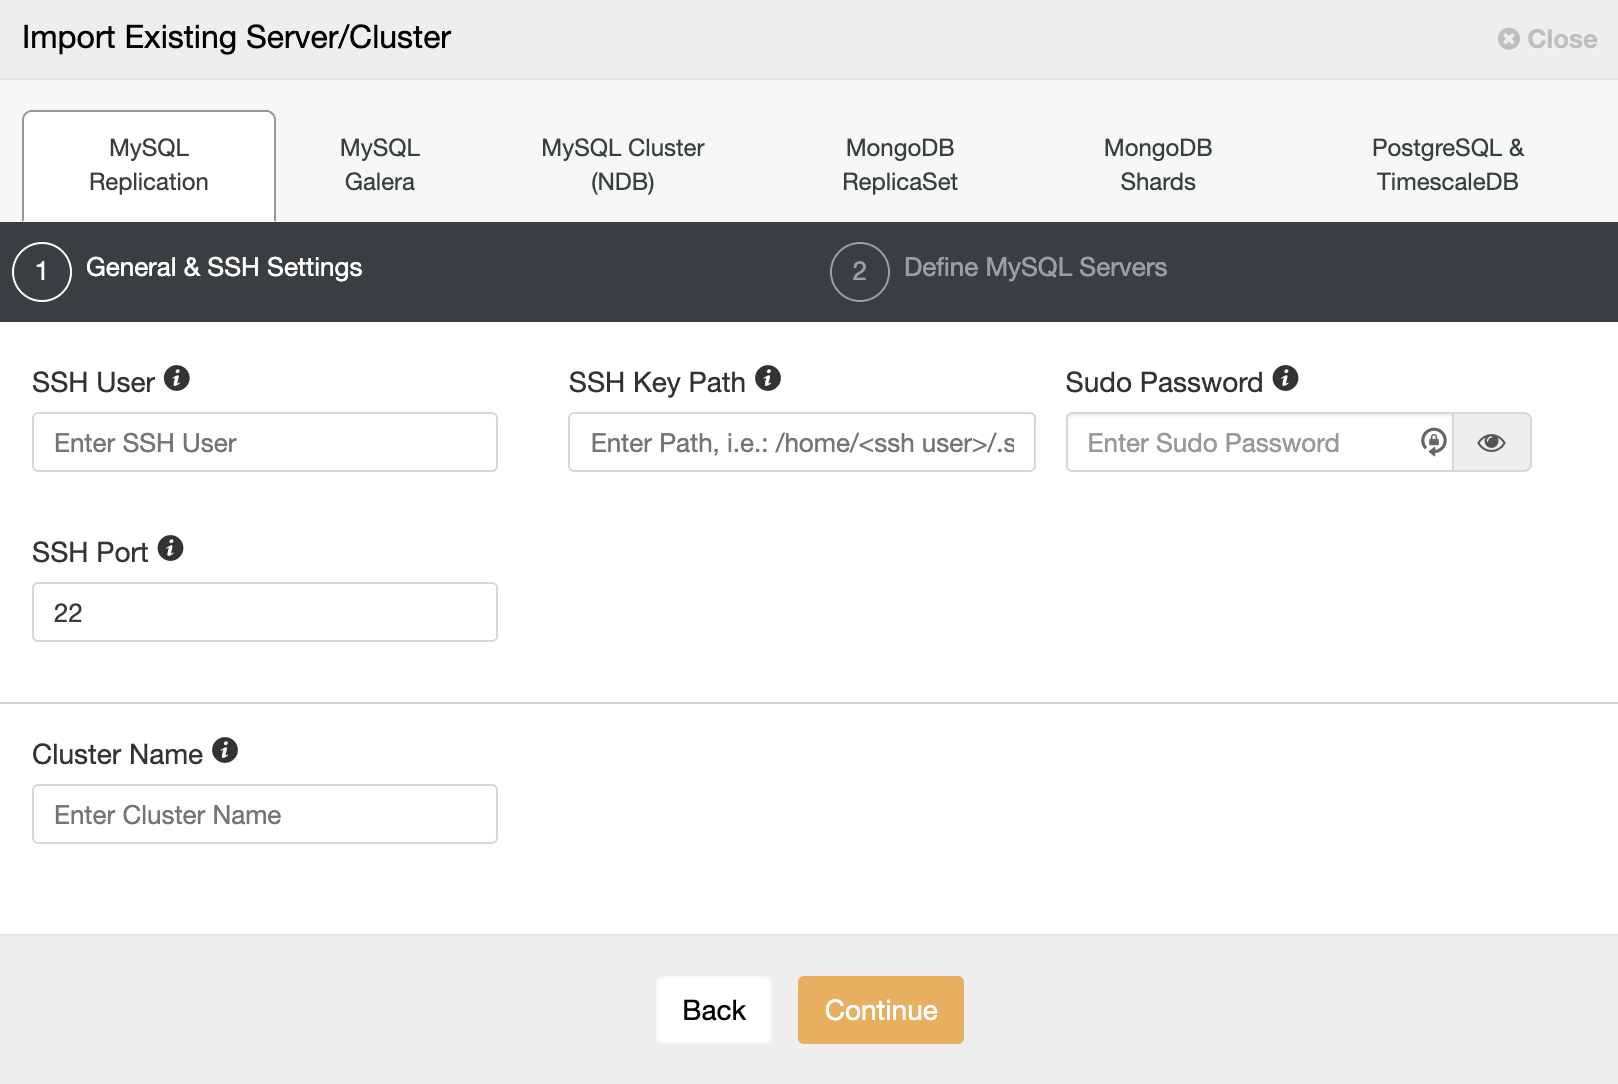
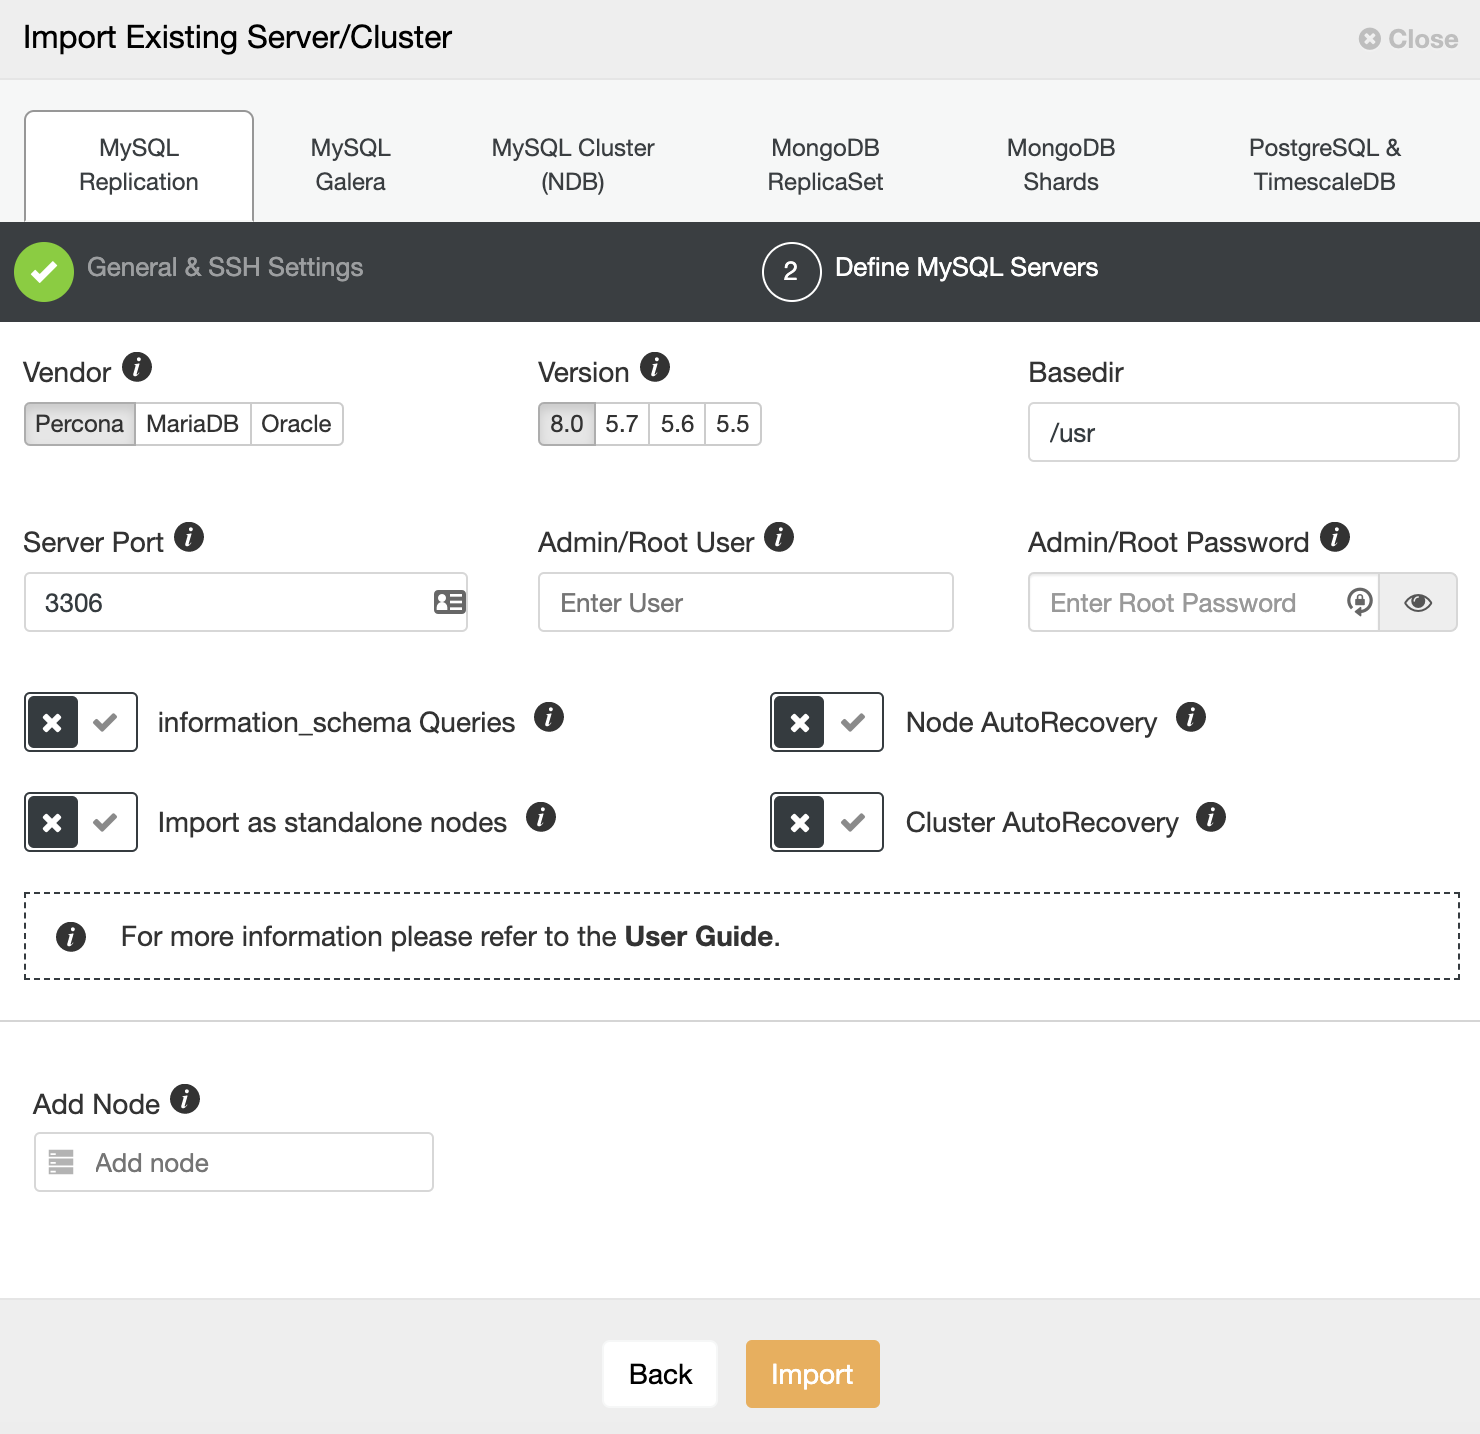
For the import process, you’ll need to use a database admin user, and specify vendor, version, database port, and Hostname/IP address of the node/nodes.
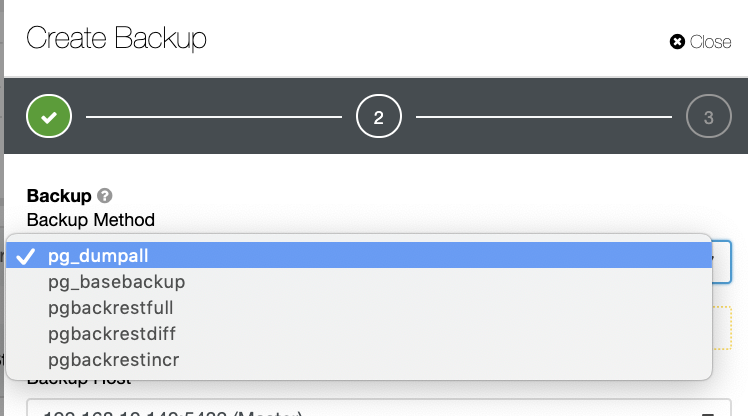
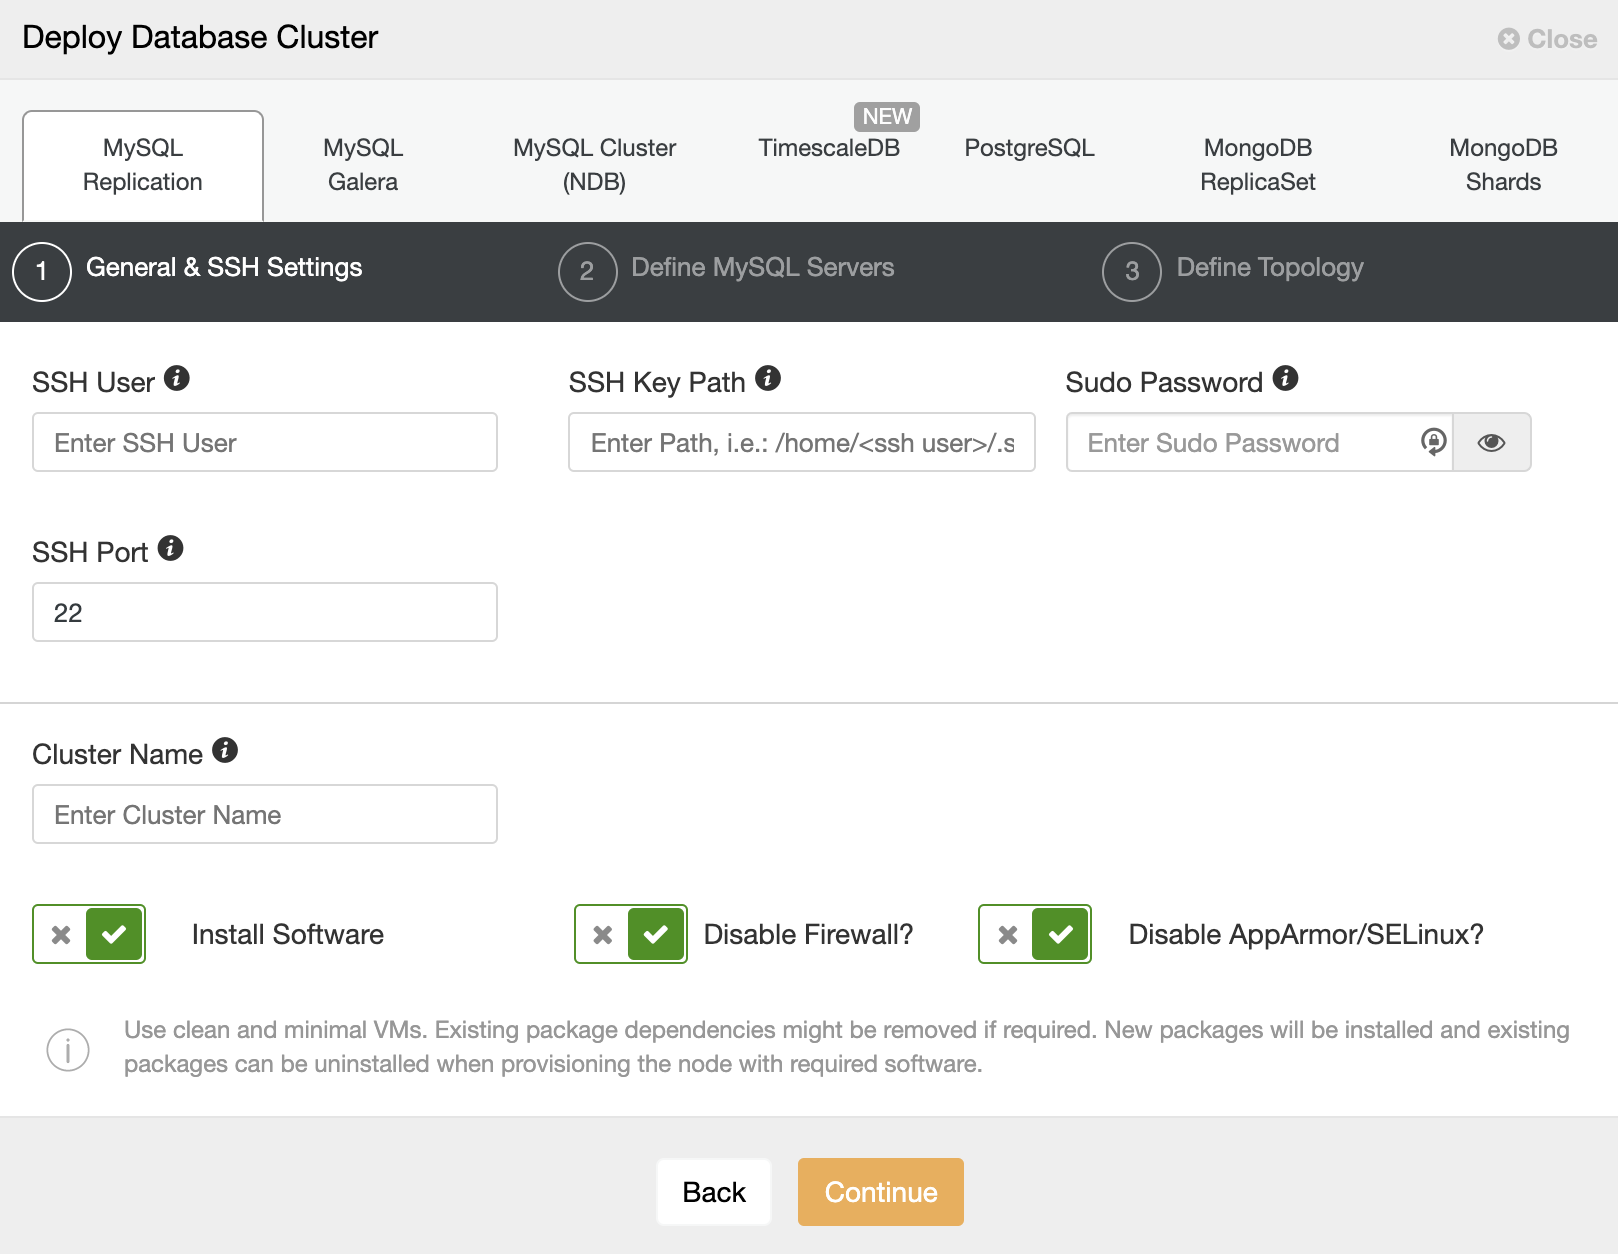
For deployment, you just need to specify the user that will be created during the installation process. ClusterControl will also install the database software and required packages in this process, so you don’t need to perform any manual configuration or installation.
You can also choose between different database vendors and versions, and a basic configuration like database port and datadir.
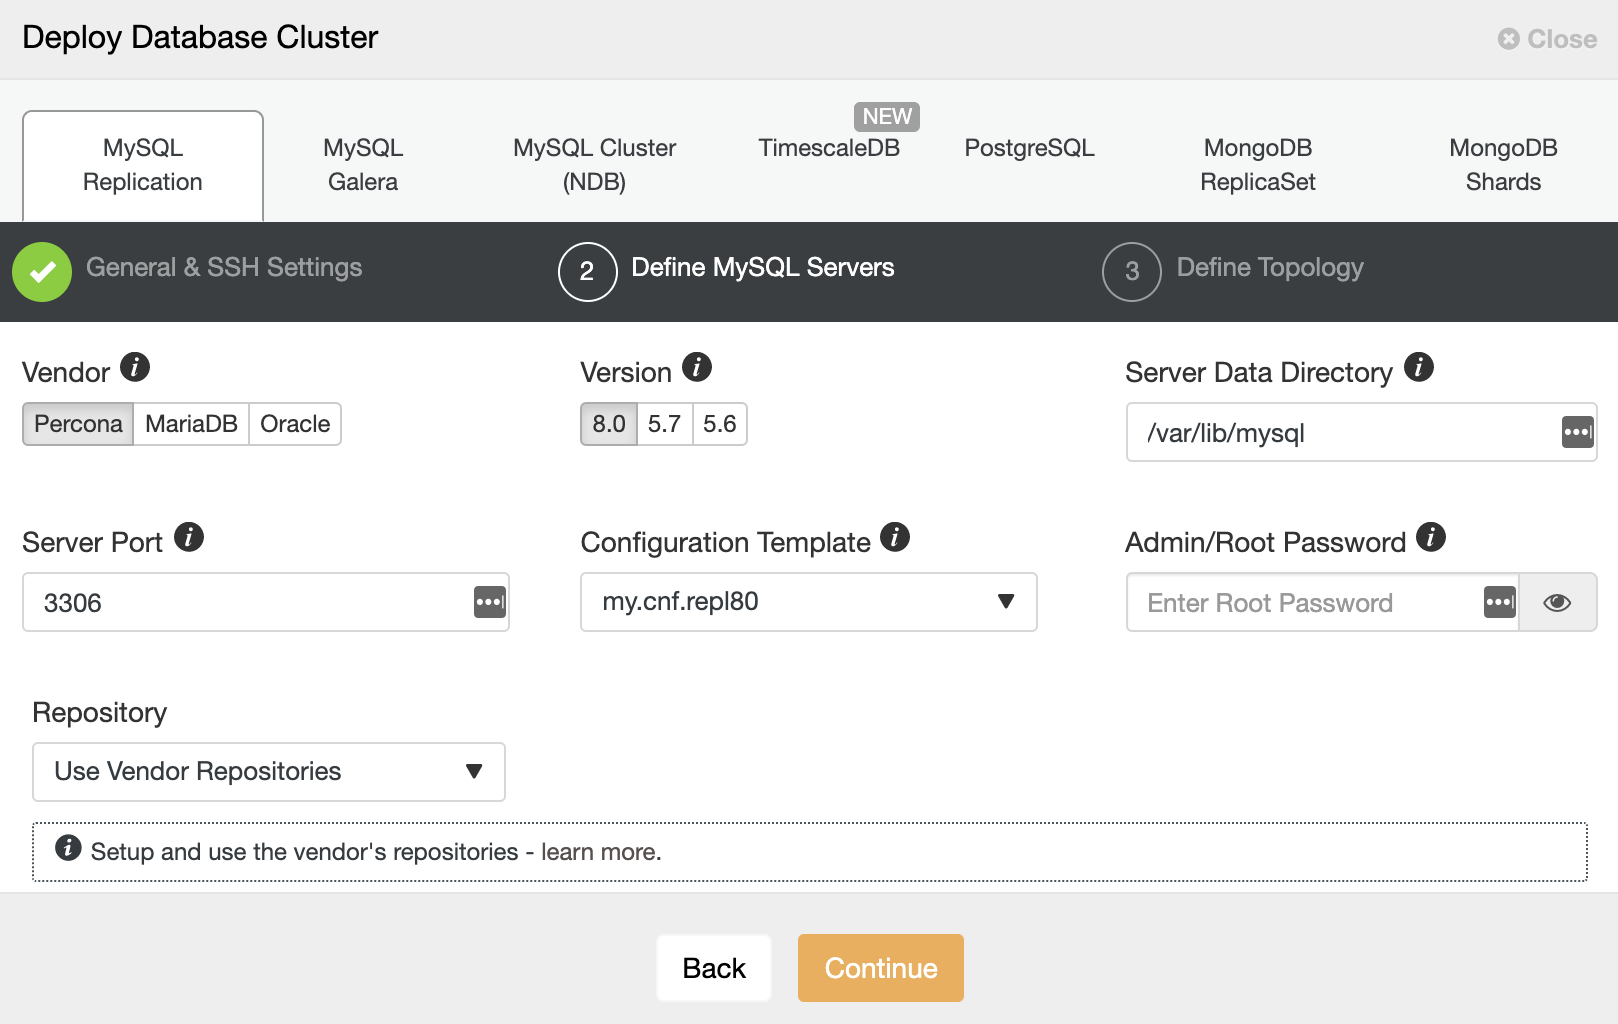
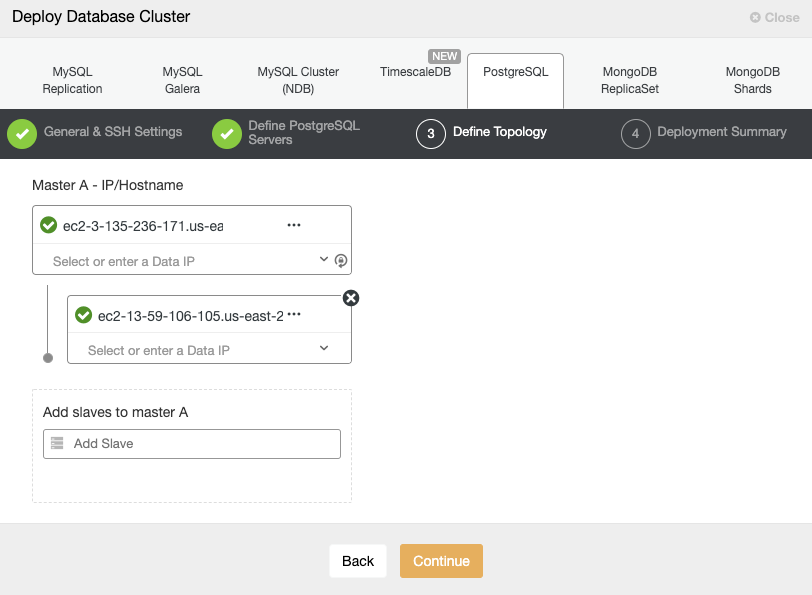
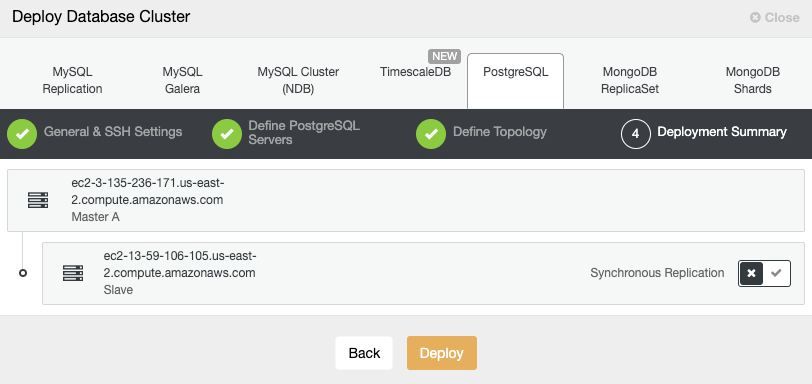
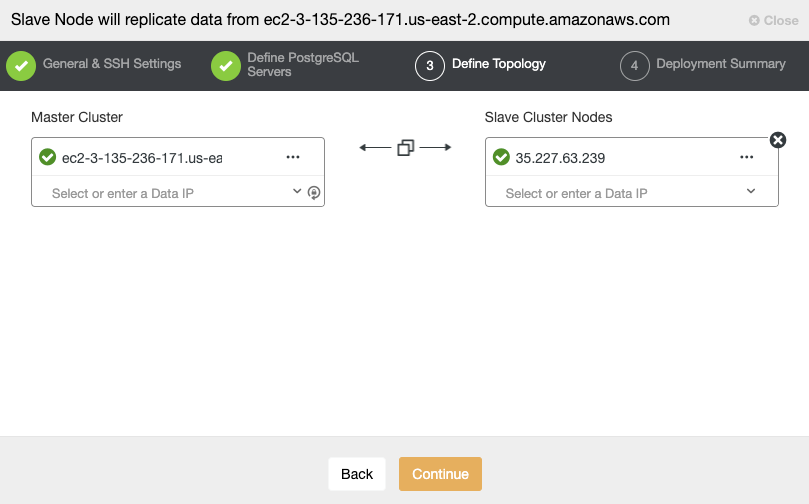
Finally, you must define the topology to be deployed. The available topologies depend on the selected technology.
Monitoring Your Database
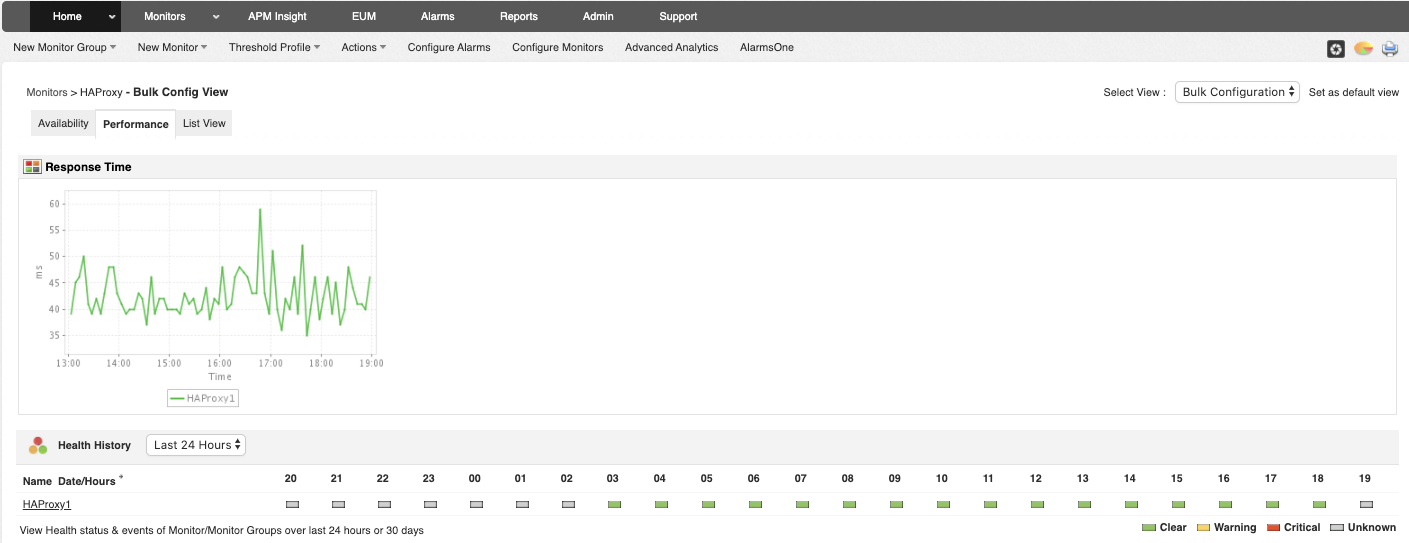
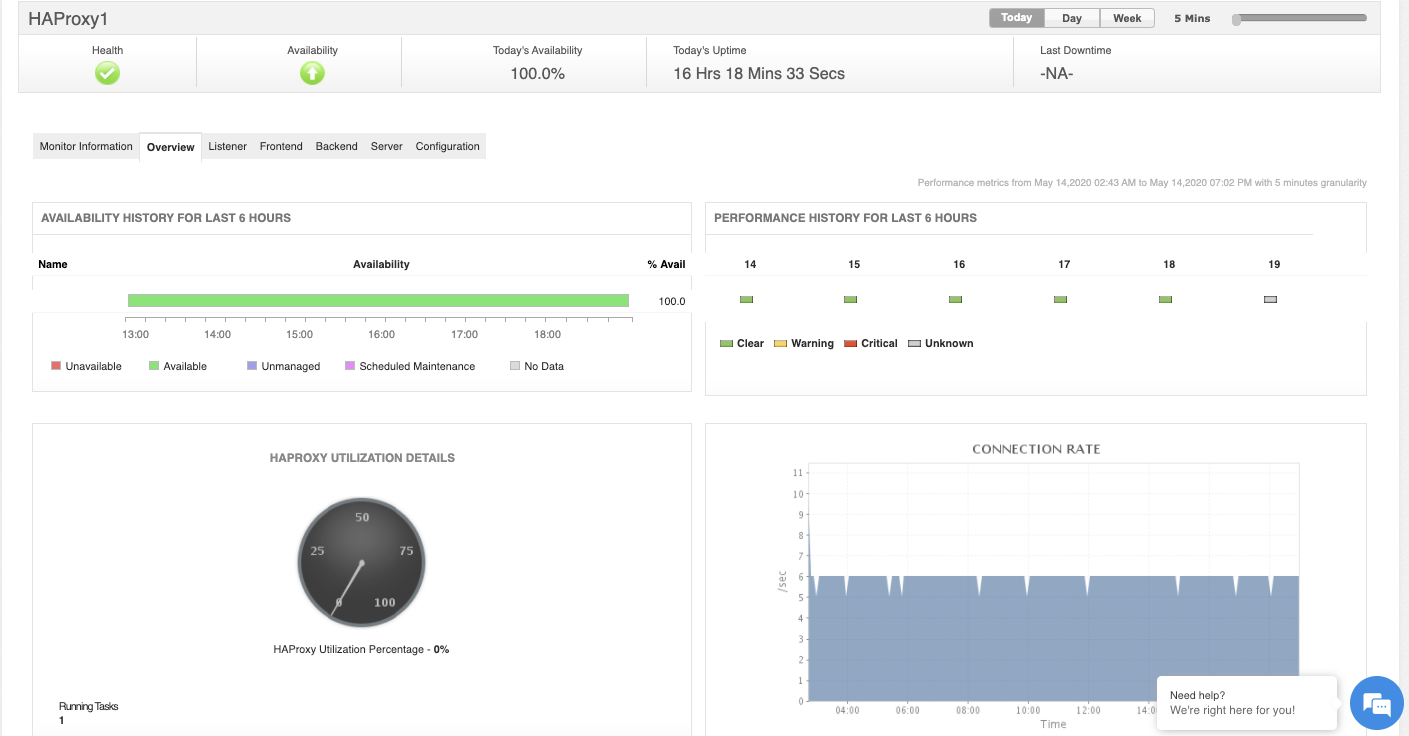
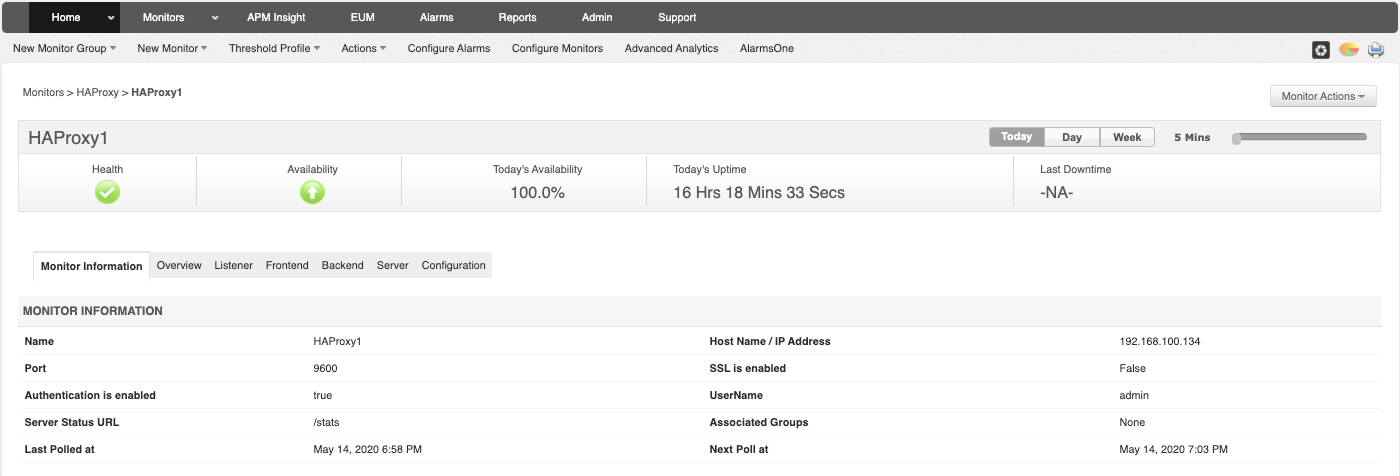
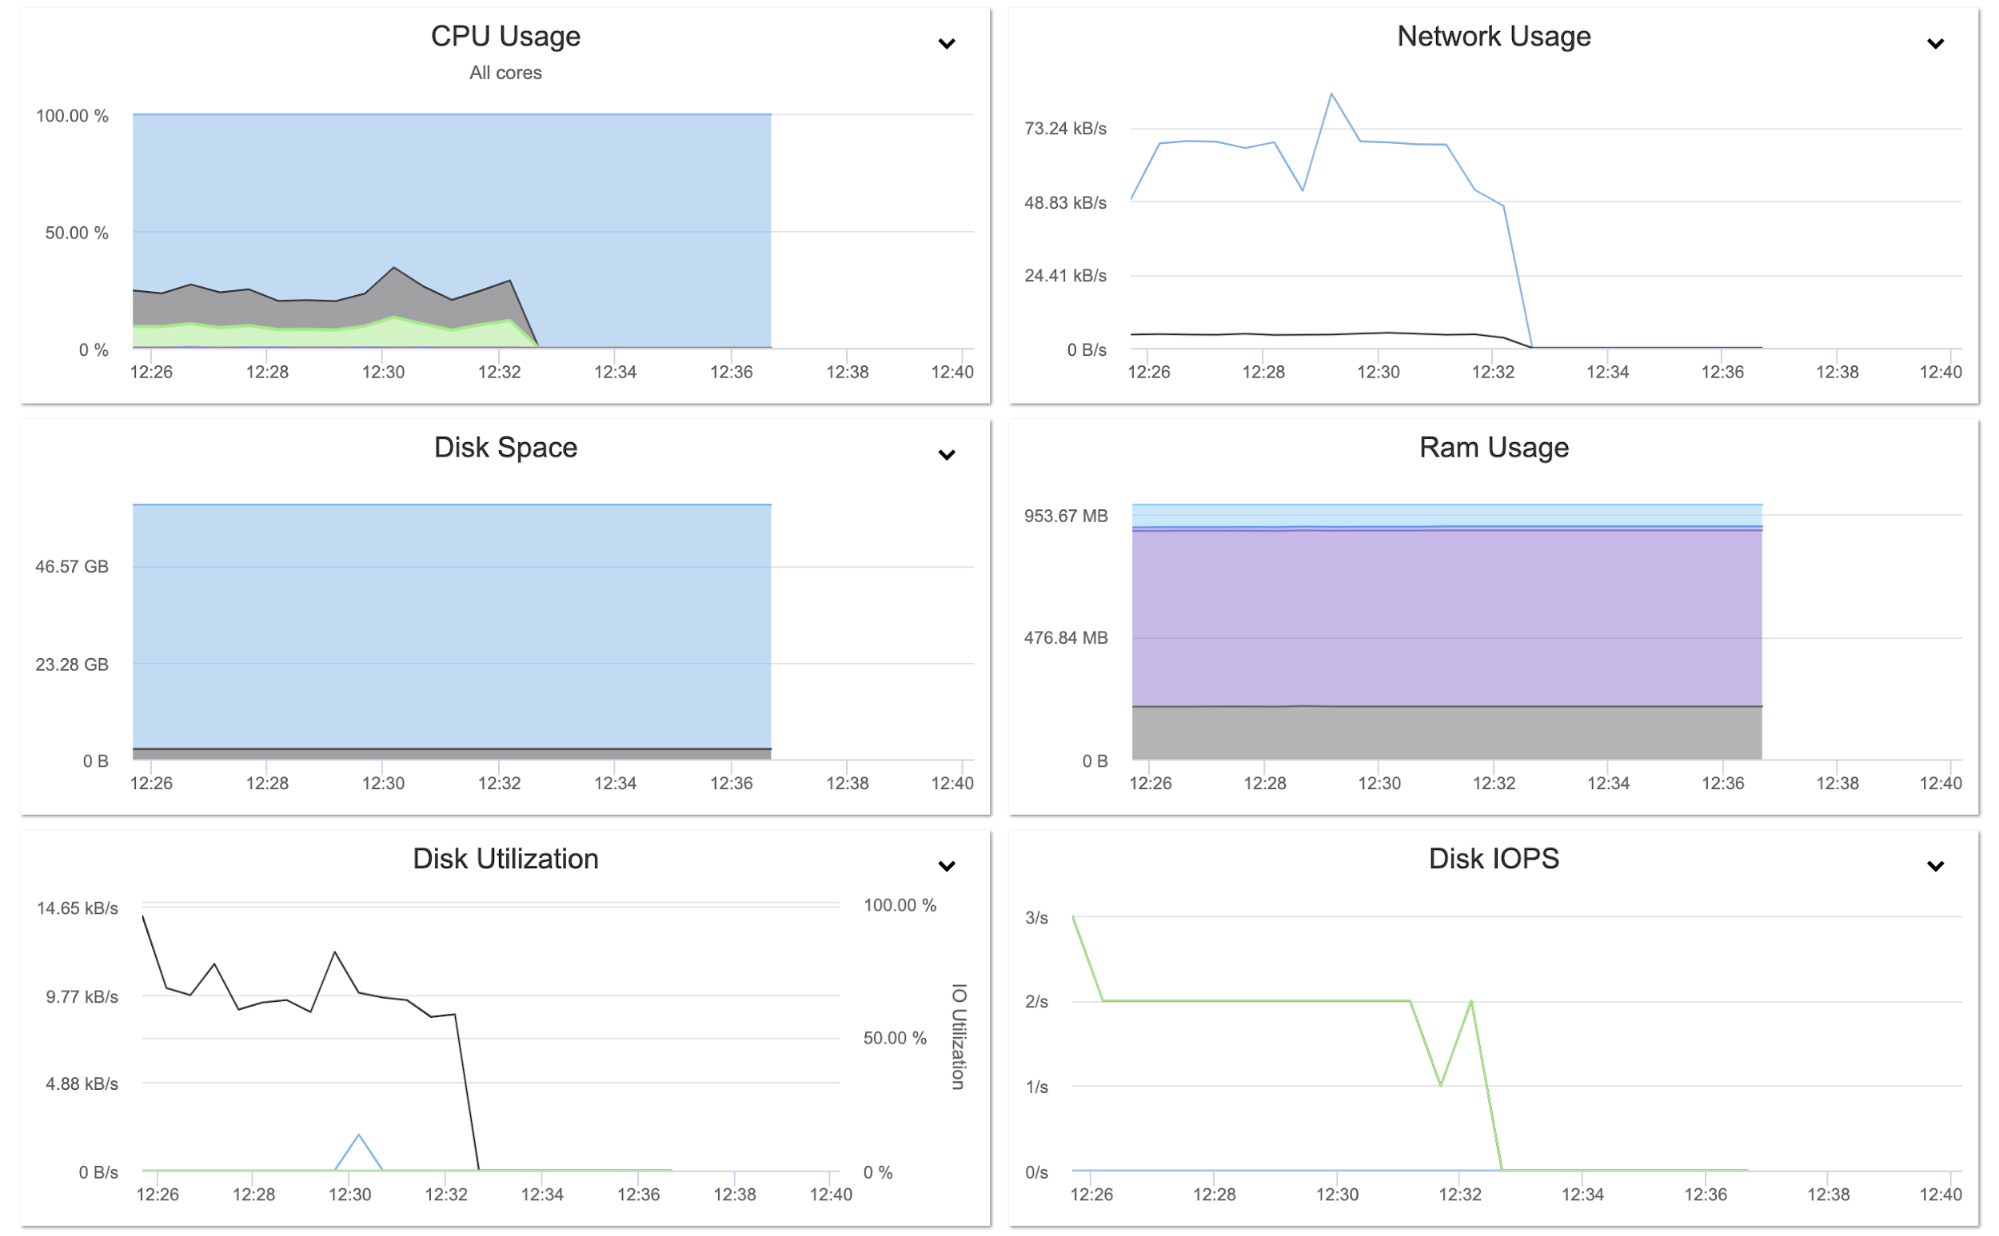
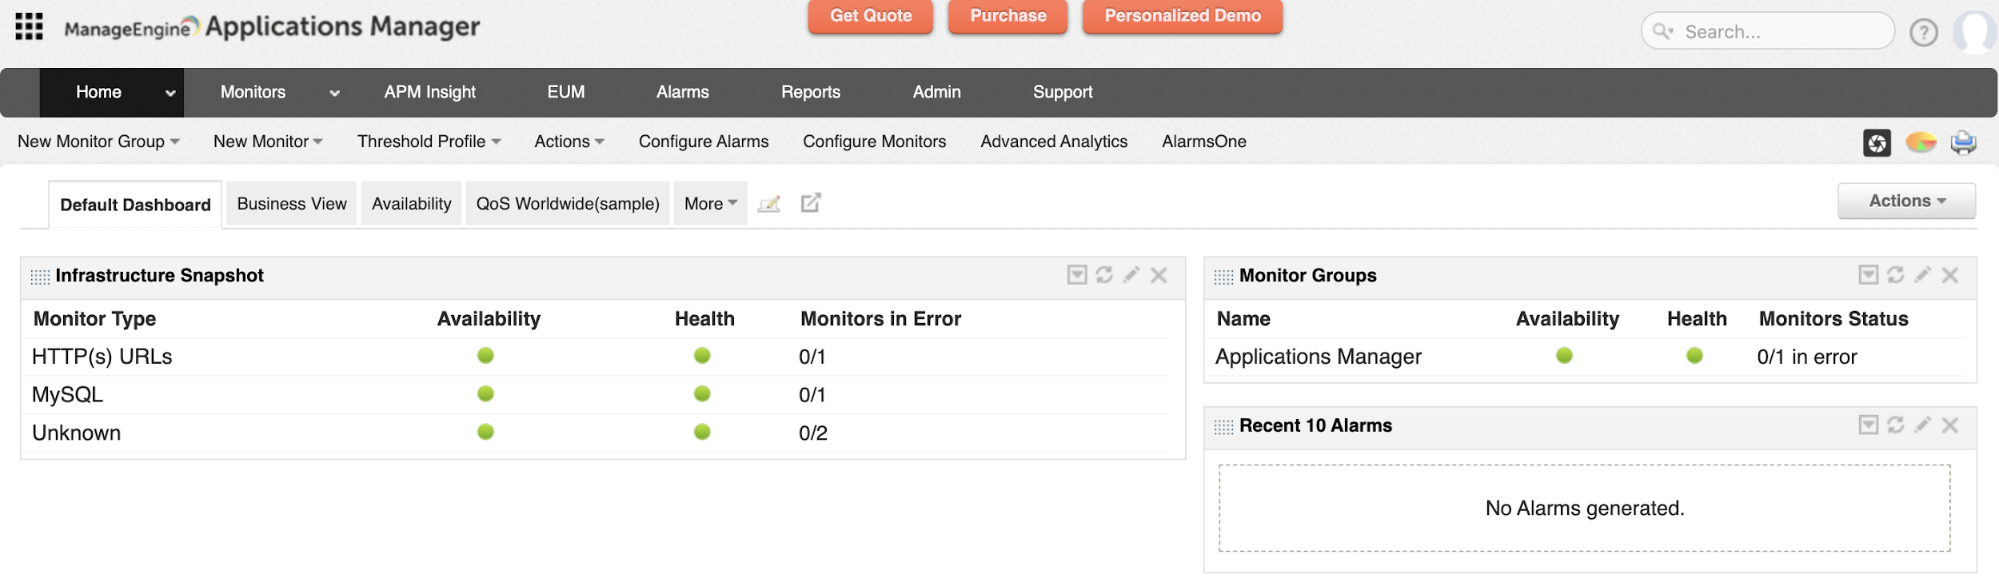
Database Monitoring with Manage Engine Applications Manager
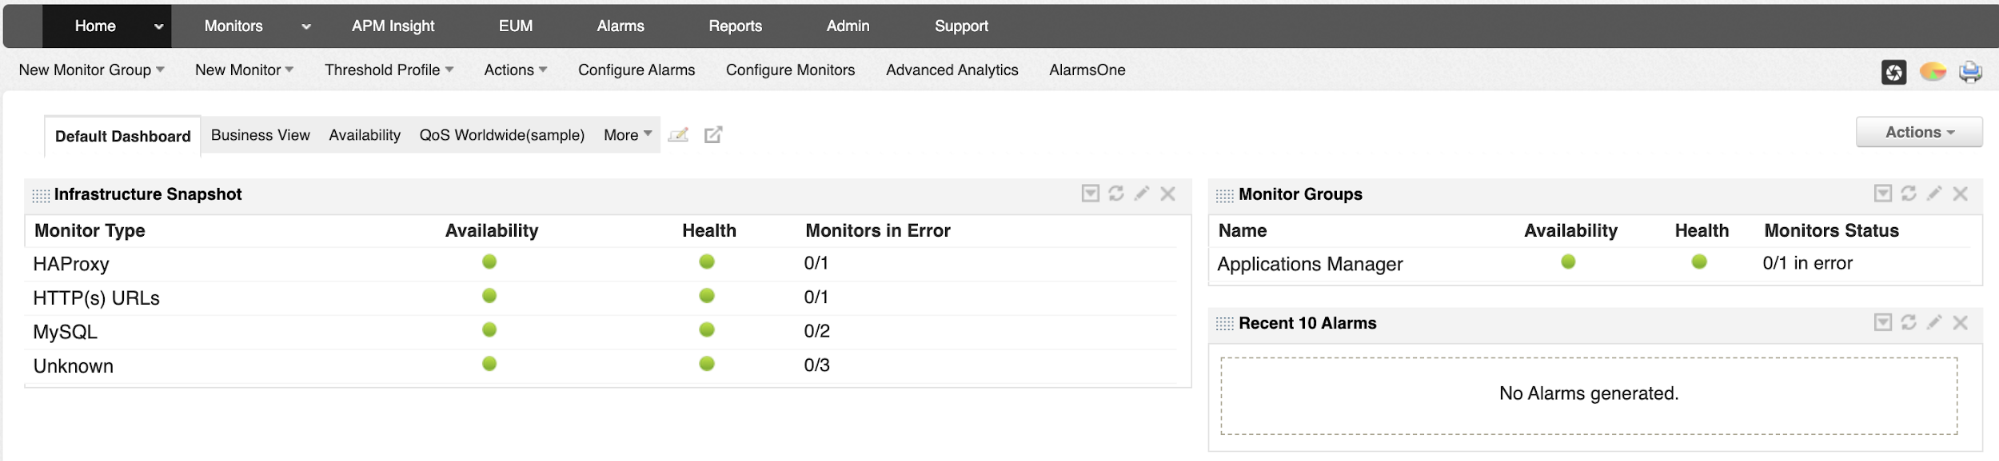
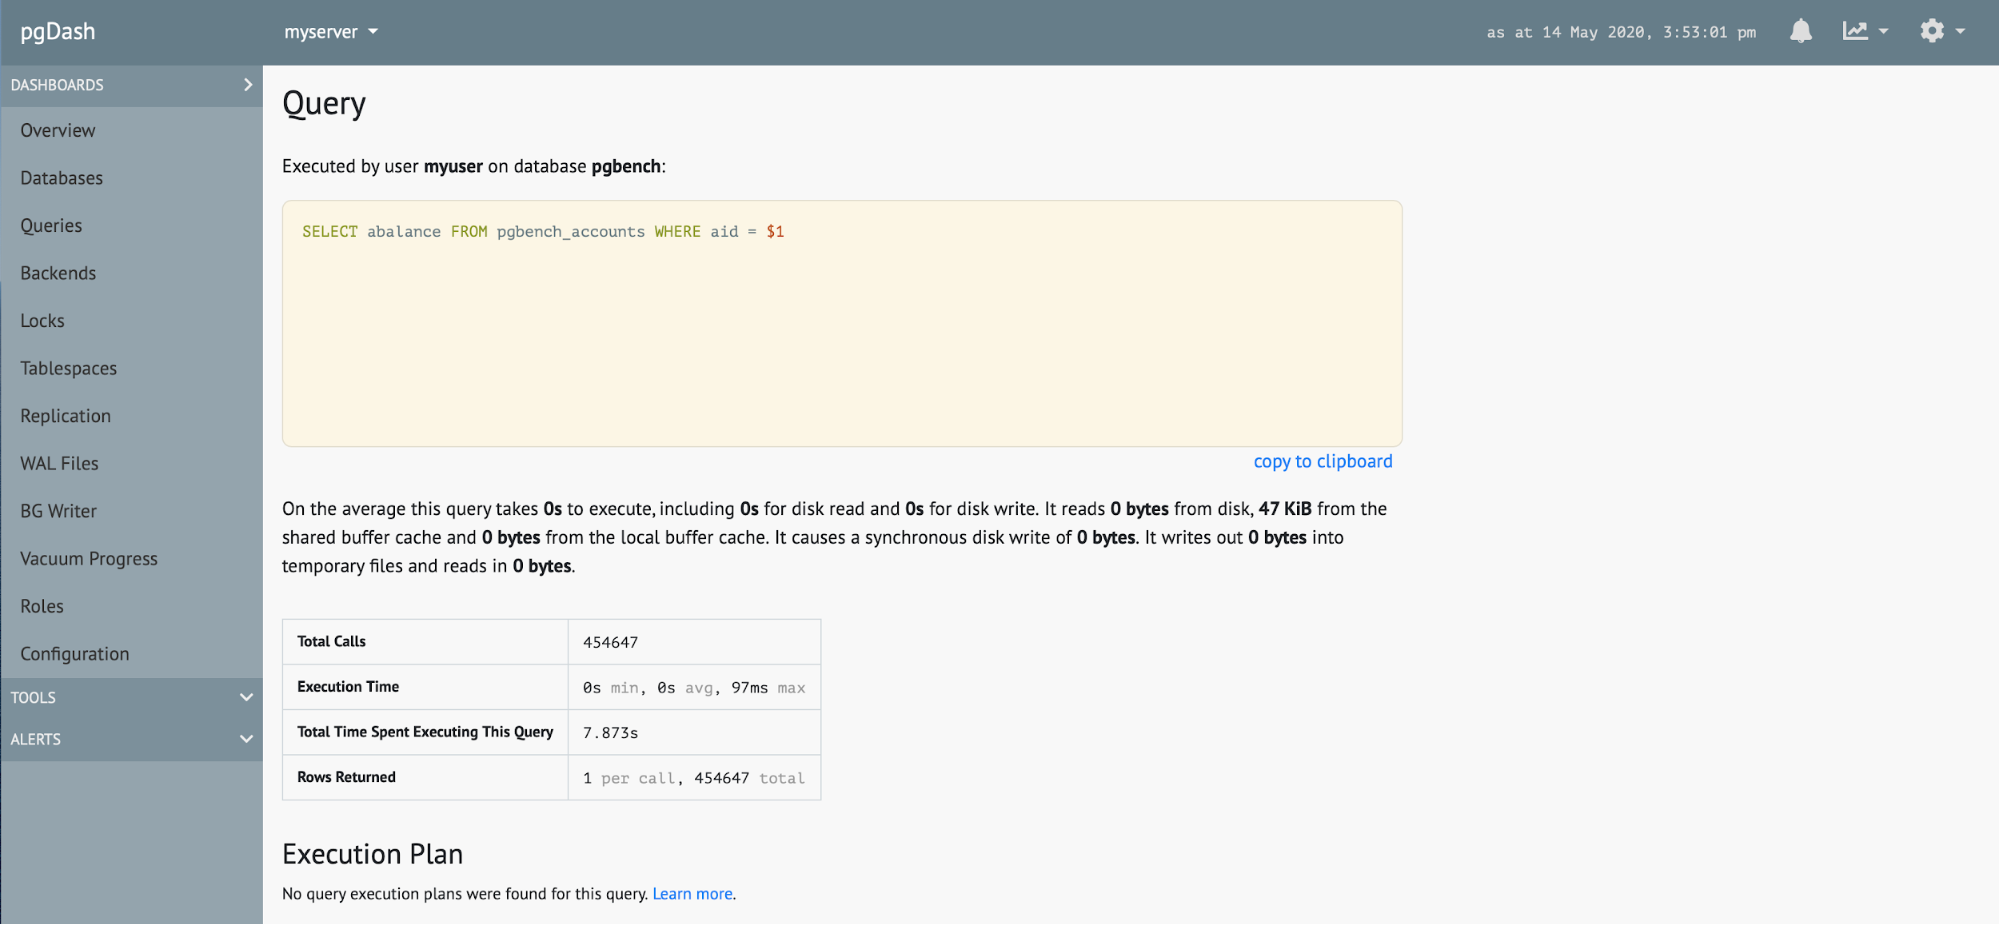
Let’s see an example of monitoring a MySQL database. In this case, you can see first, an overview of the database node, with some basic metrics.
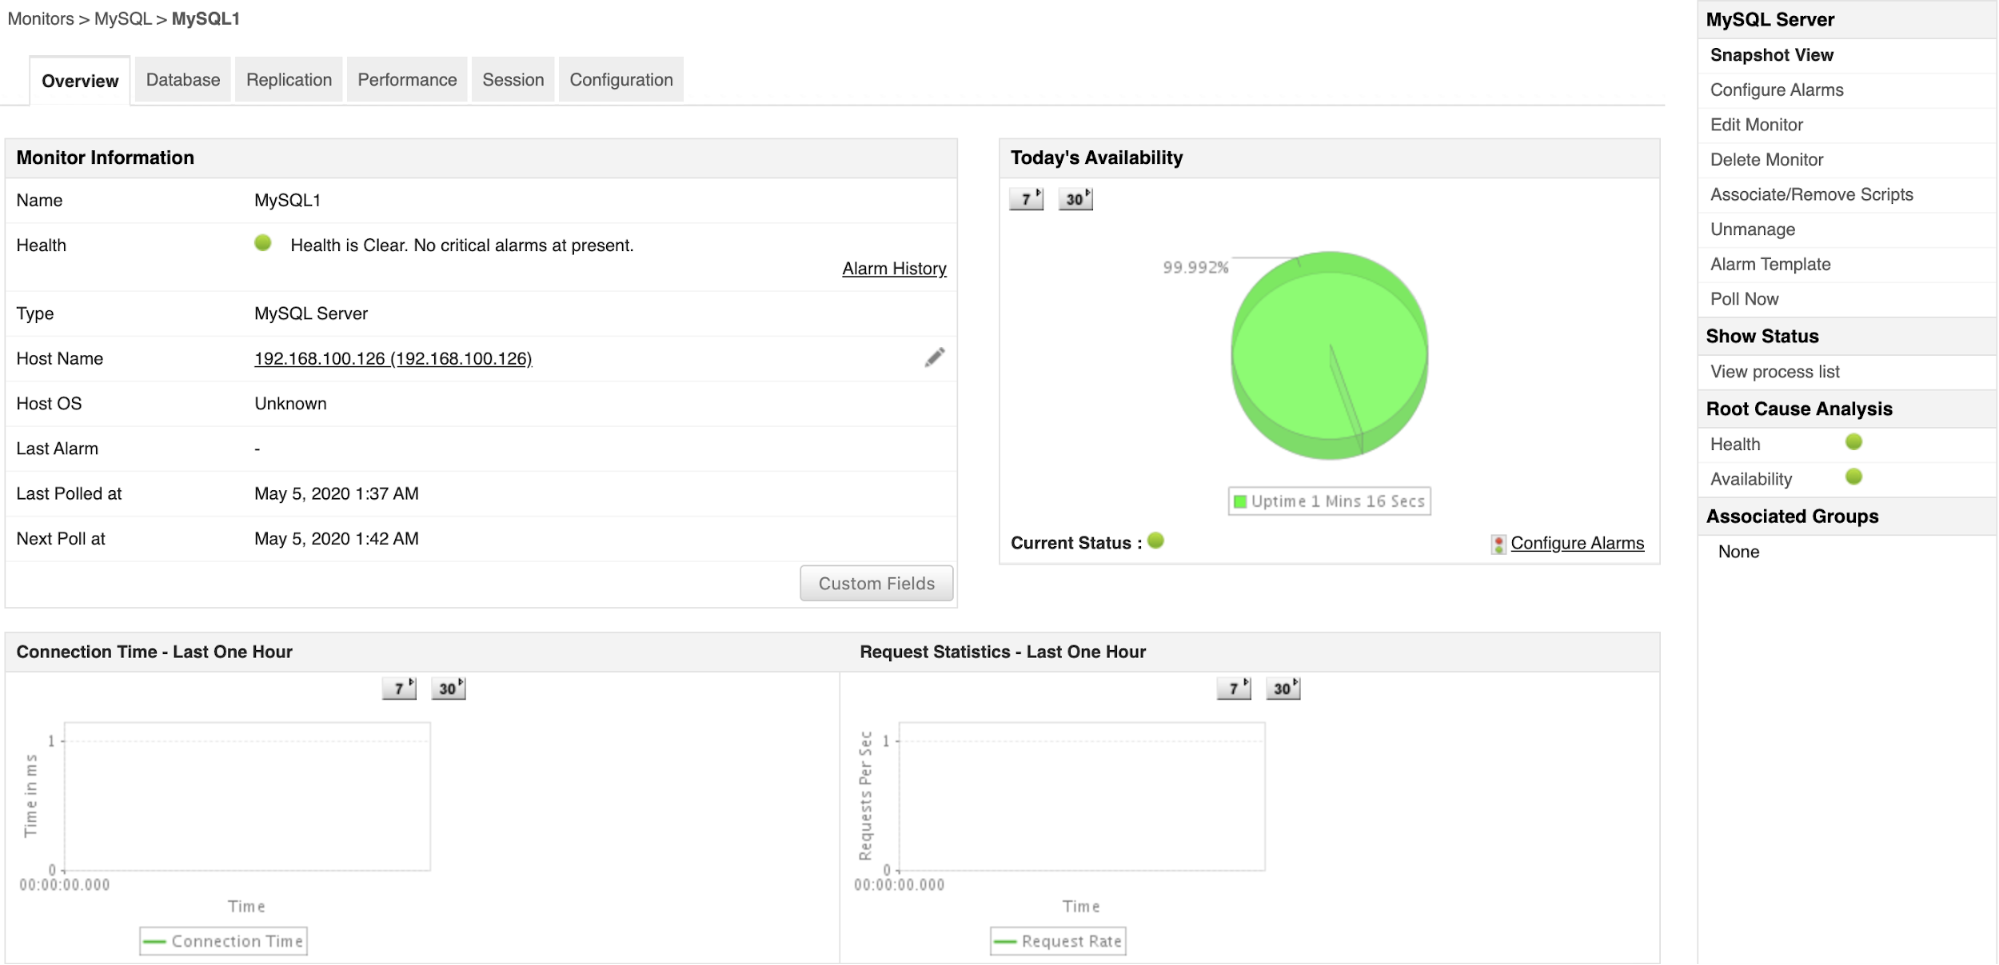
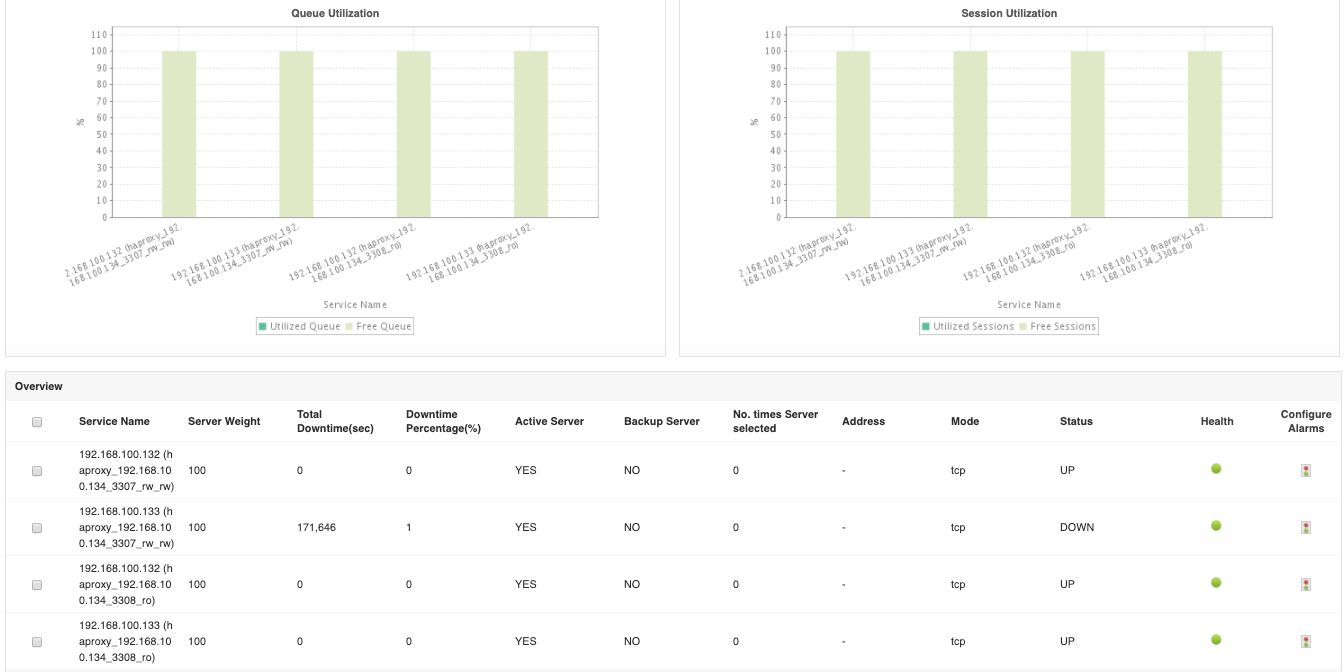
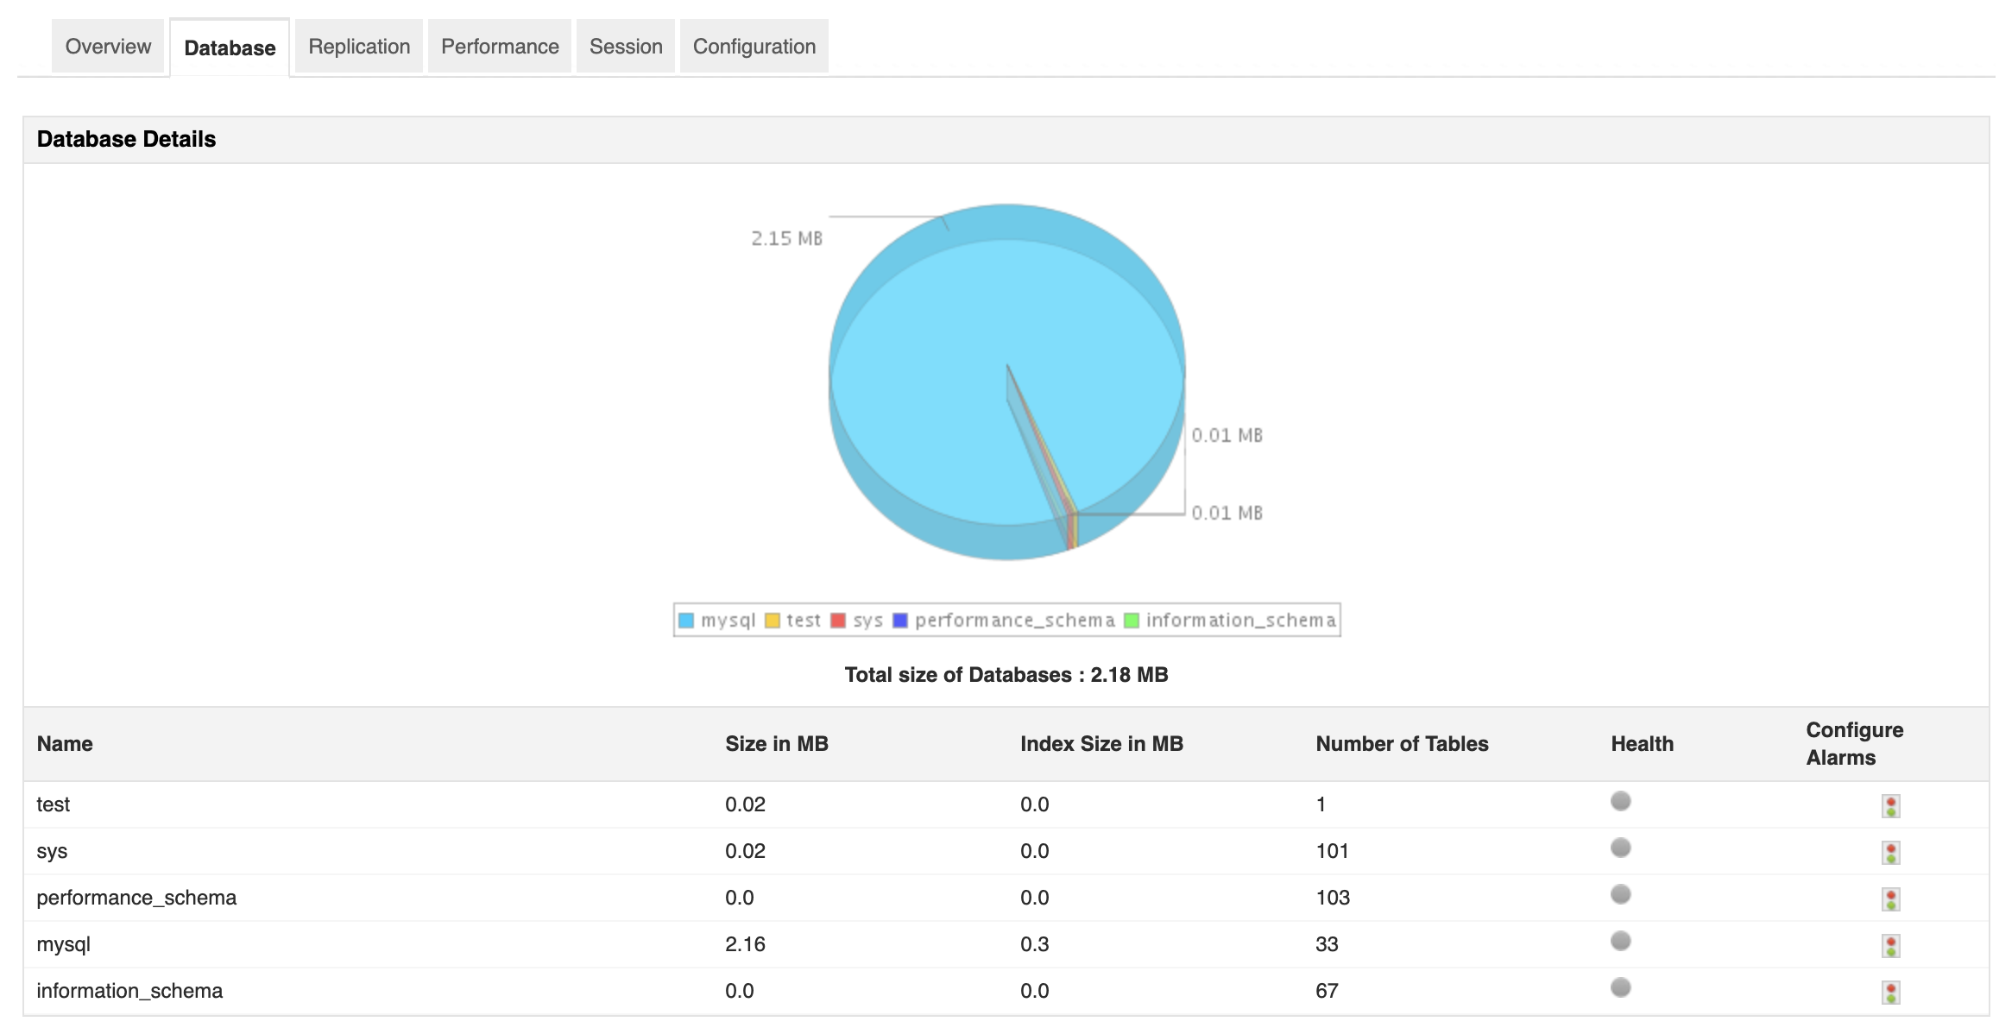
You can go to the Database tab, to see specific information about the database that you’re monitoring:
If you take a look at the Replication section, in this case, it says “Replication is not enabled”:
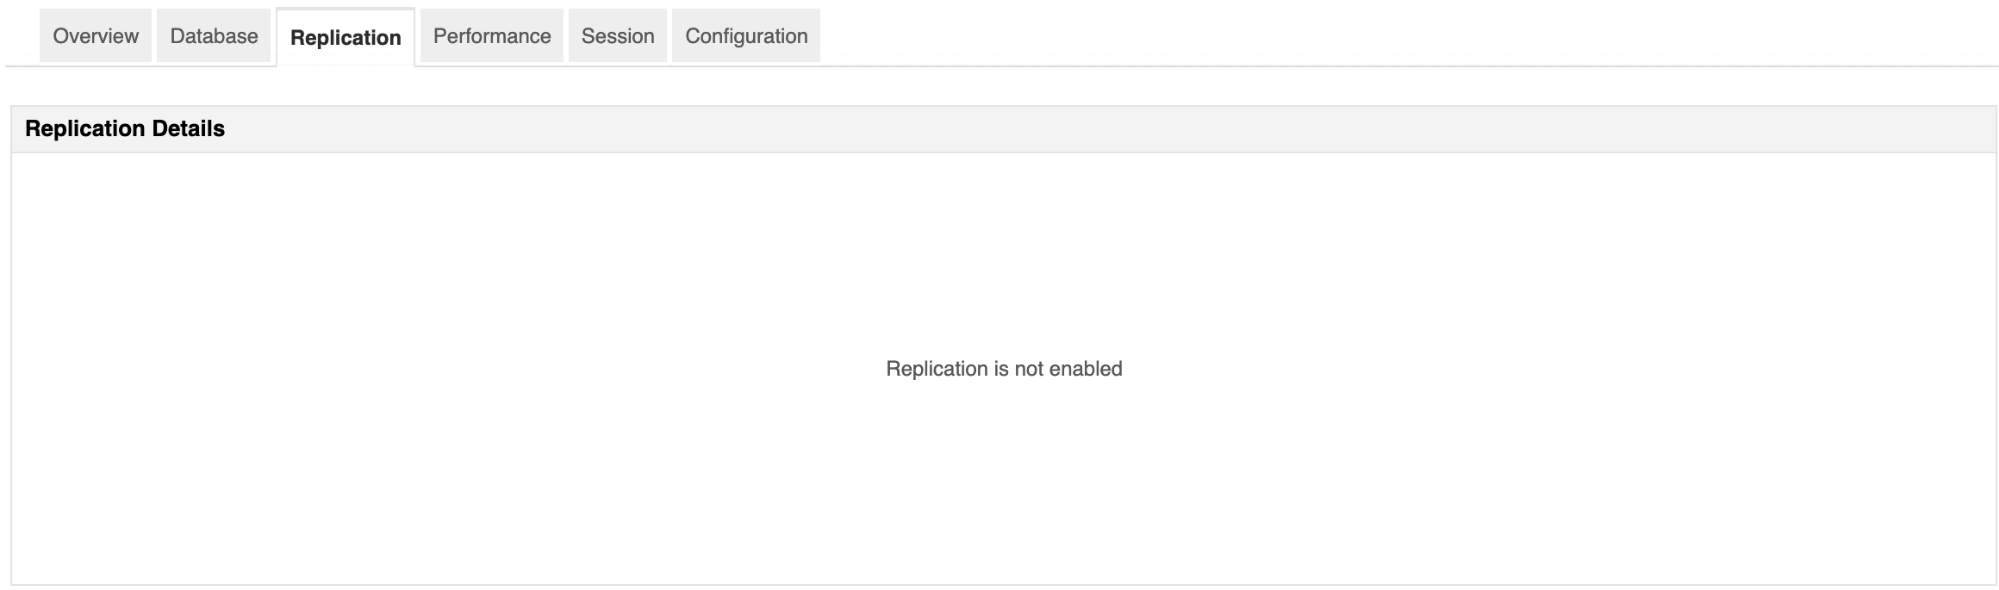
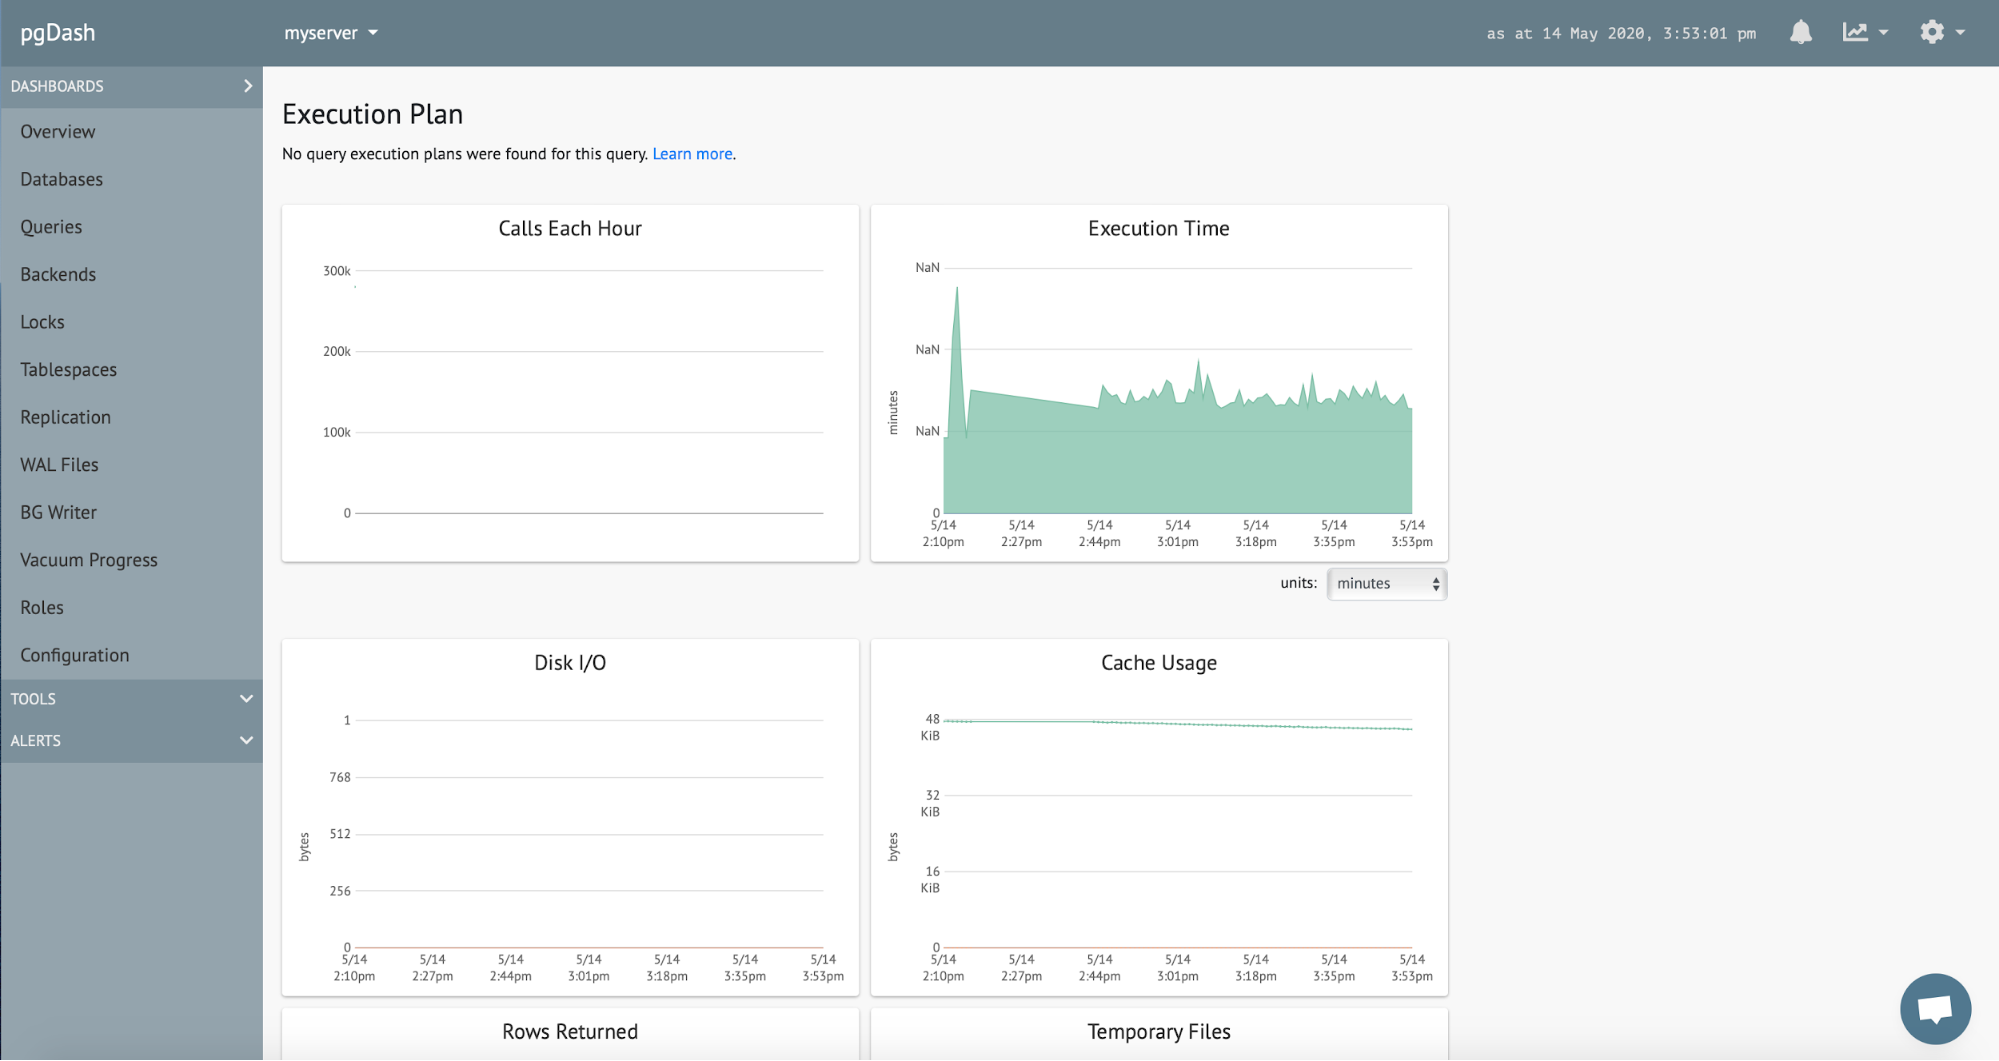
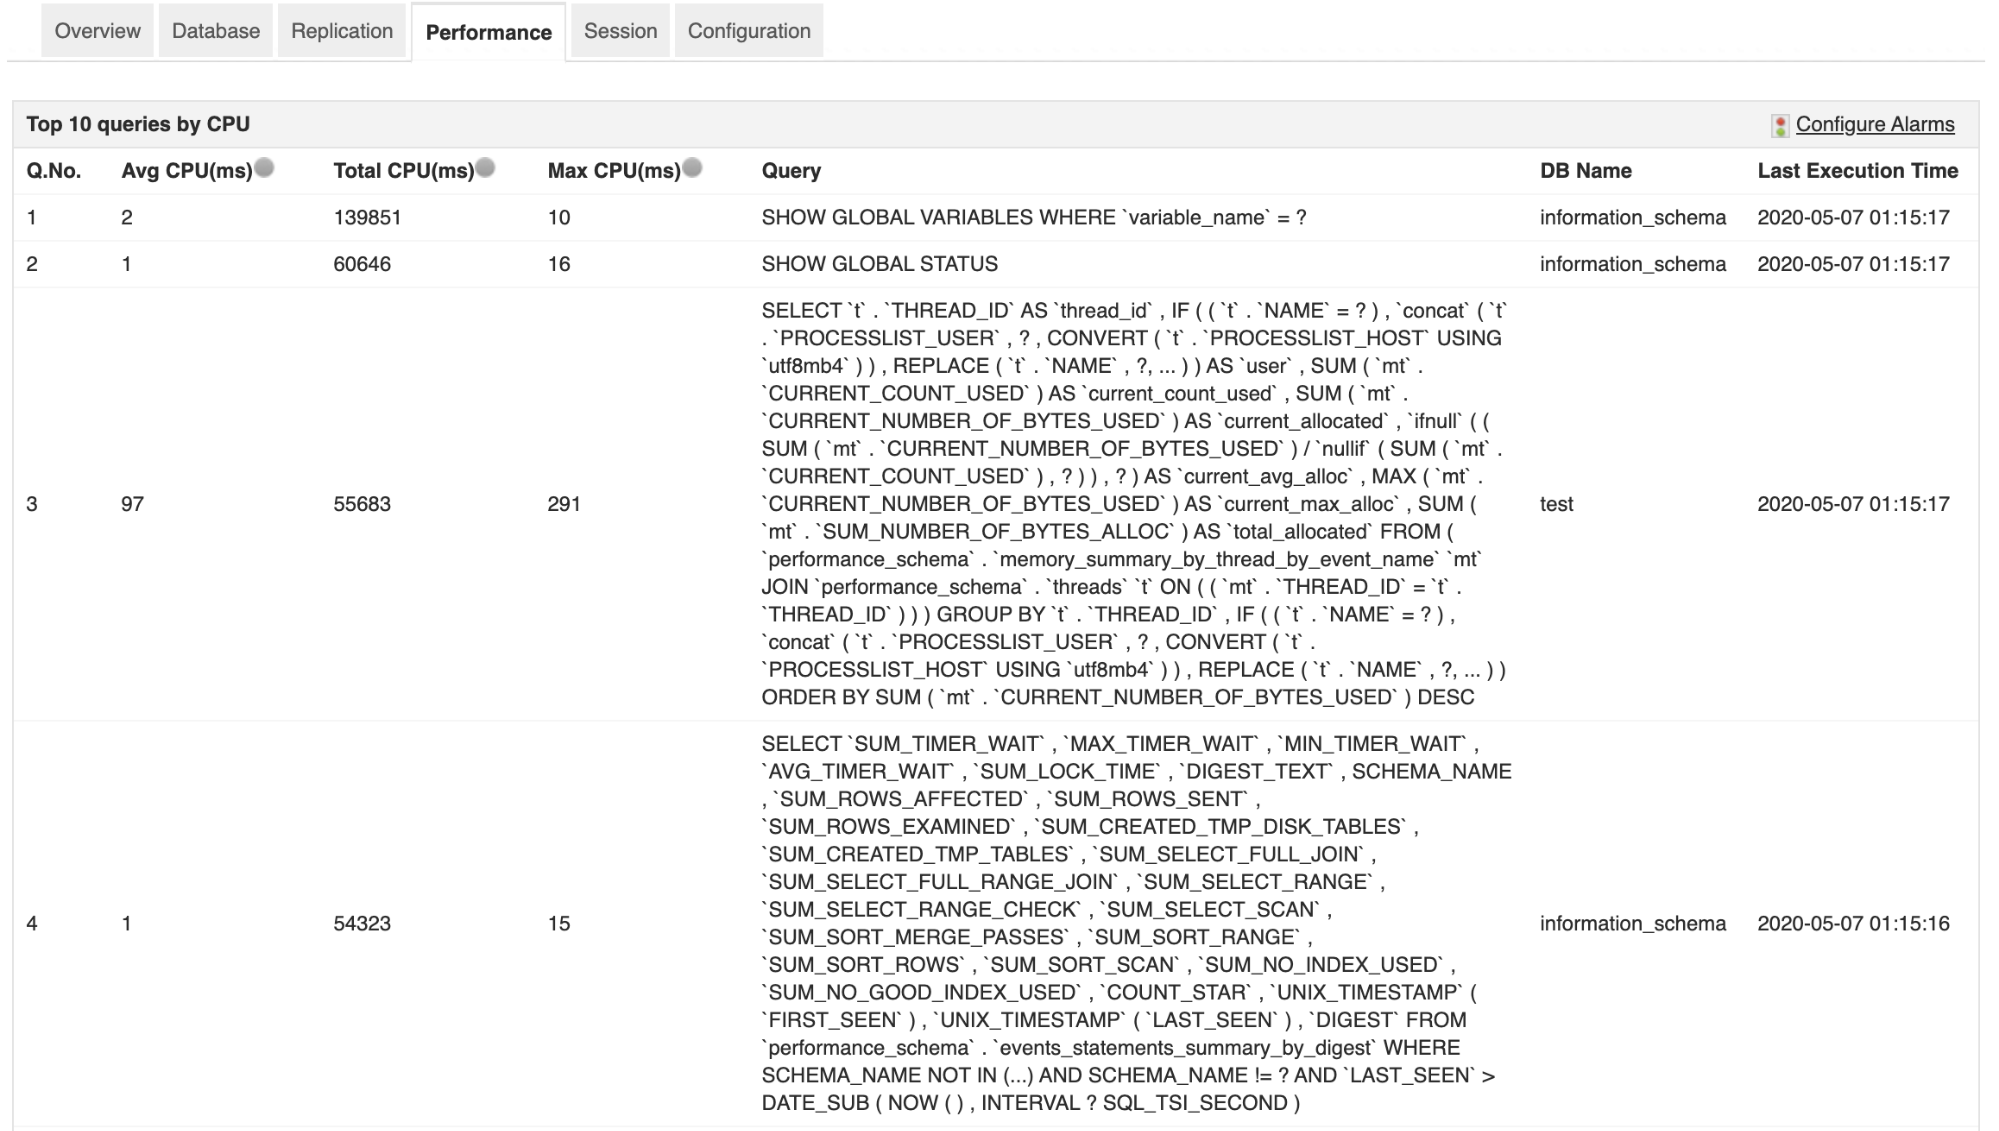
But actually, there is a master-slave replication up and running... There is nothing related to this issue in the documentation, so, as it’s not working, let’s continue to the following section: “Performance”, where you’ll have a list of the top queries.
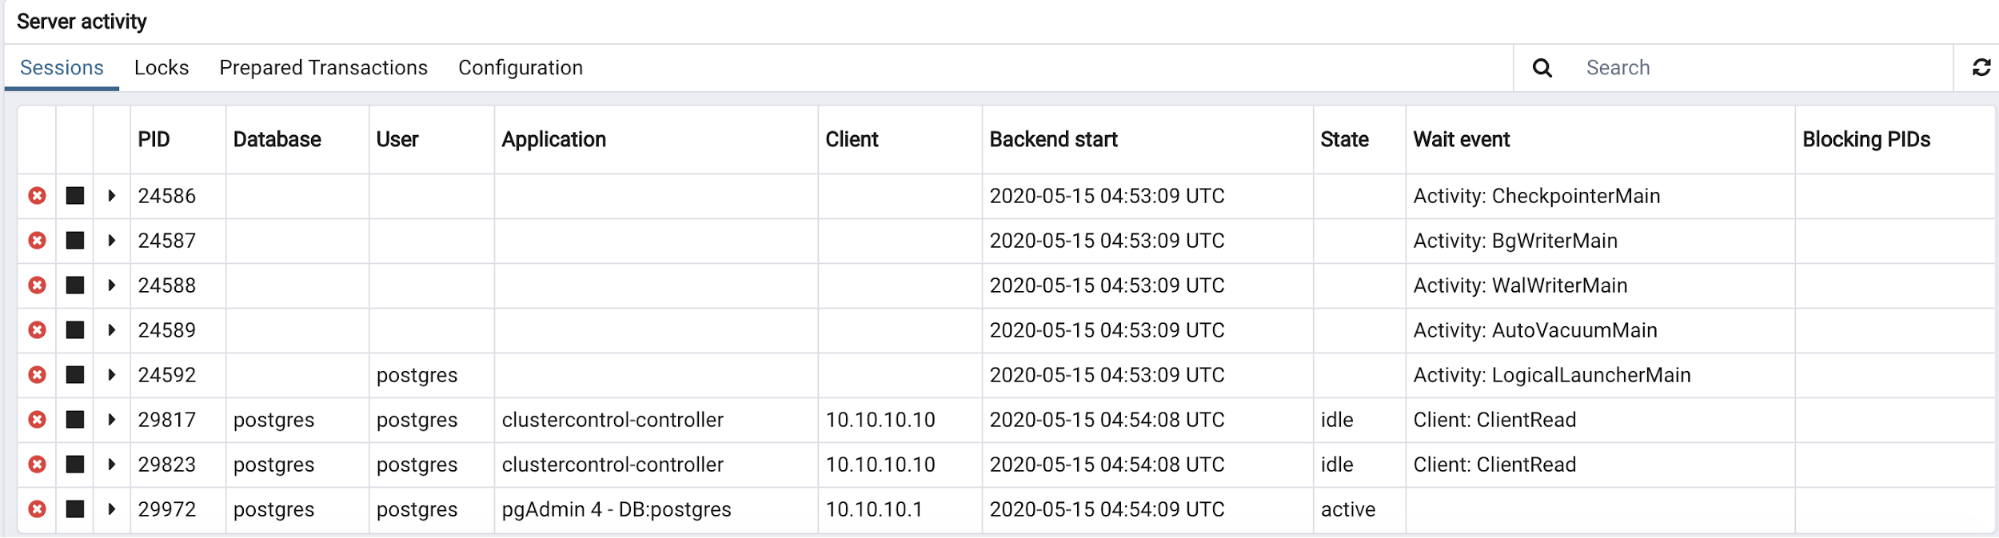
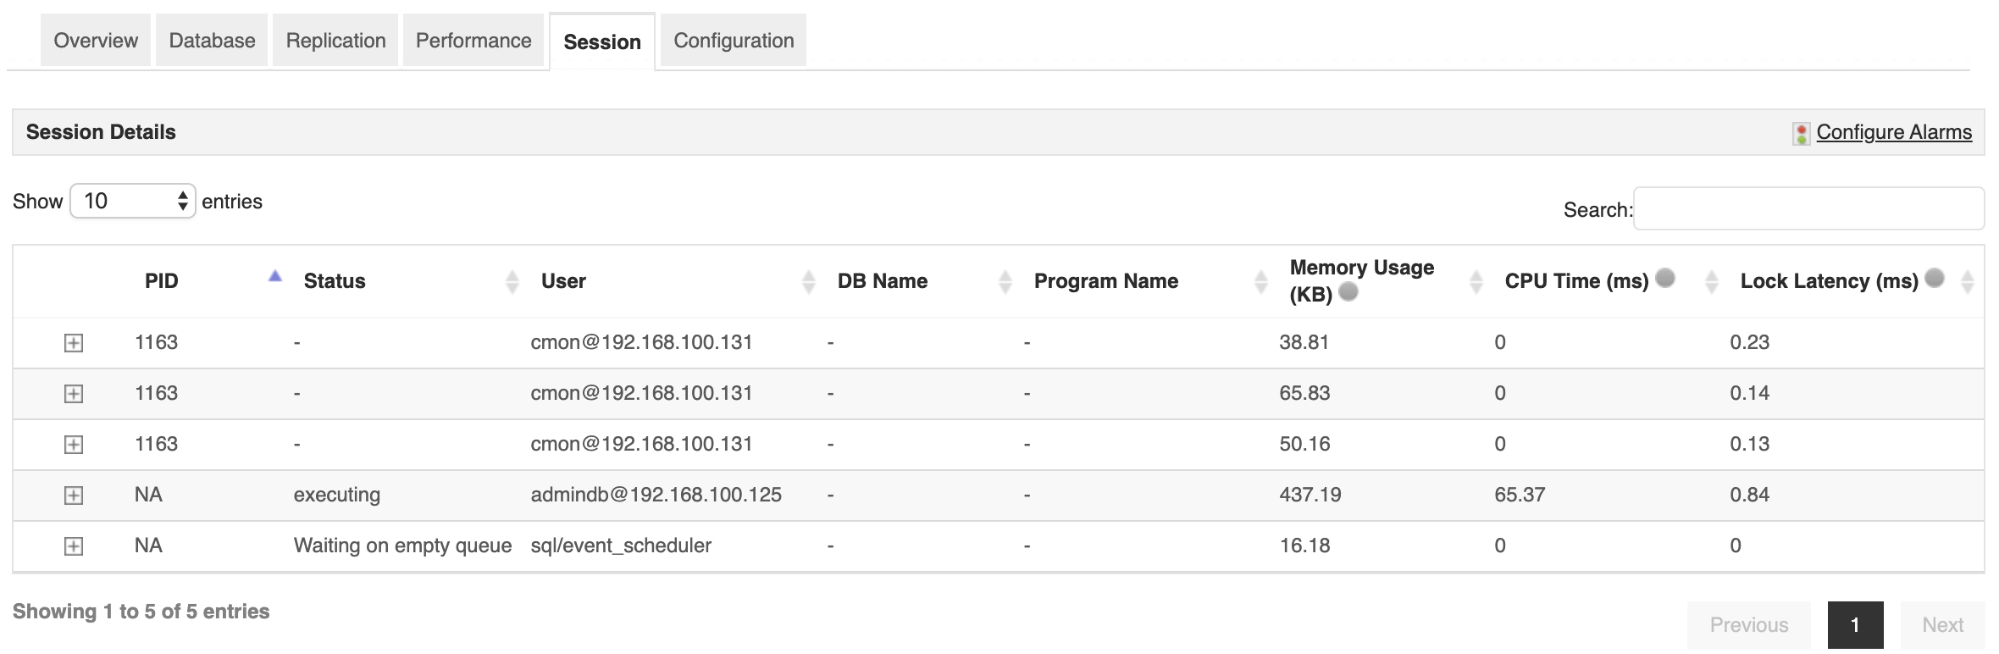
Then, the “Session” section, where you’ll have the current sessions:
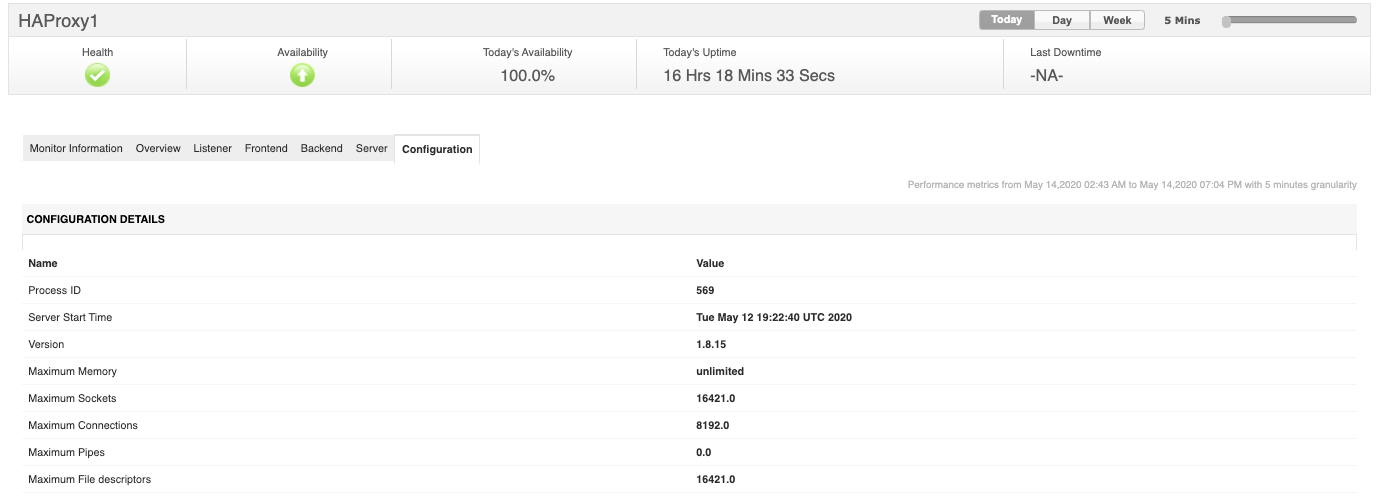
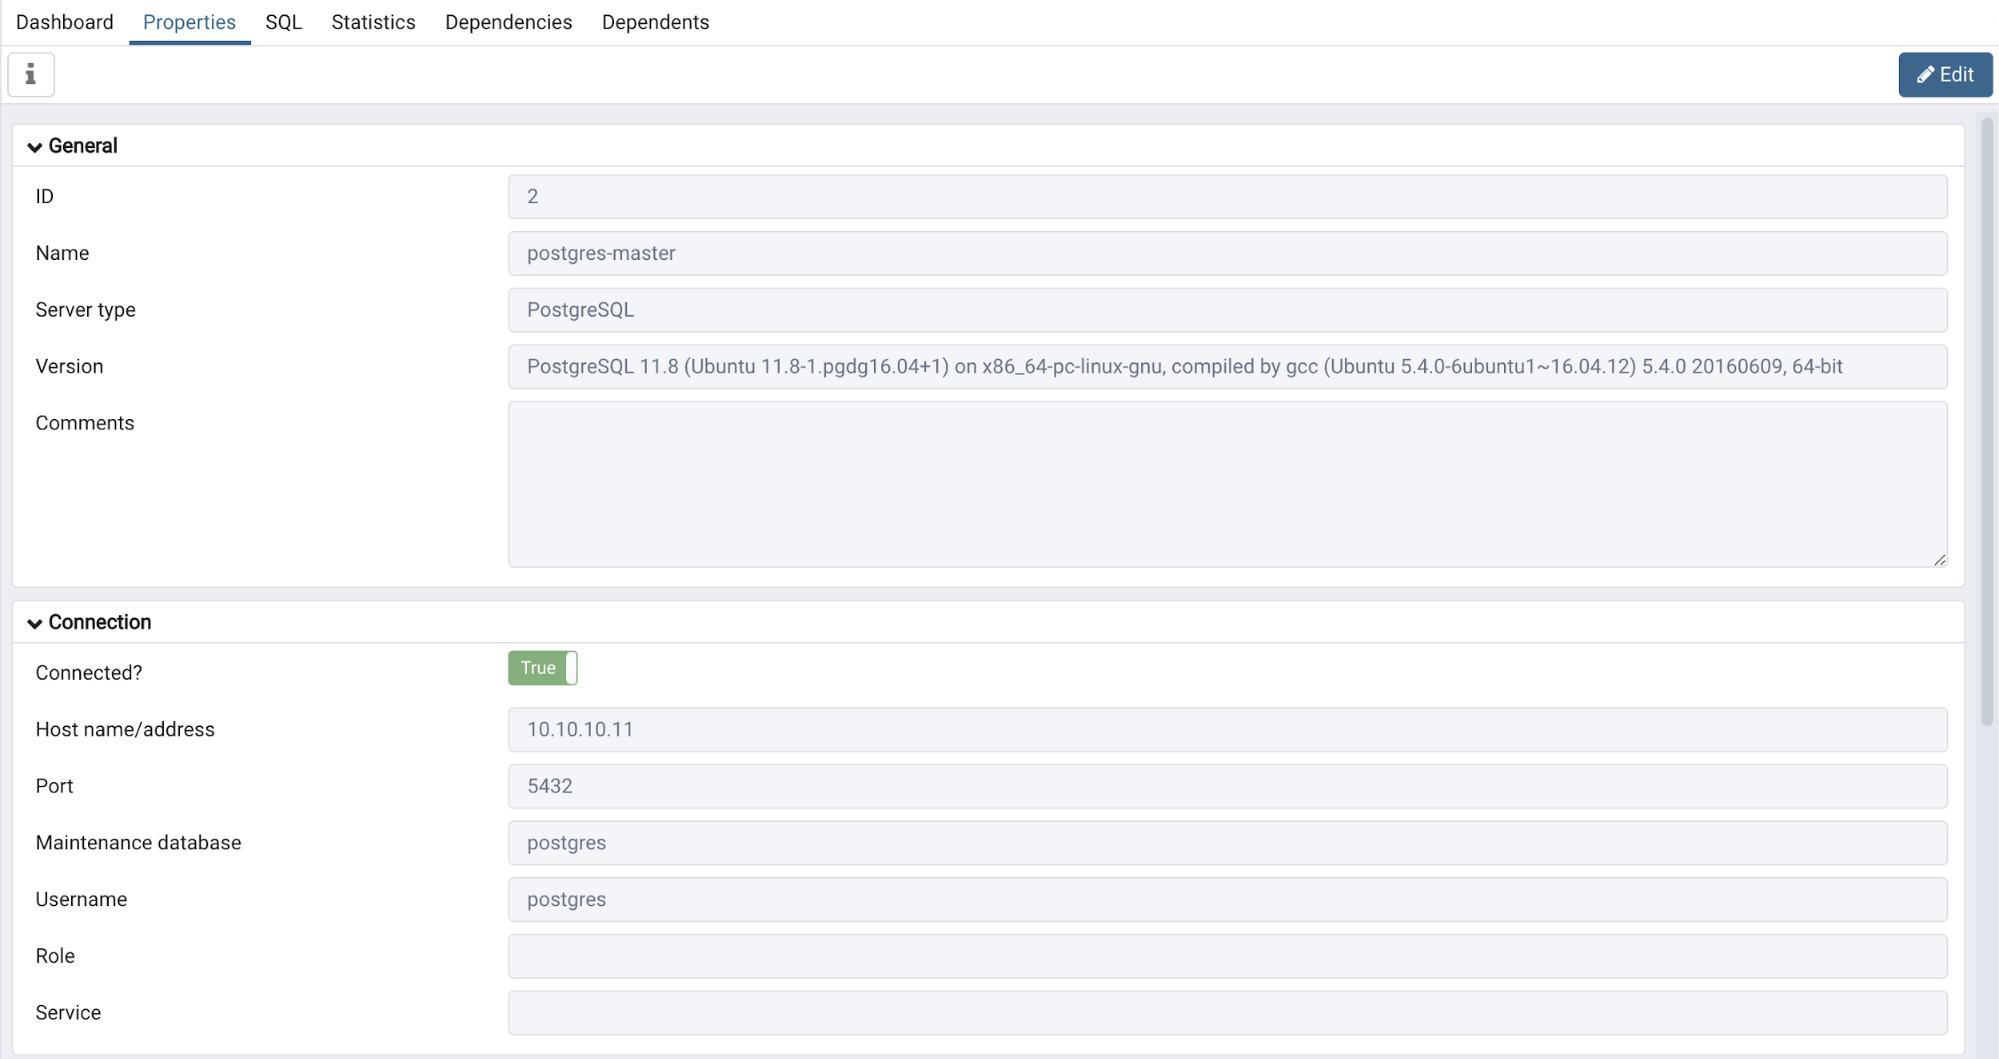
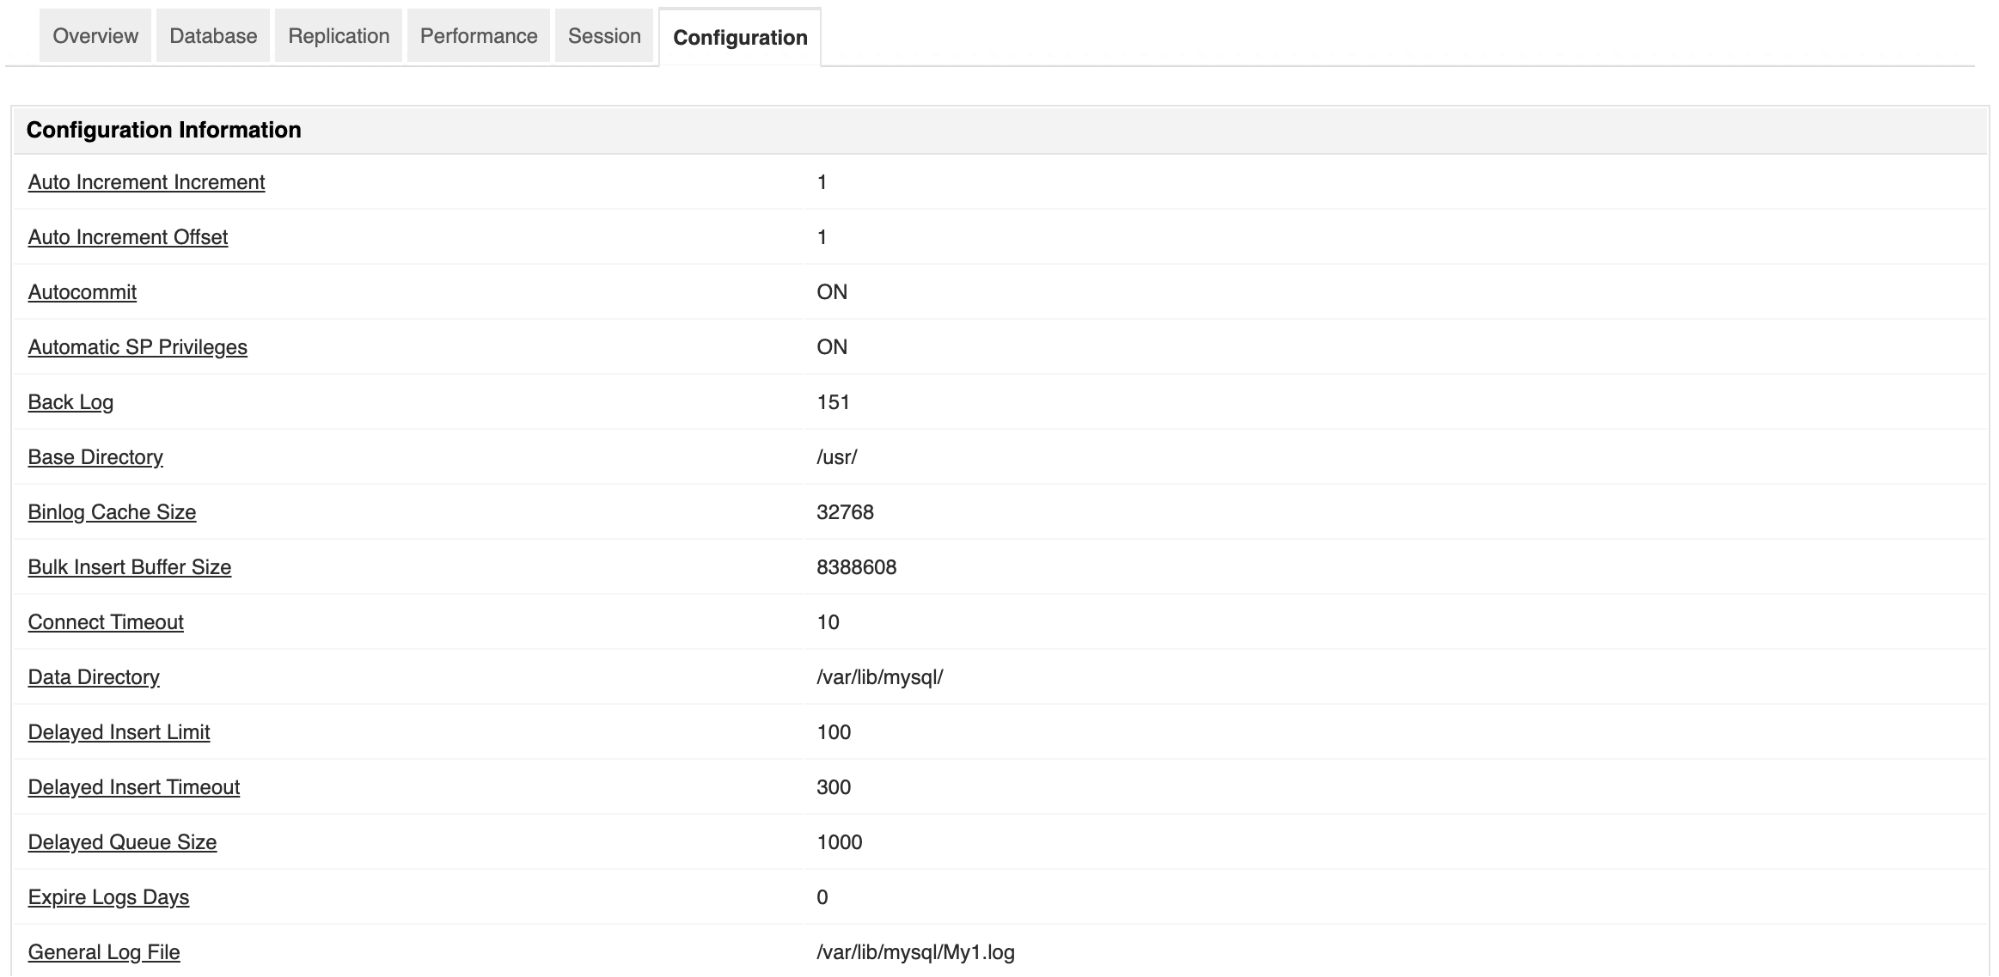
And finally, information about the database configuration:
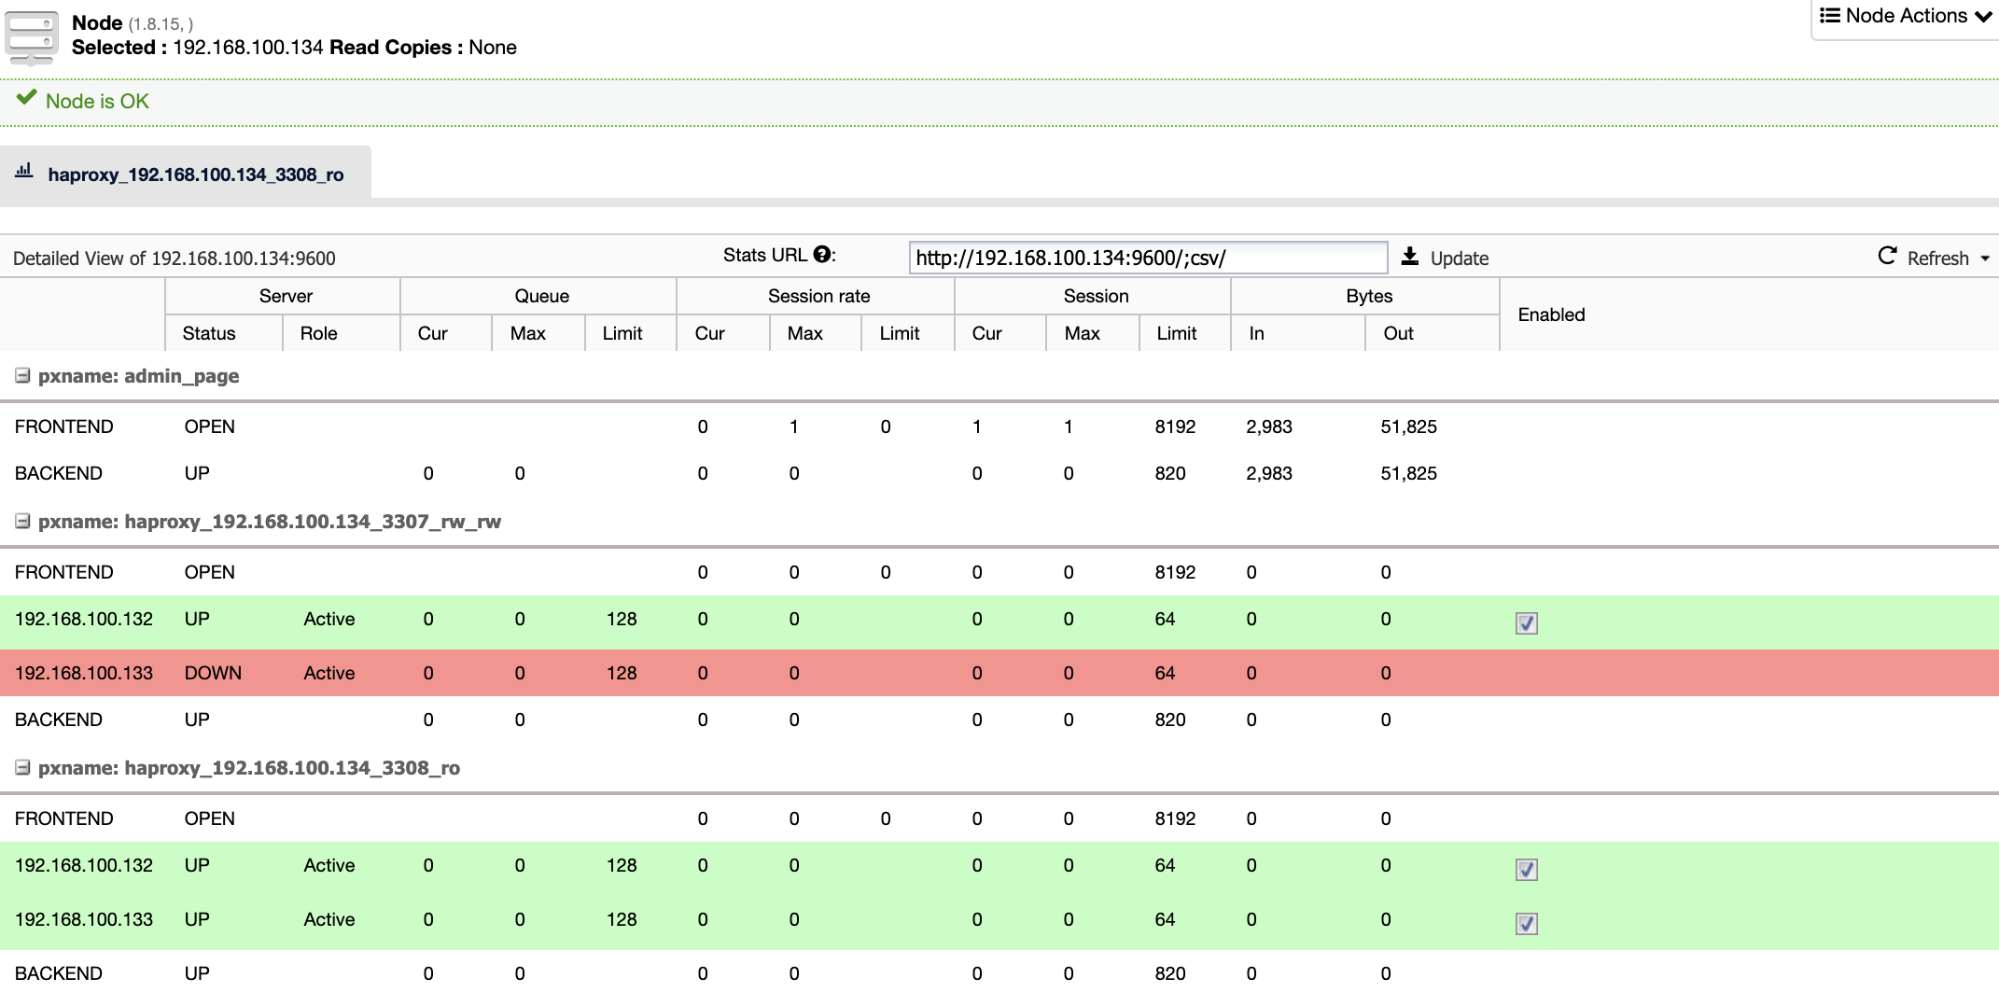
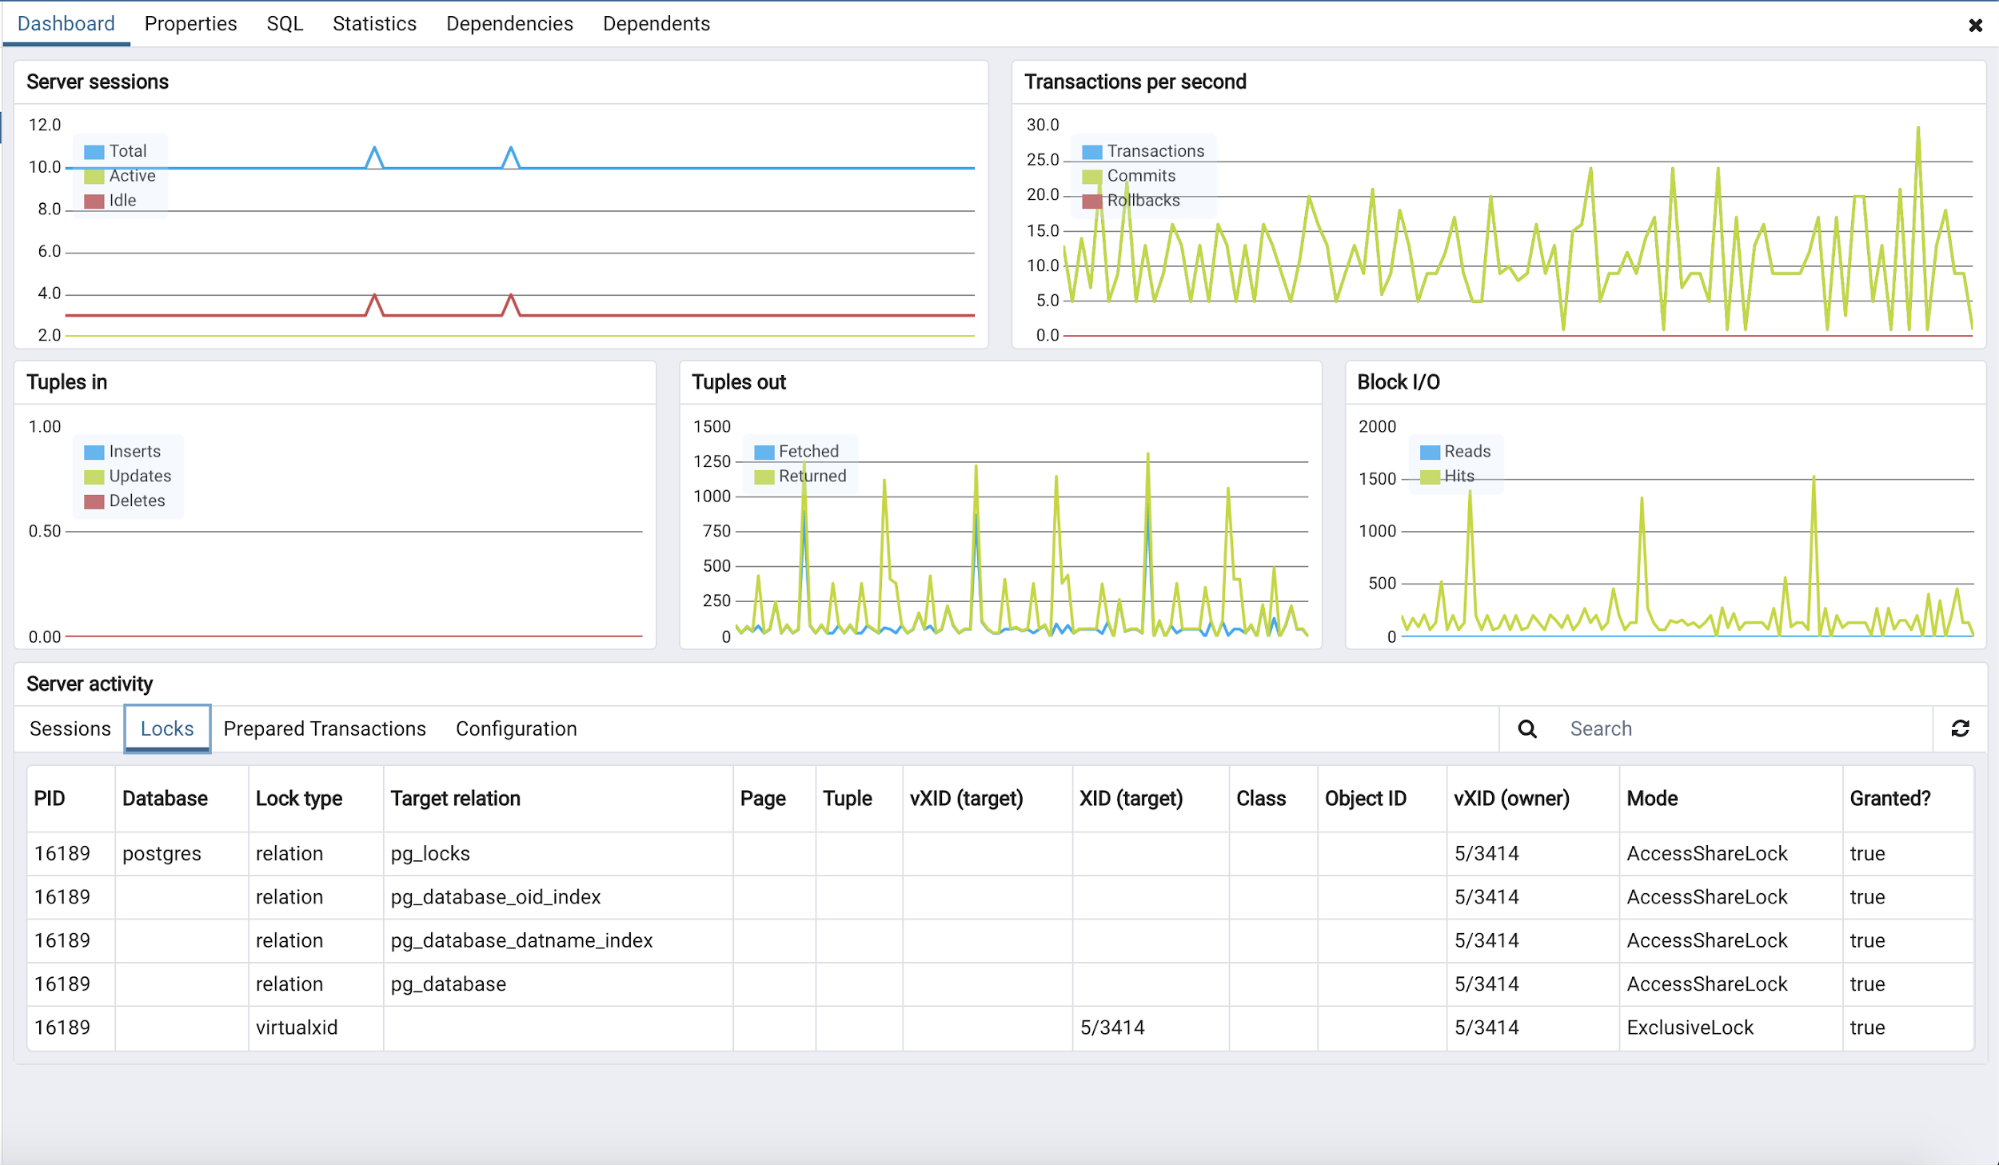
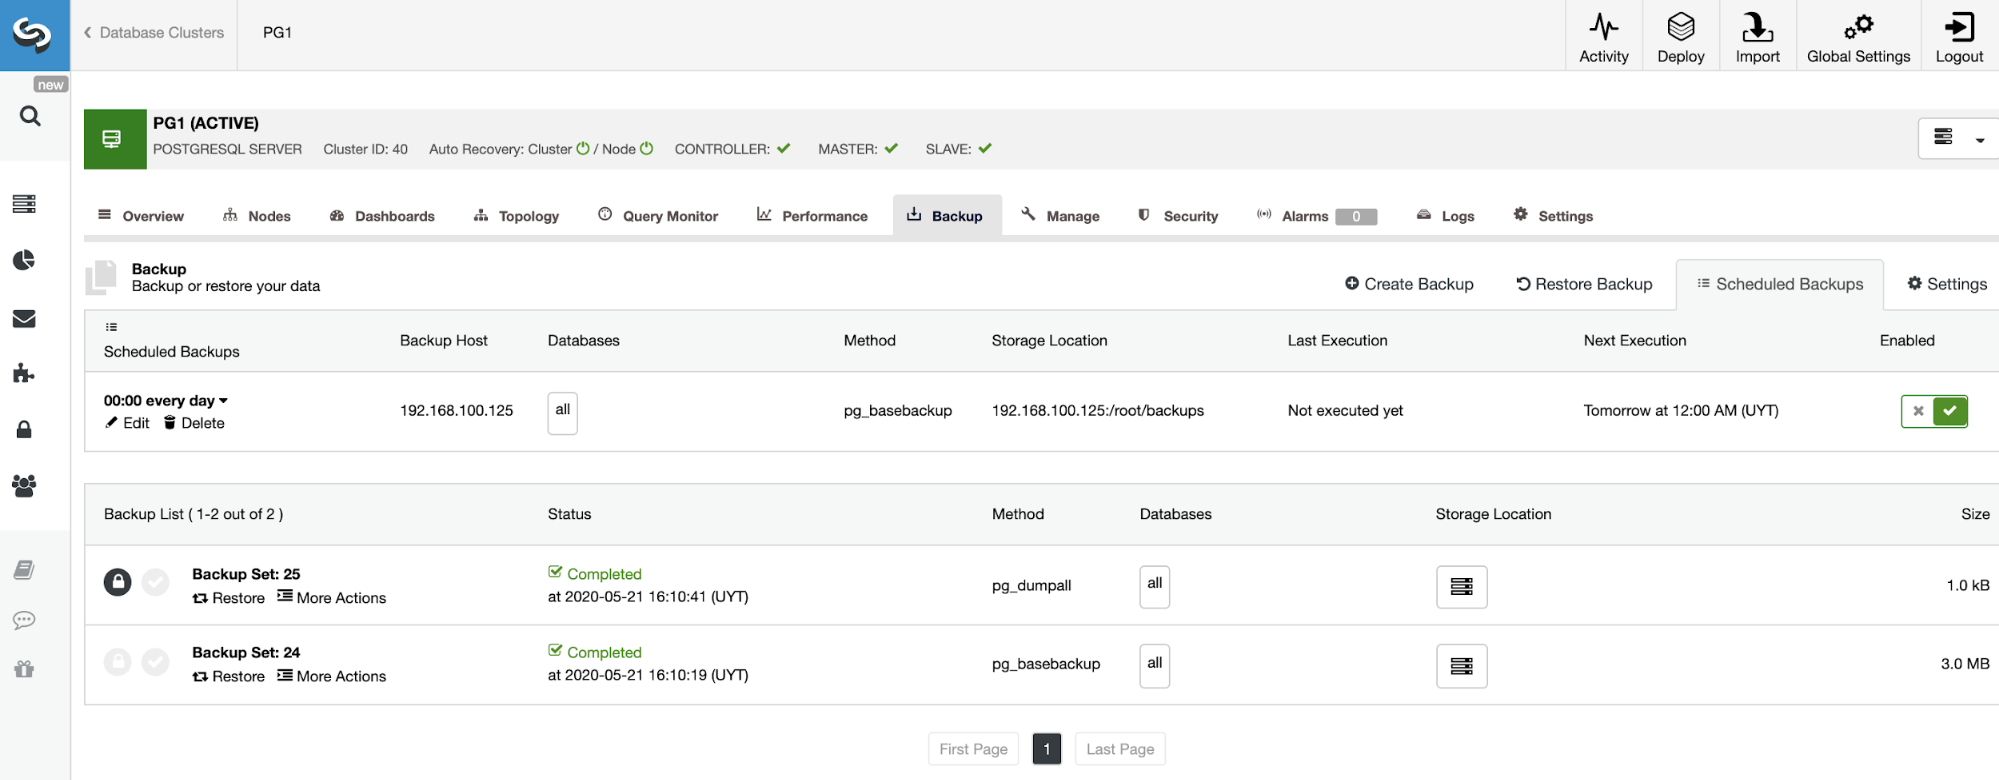
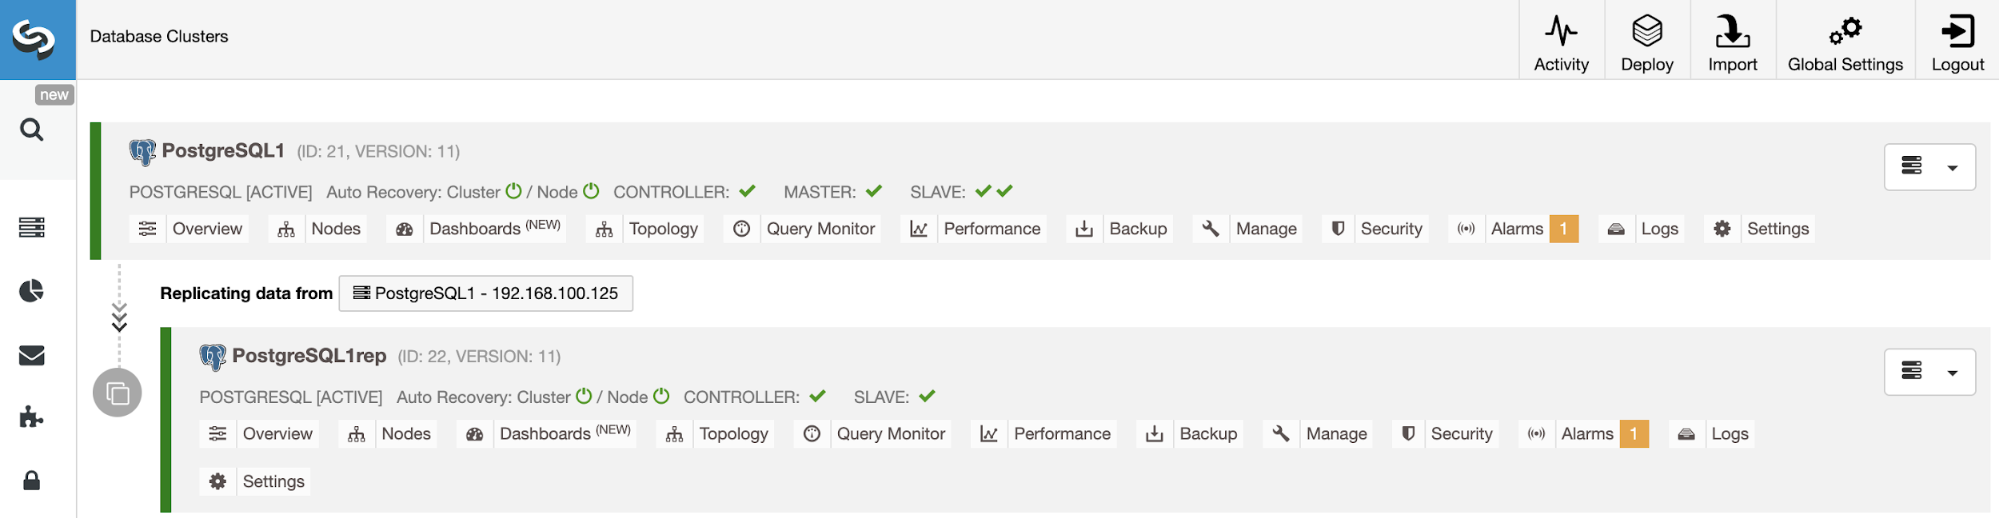
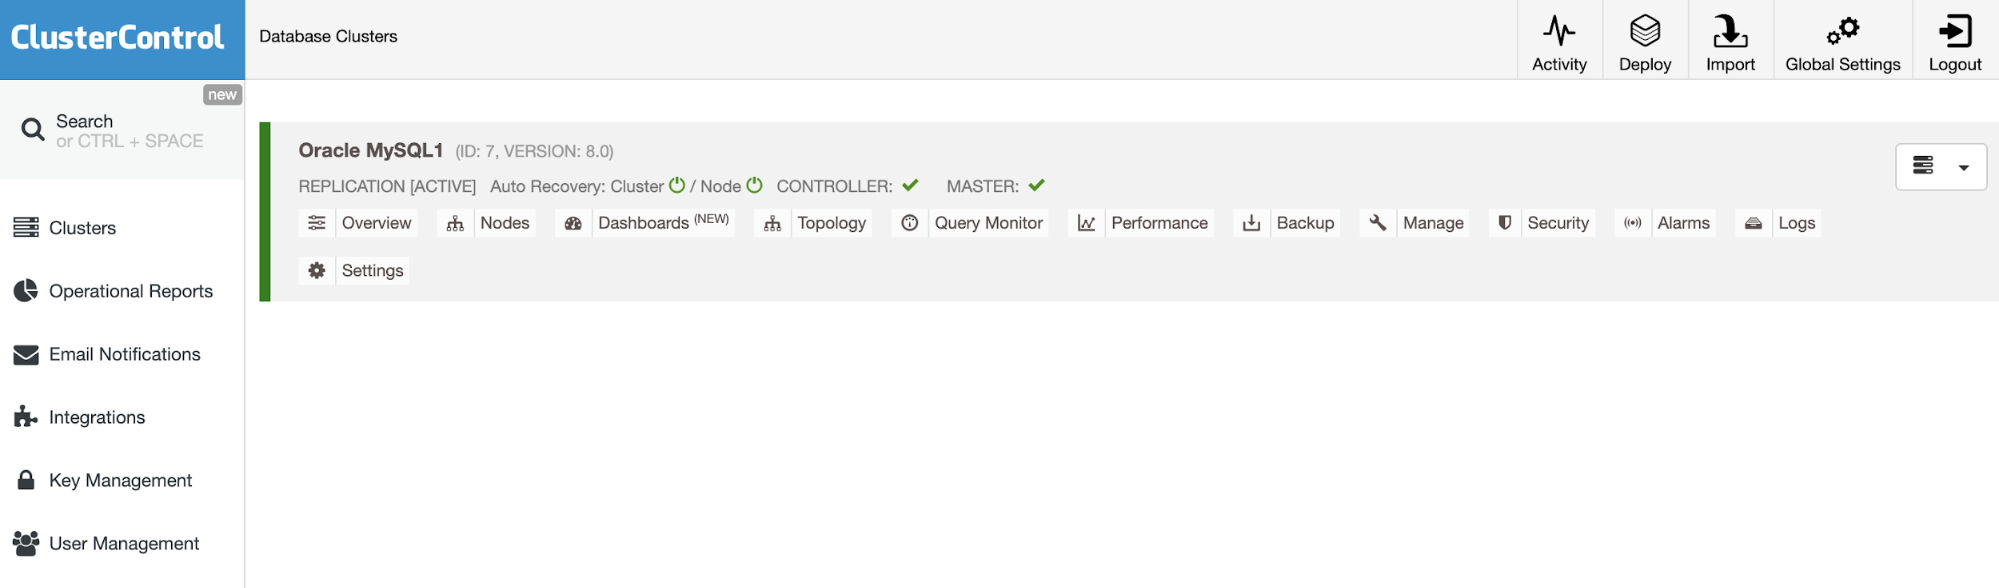
Database Monitoring with ClusterControl
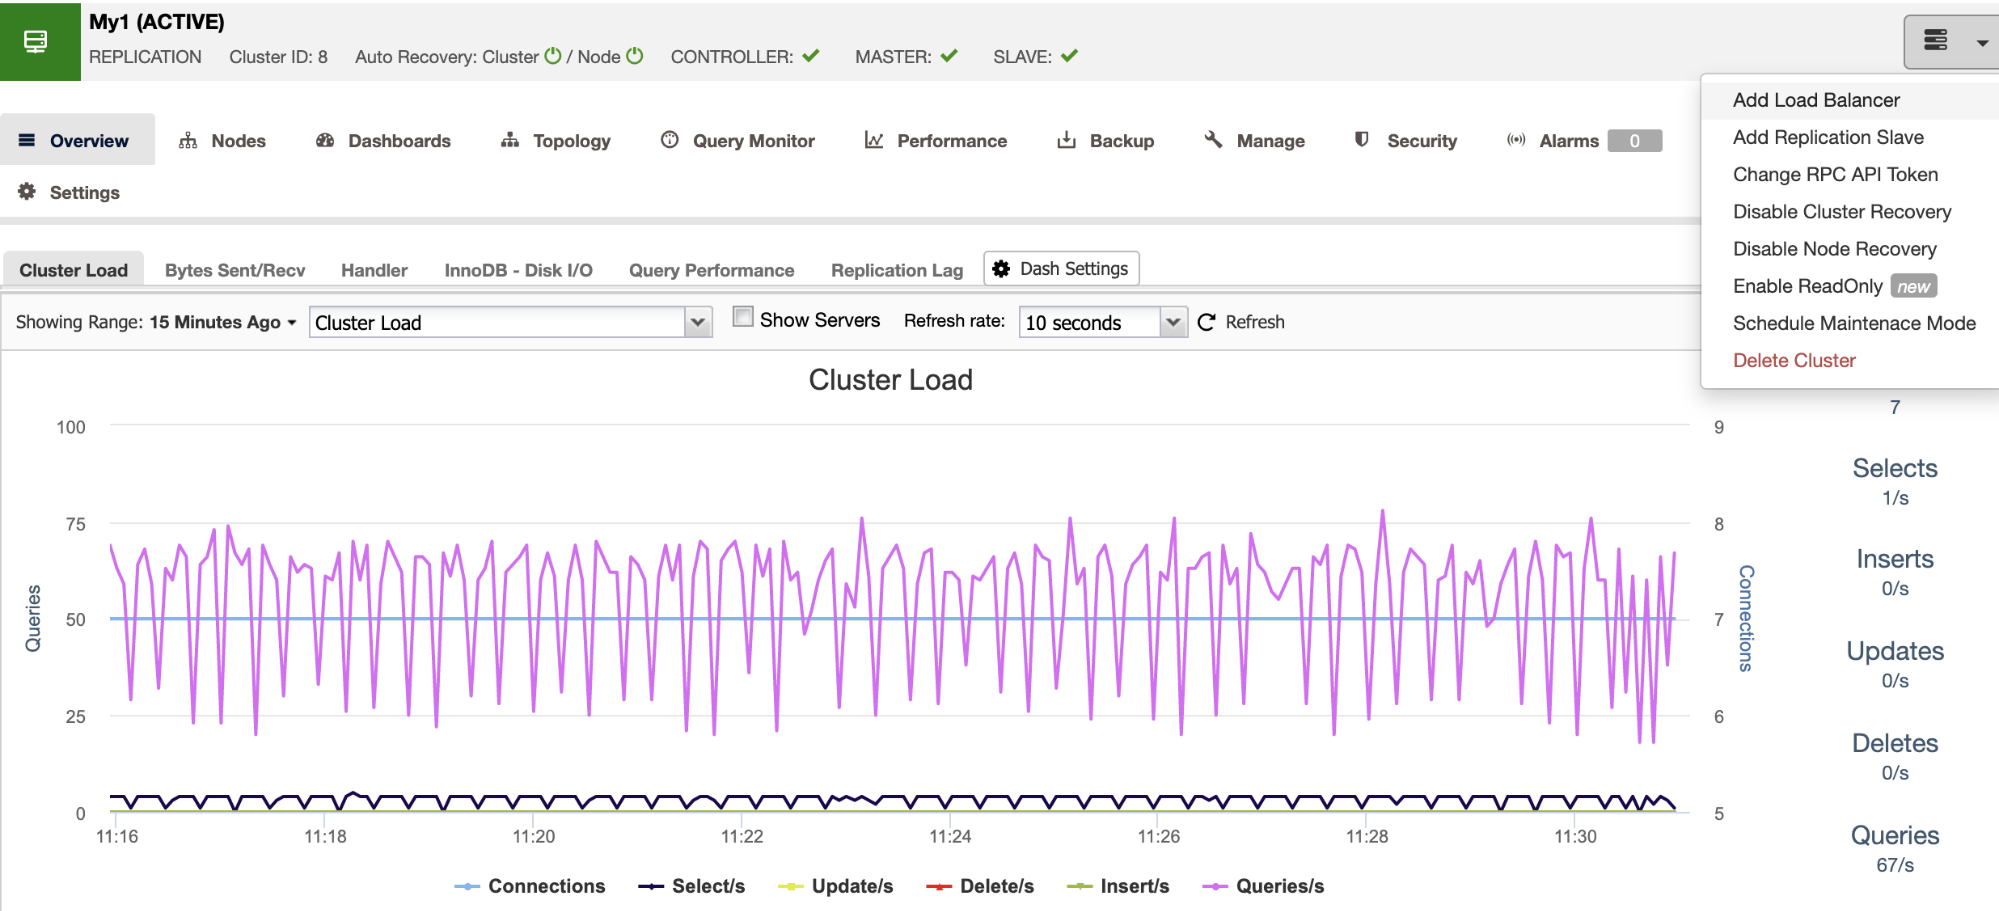
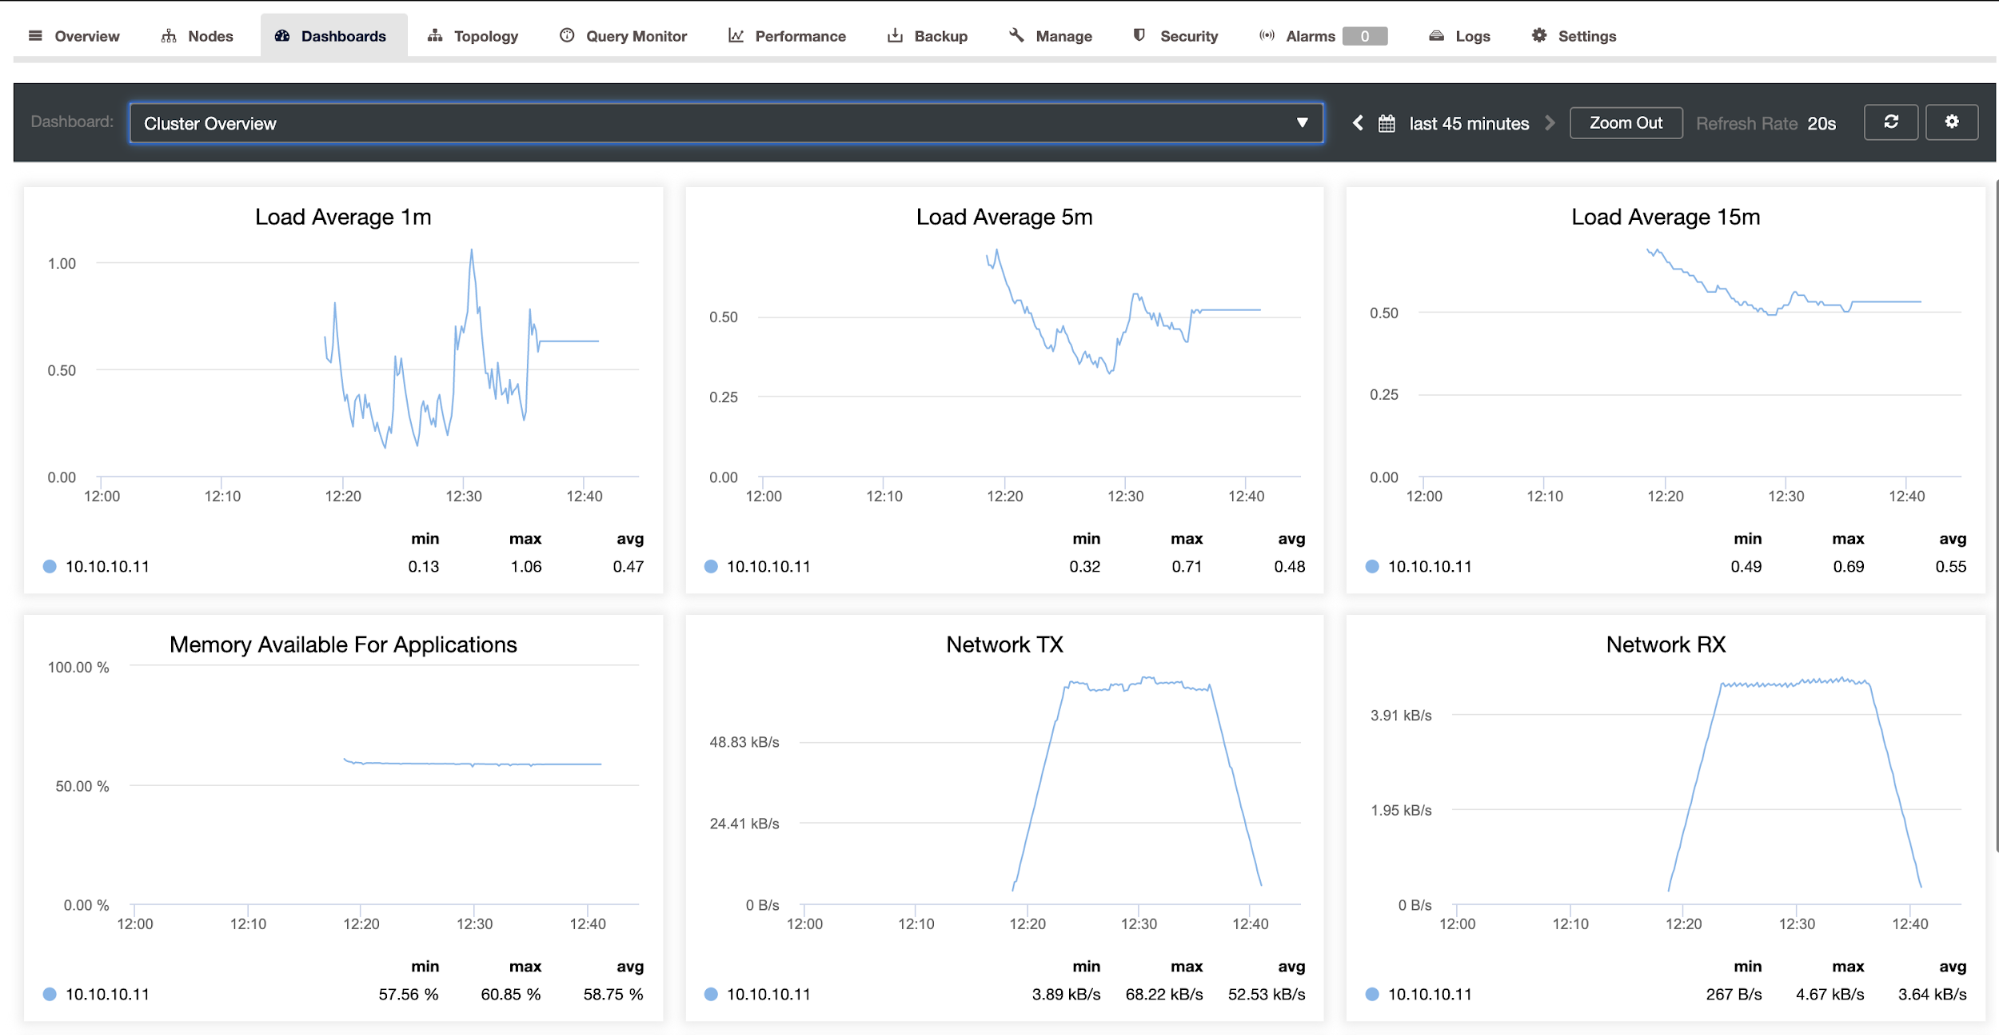
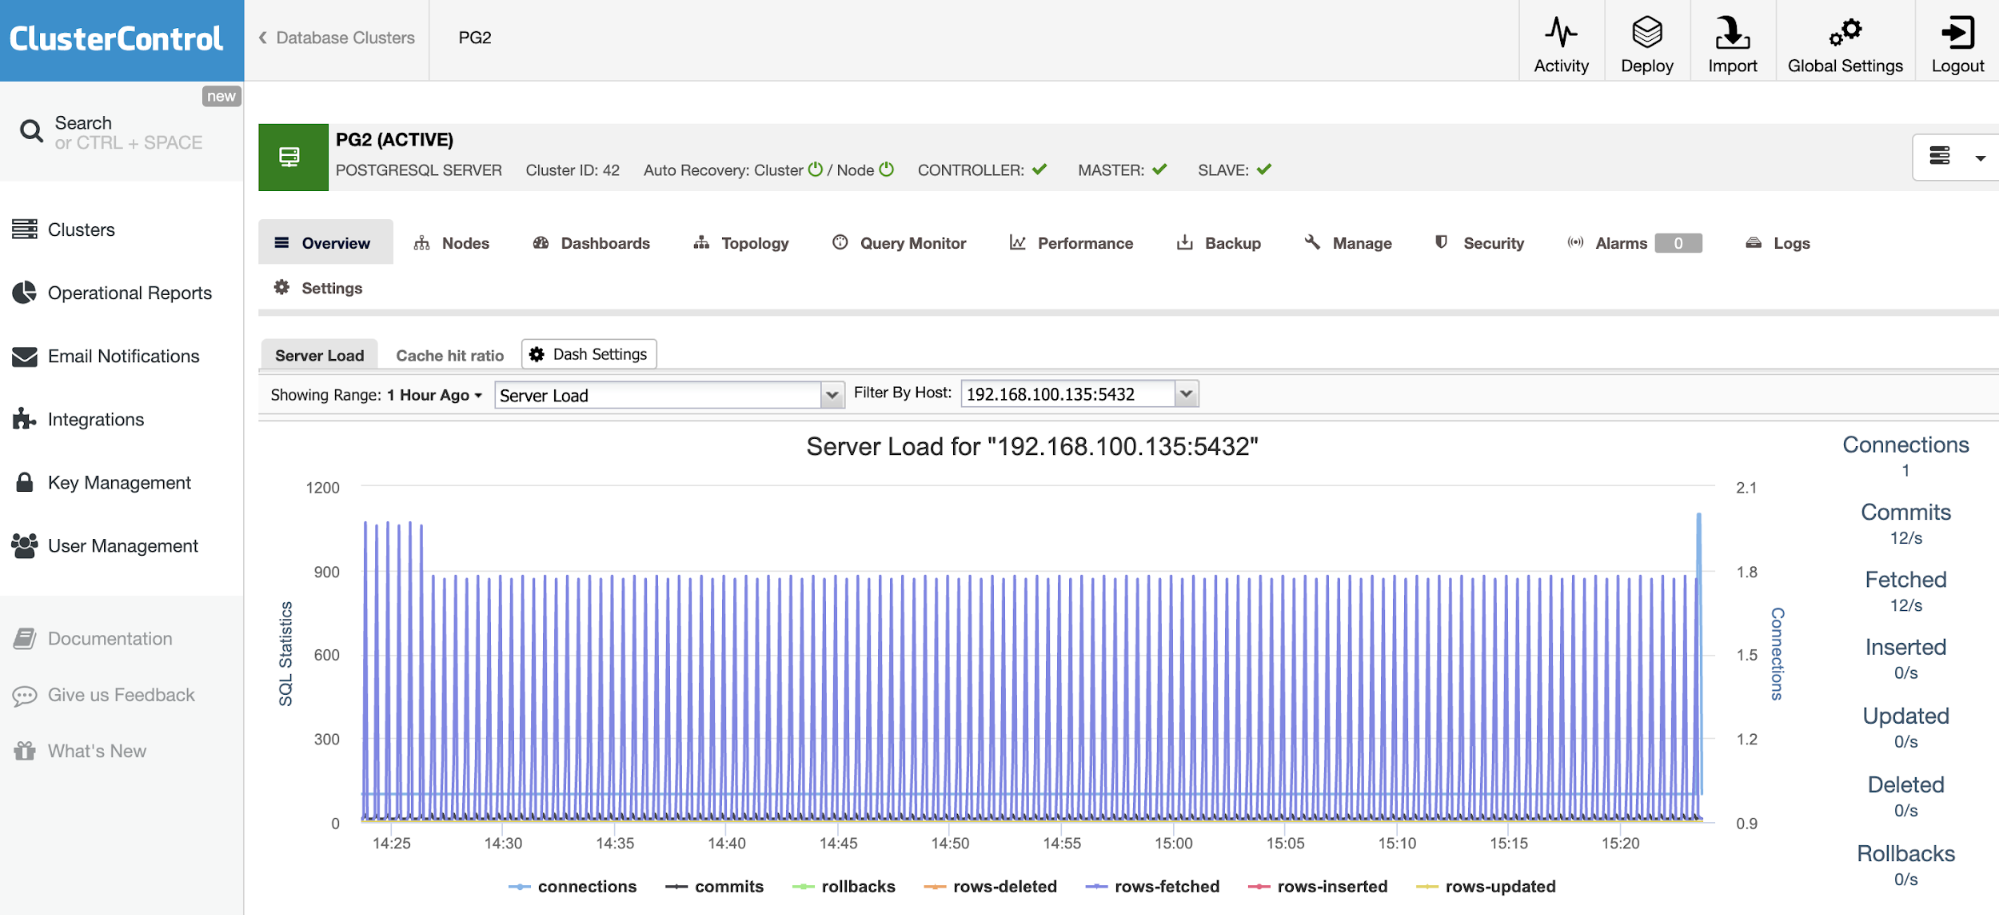
Like the previous case, let’s see an example of monitoring a MySQL database. In this case, you can see first, an overview of the database node, with some basic metrics.
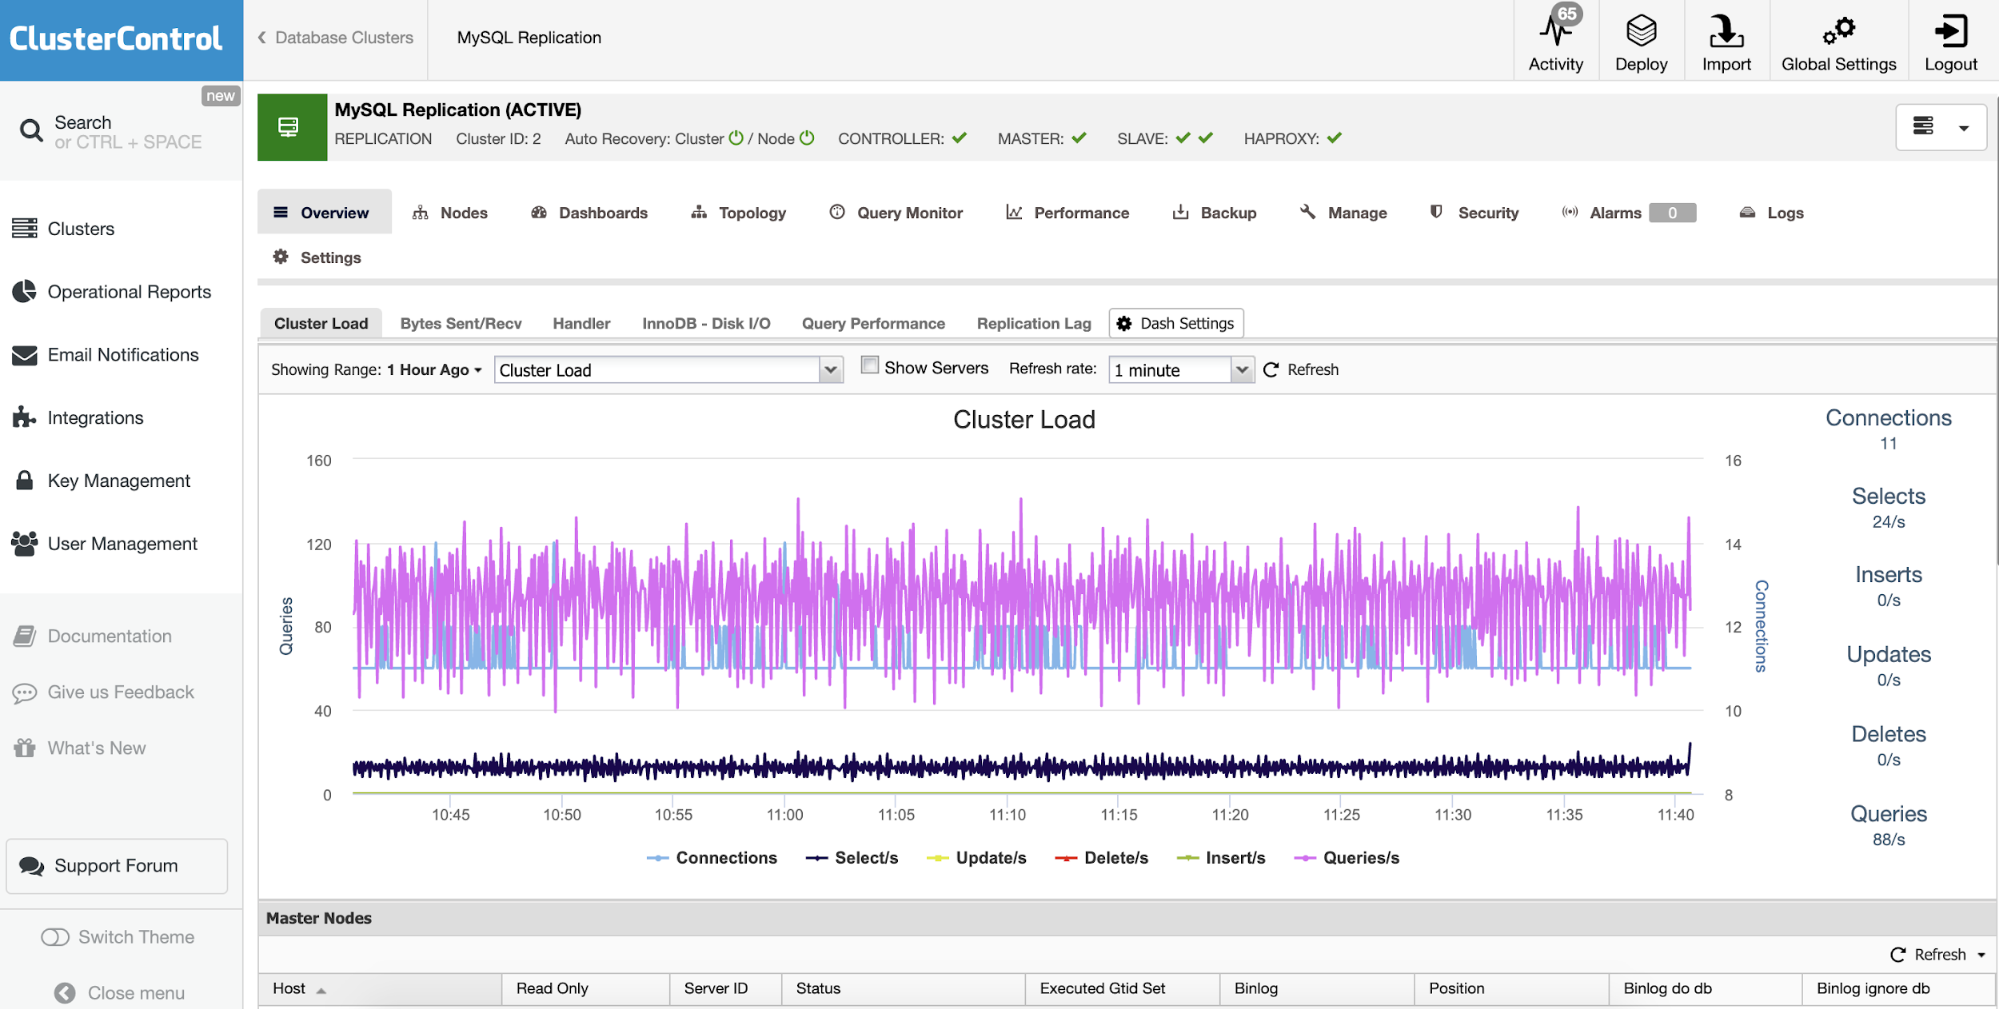
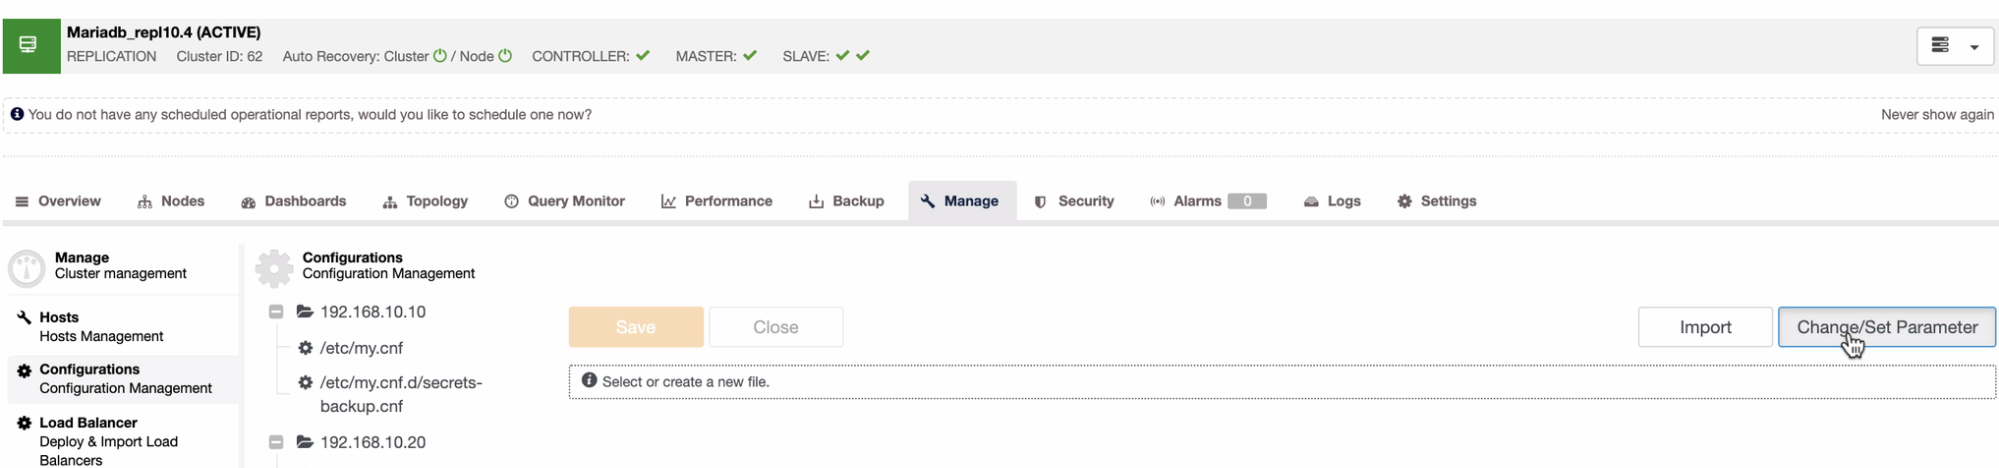
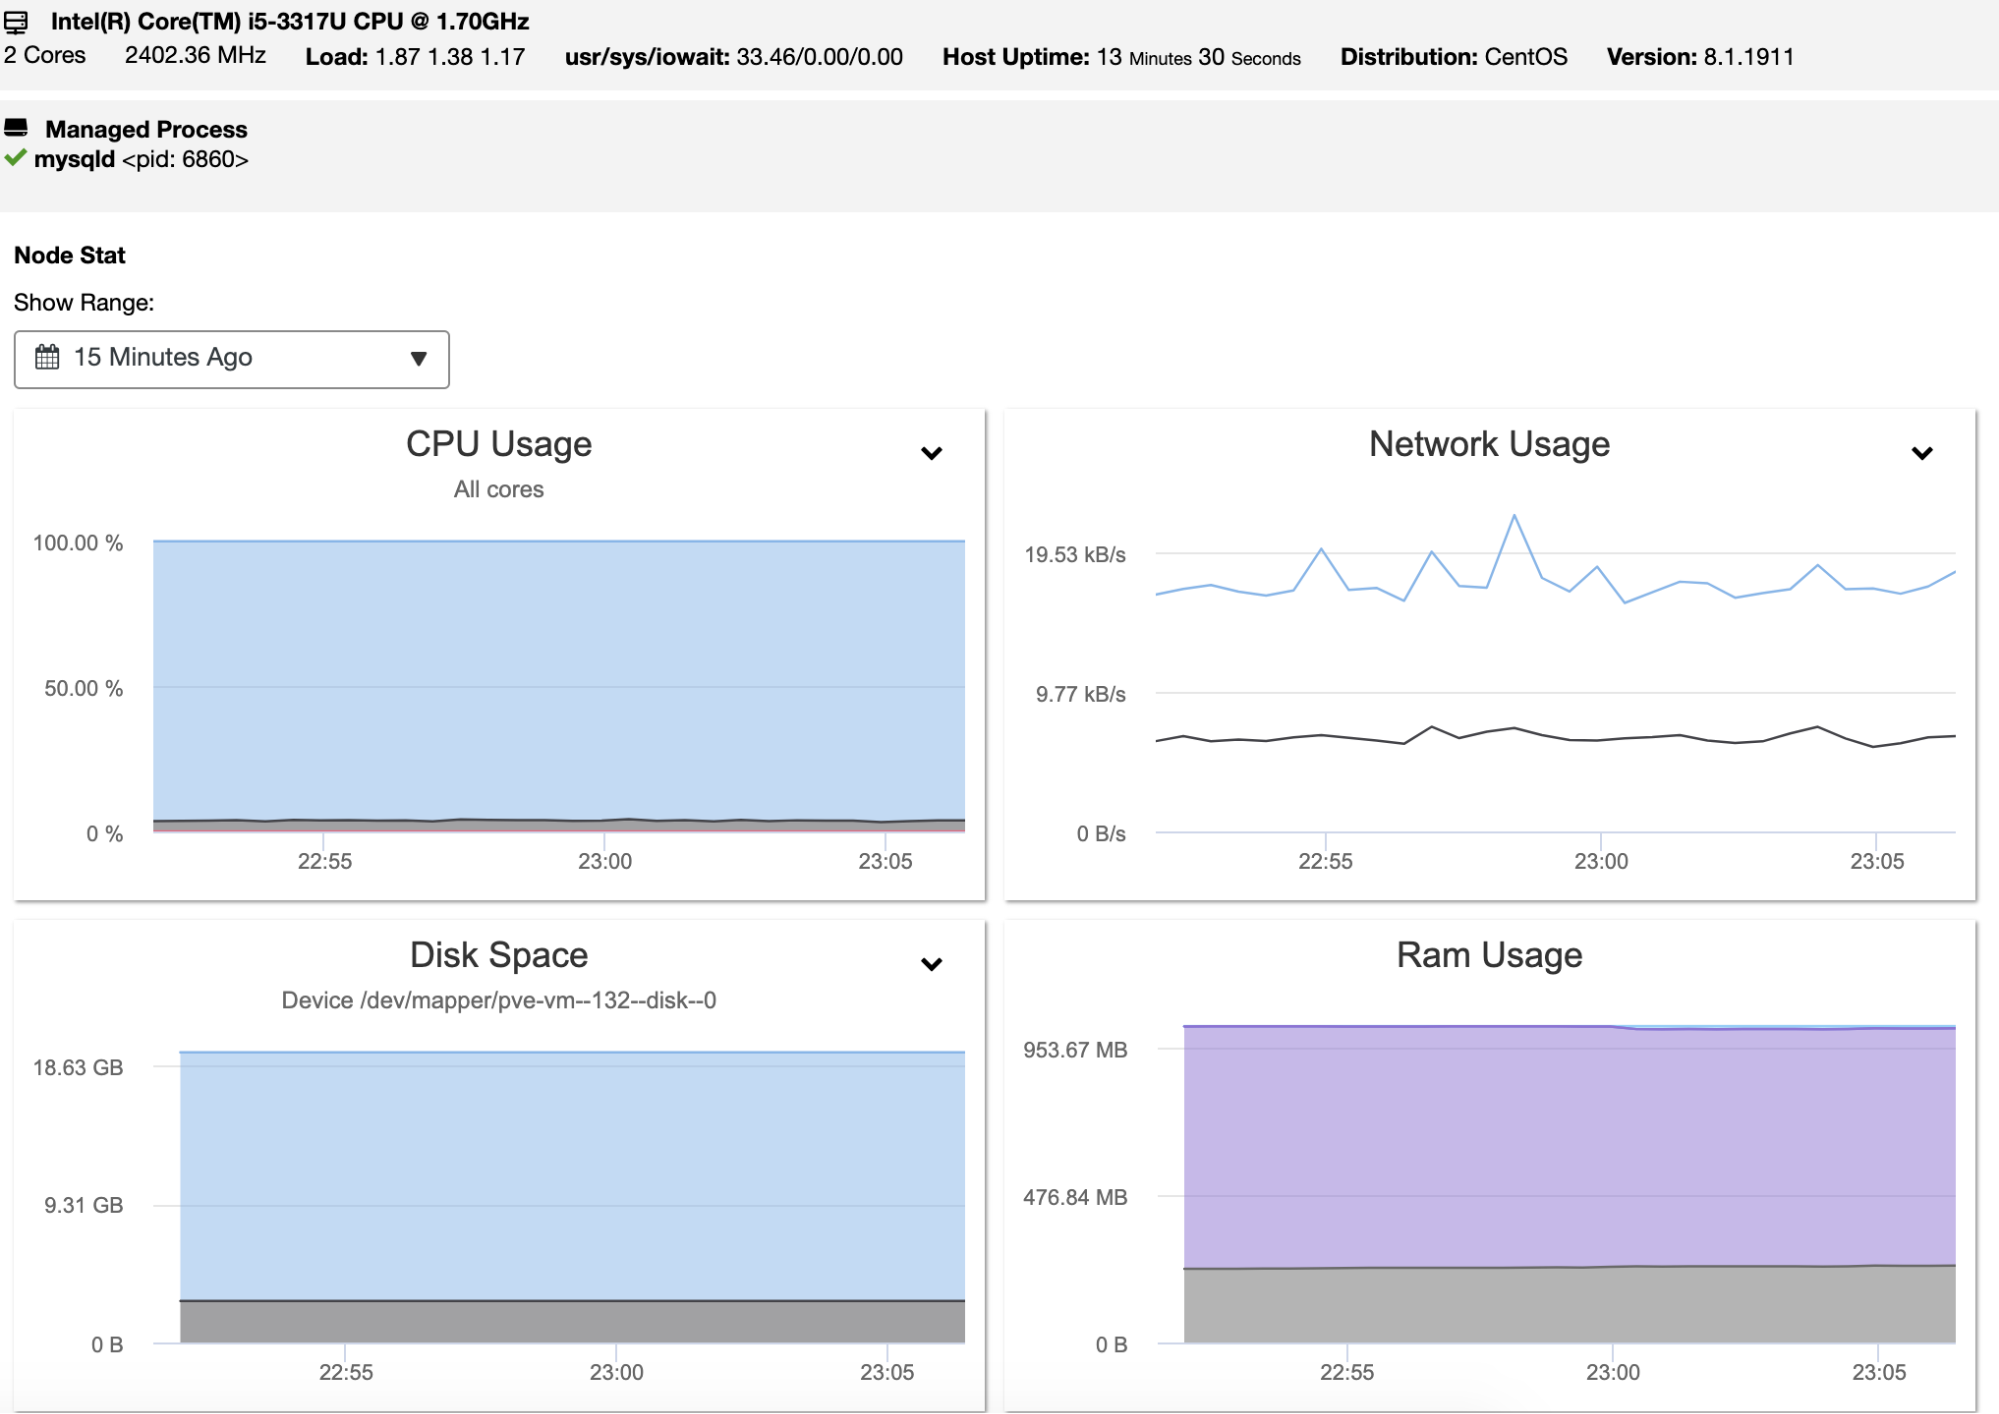
You have different dashboards here, that you can customize based on your requirements. Then, in the “Node” section, you can see host/database metrics, top process, and configuration for each node.
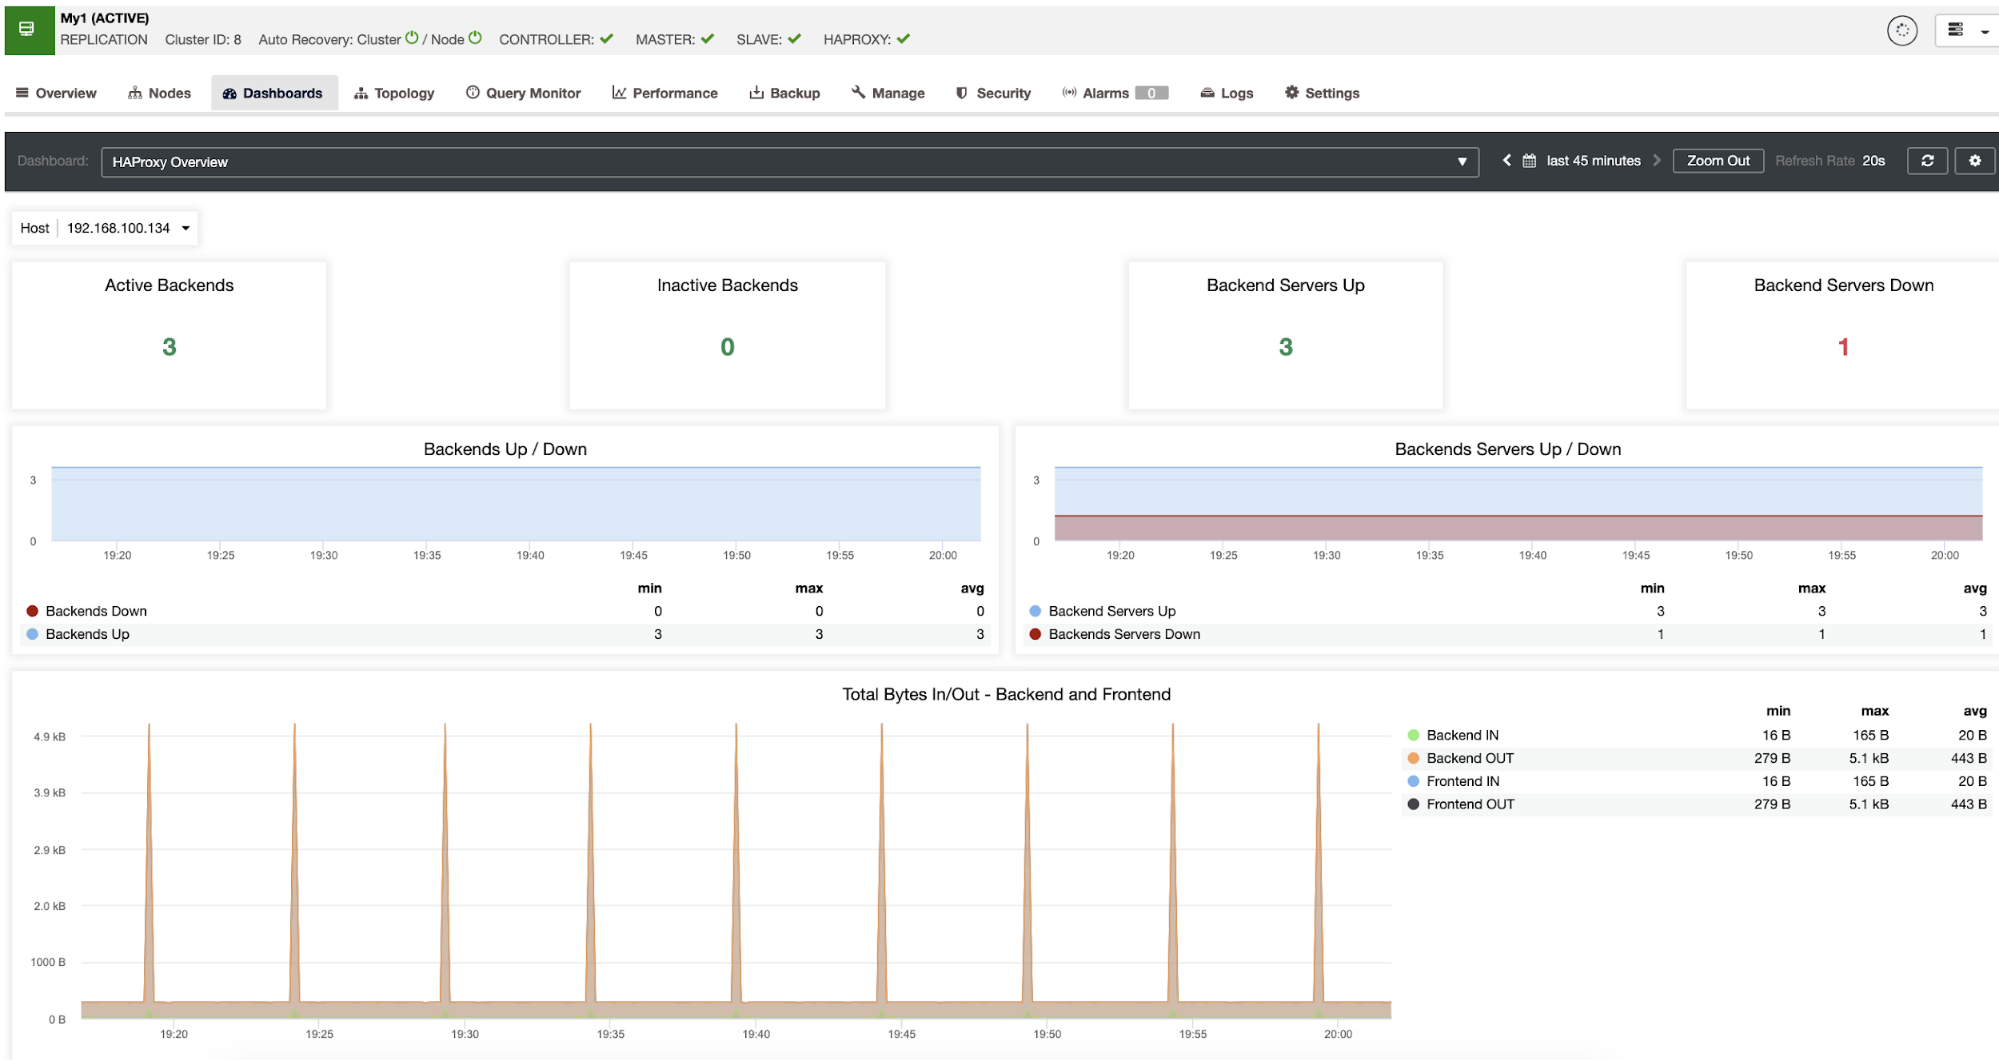
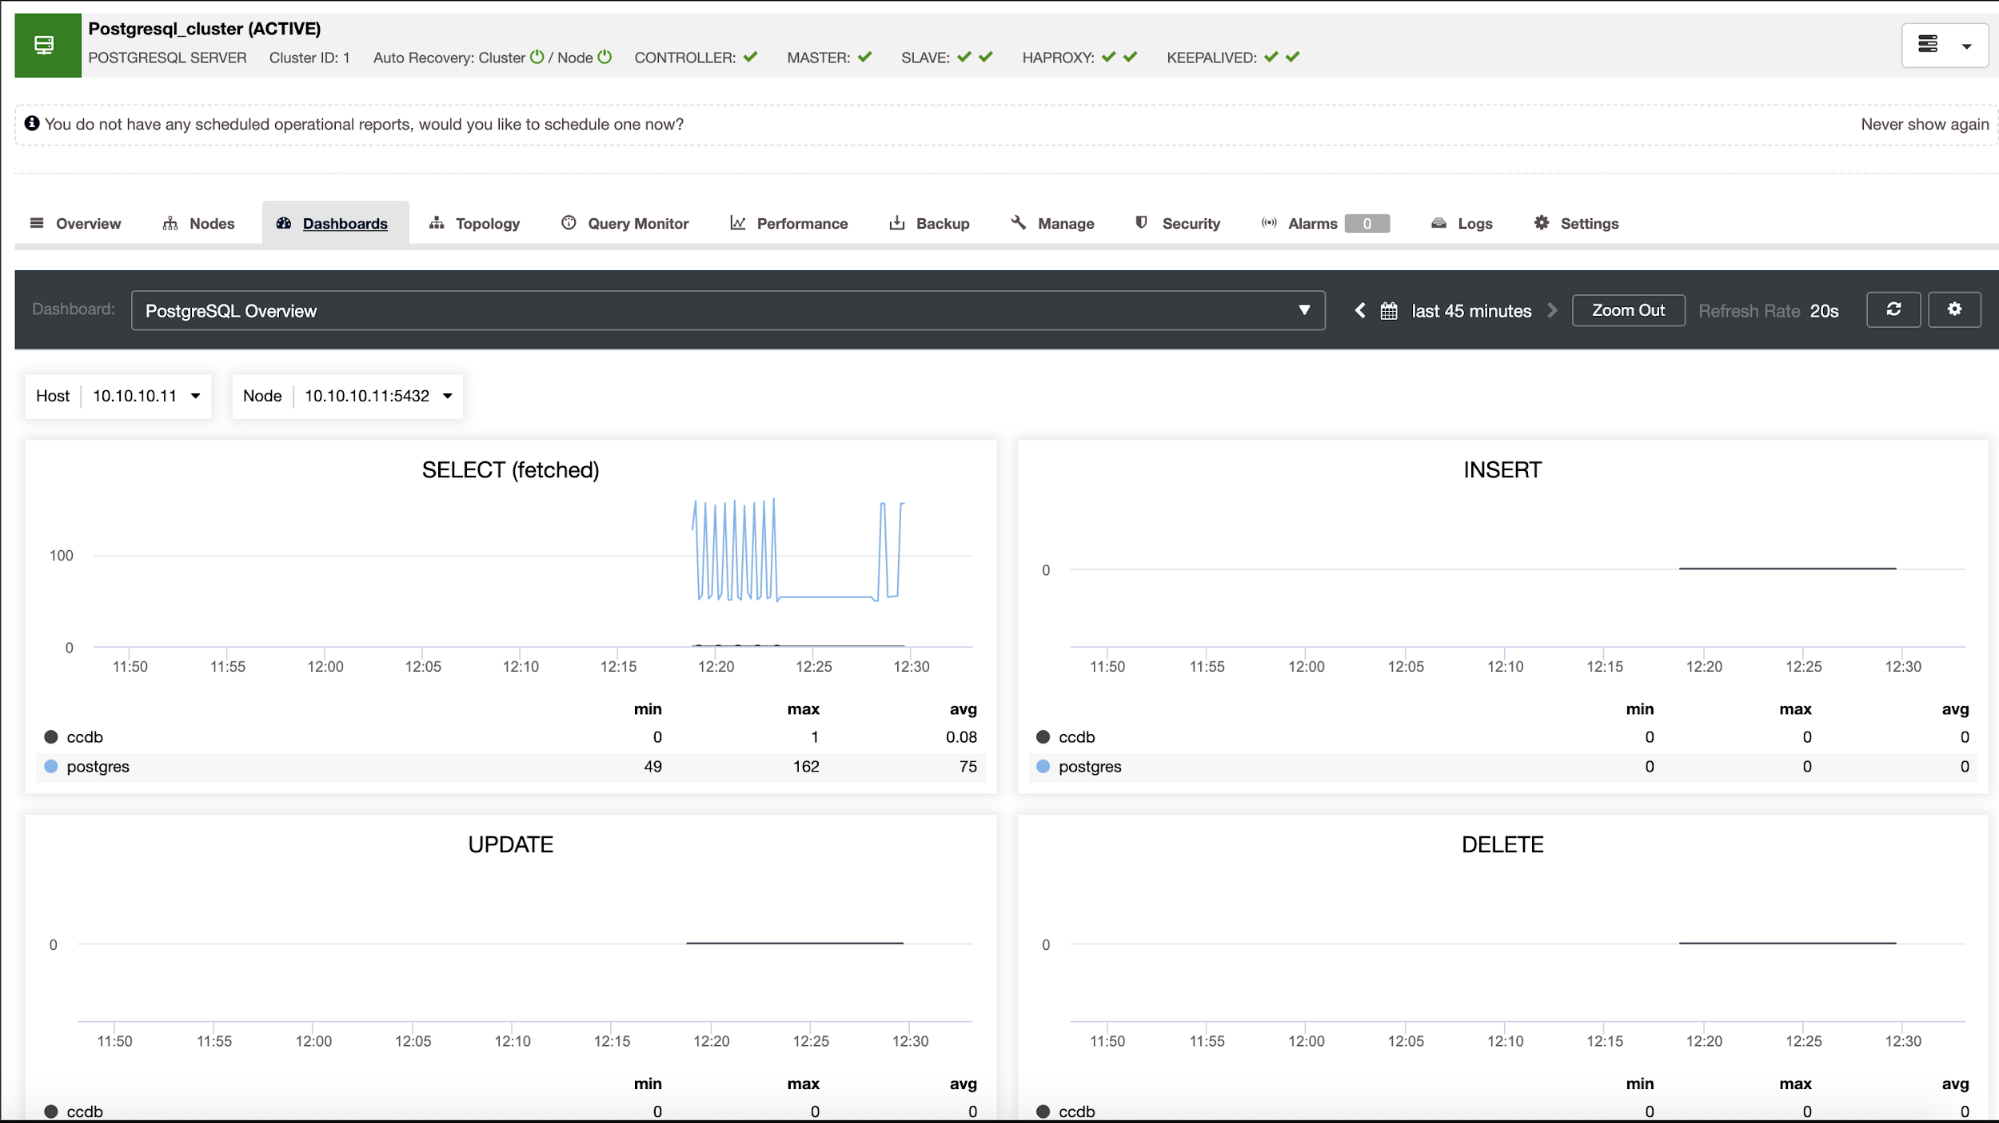
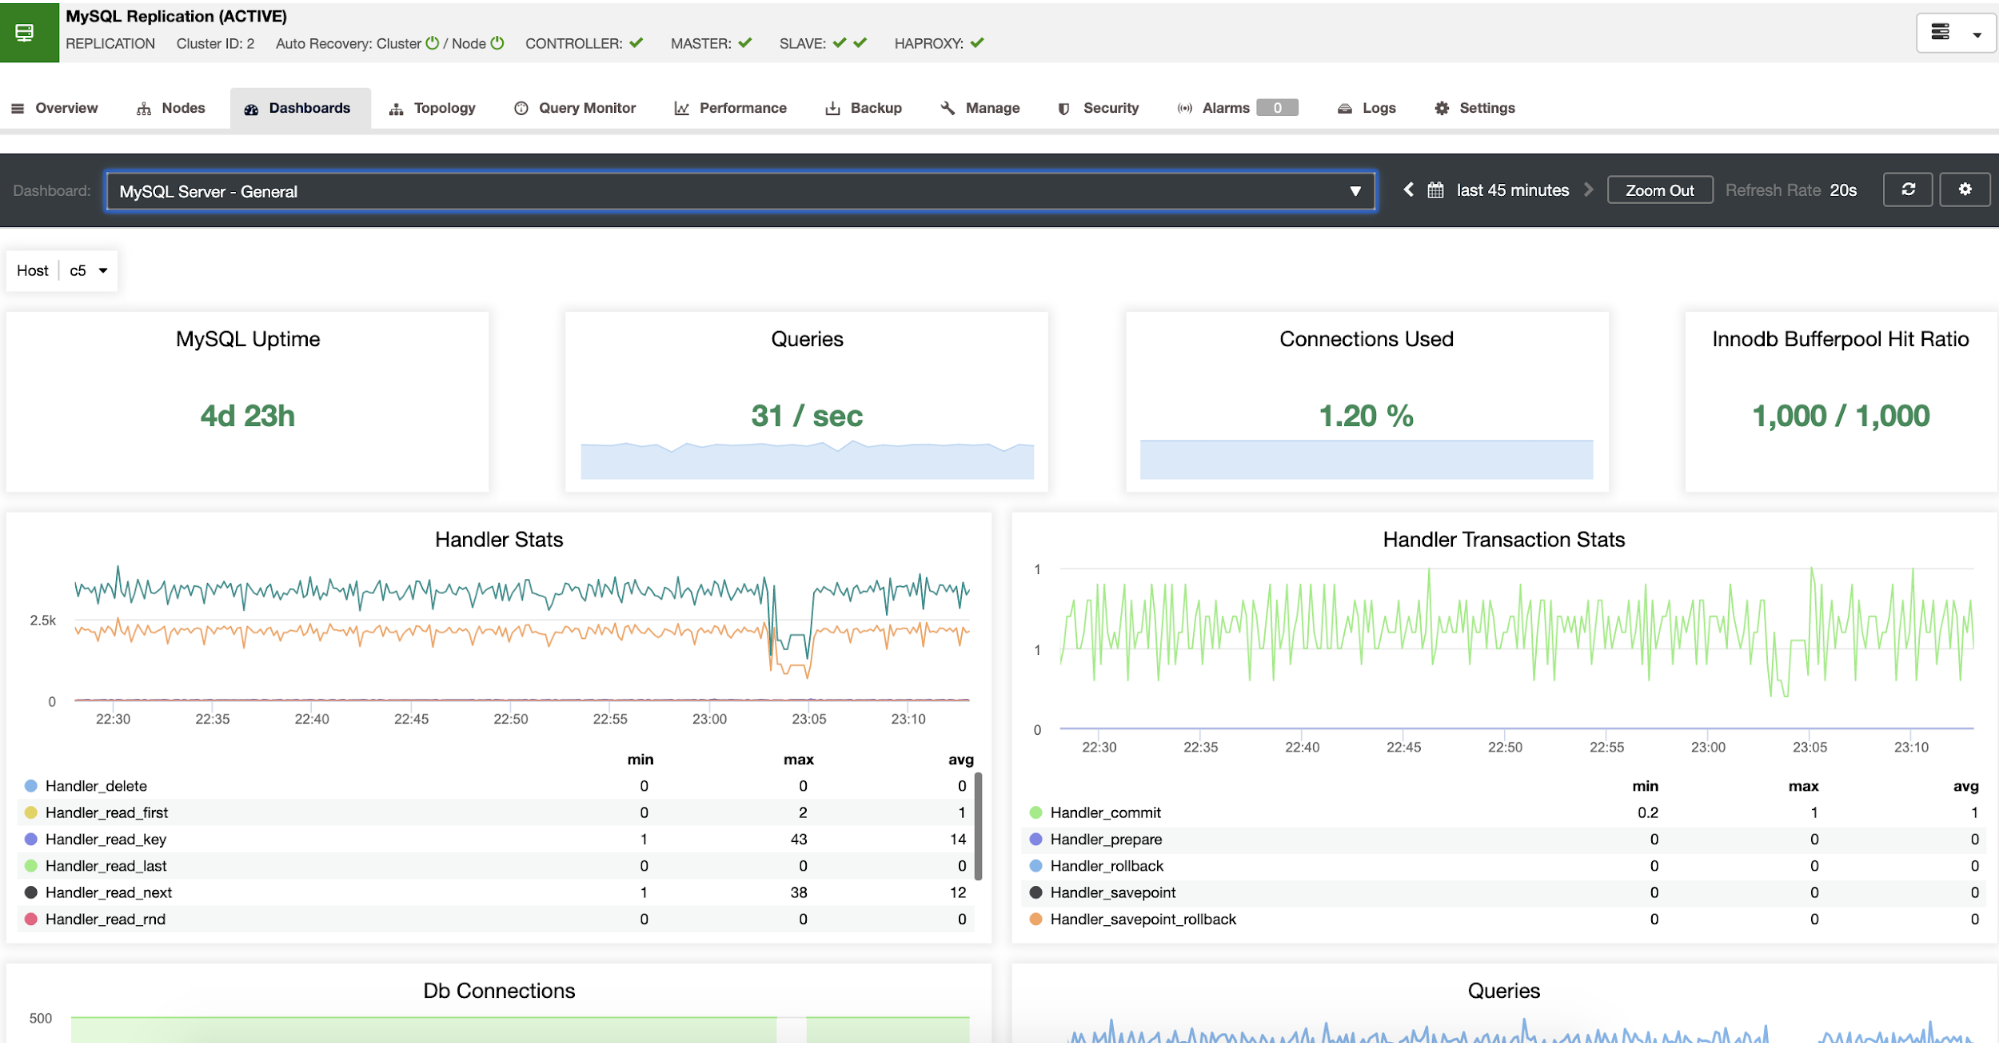
If you go to the “Dashboards” section, you’ll have more detailed information about your database, load balancer, or host, with more useful metrics.
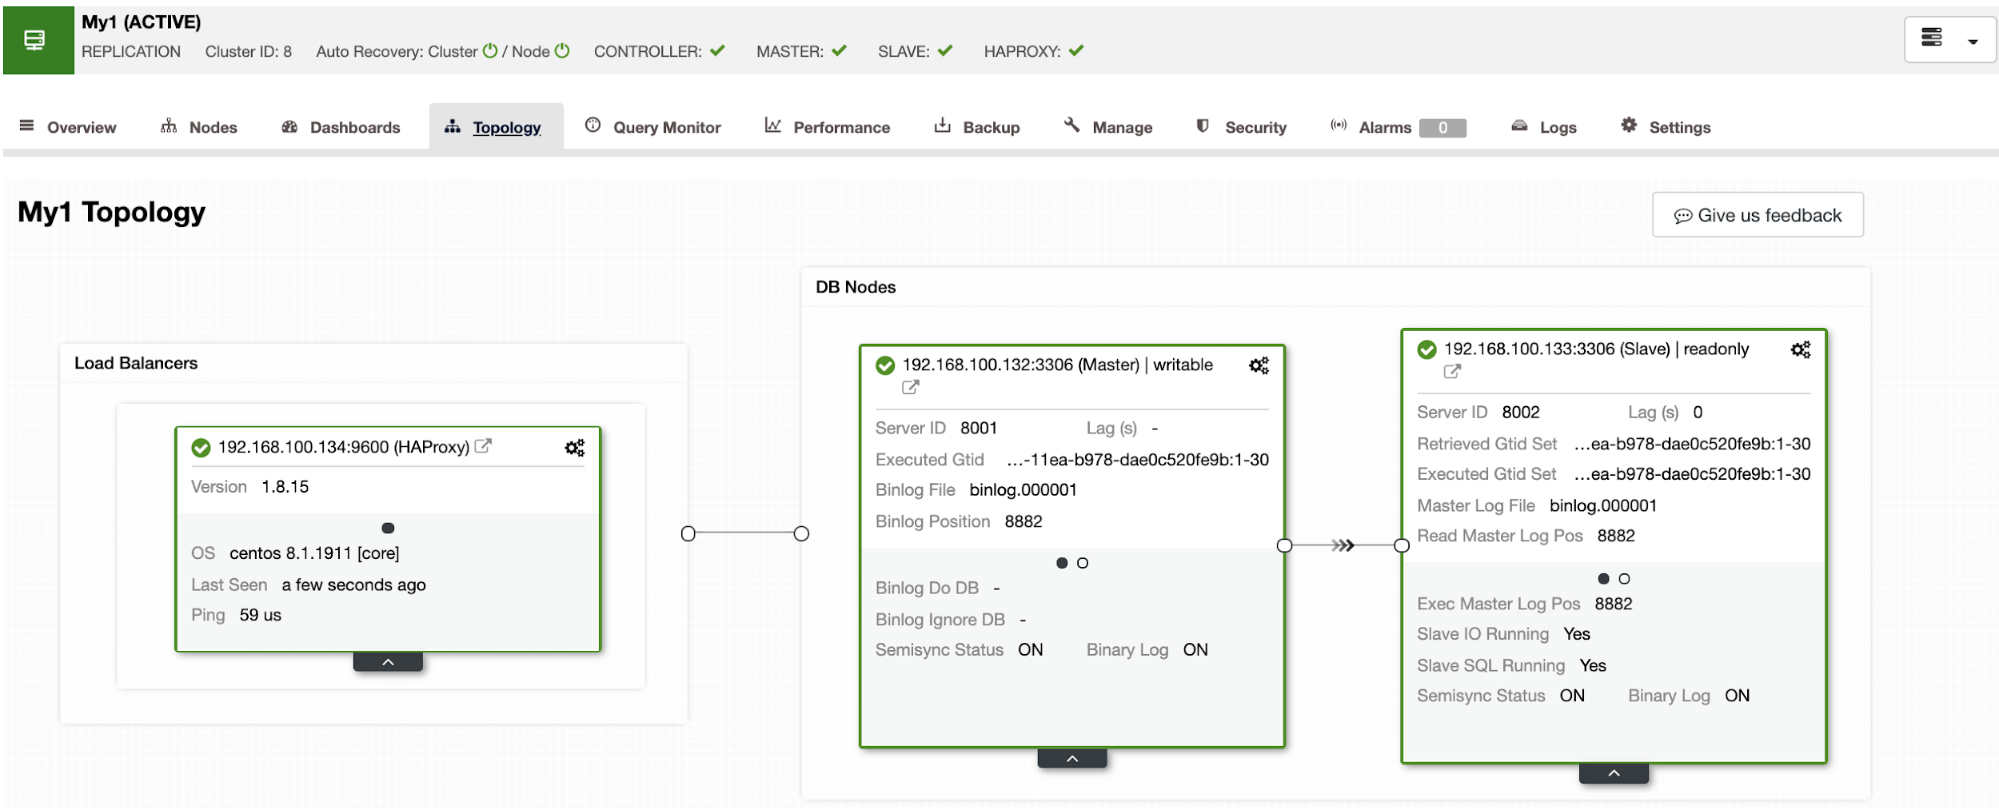
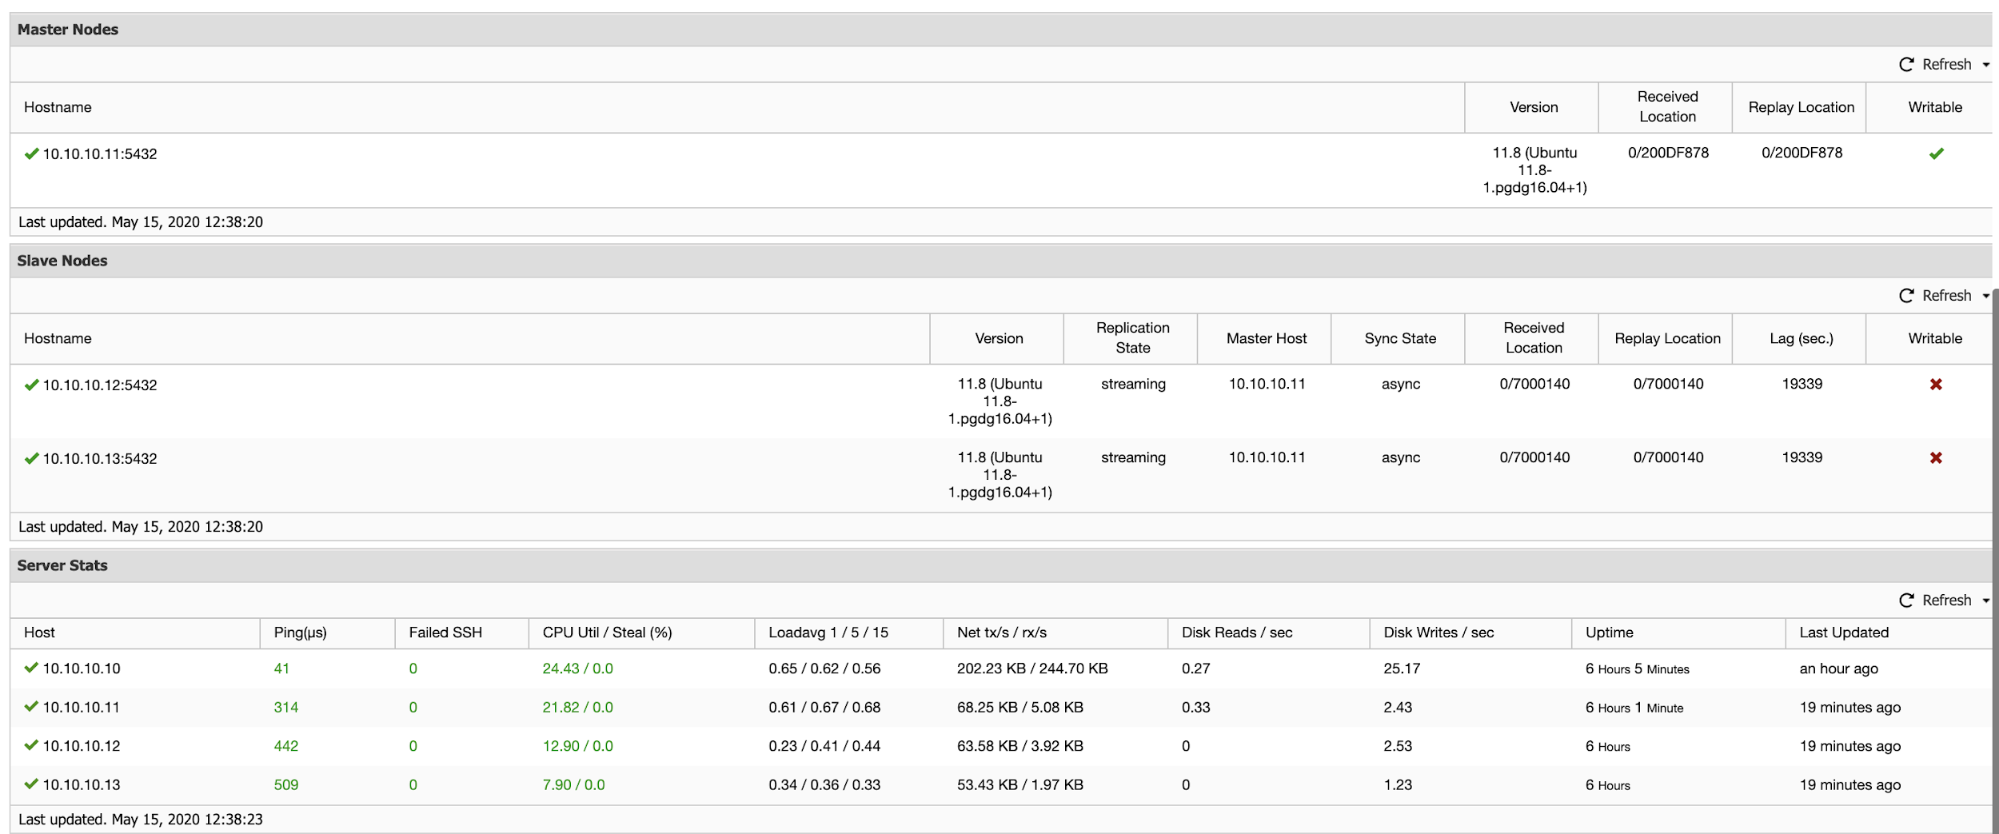
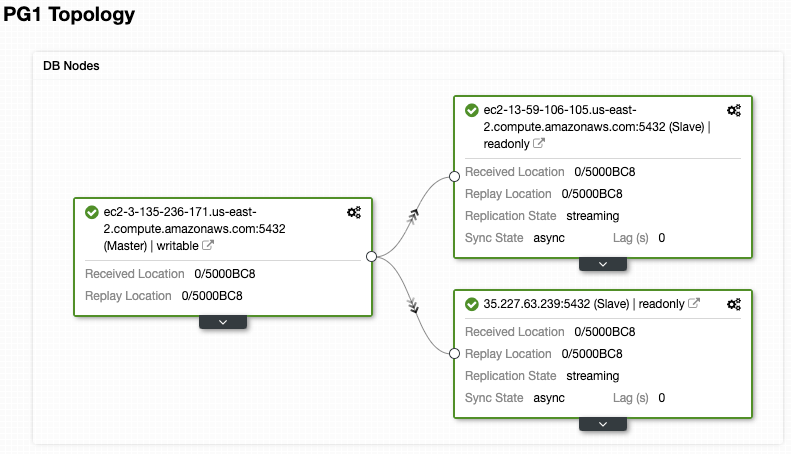
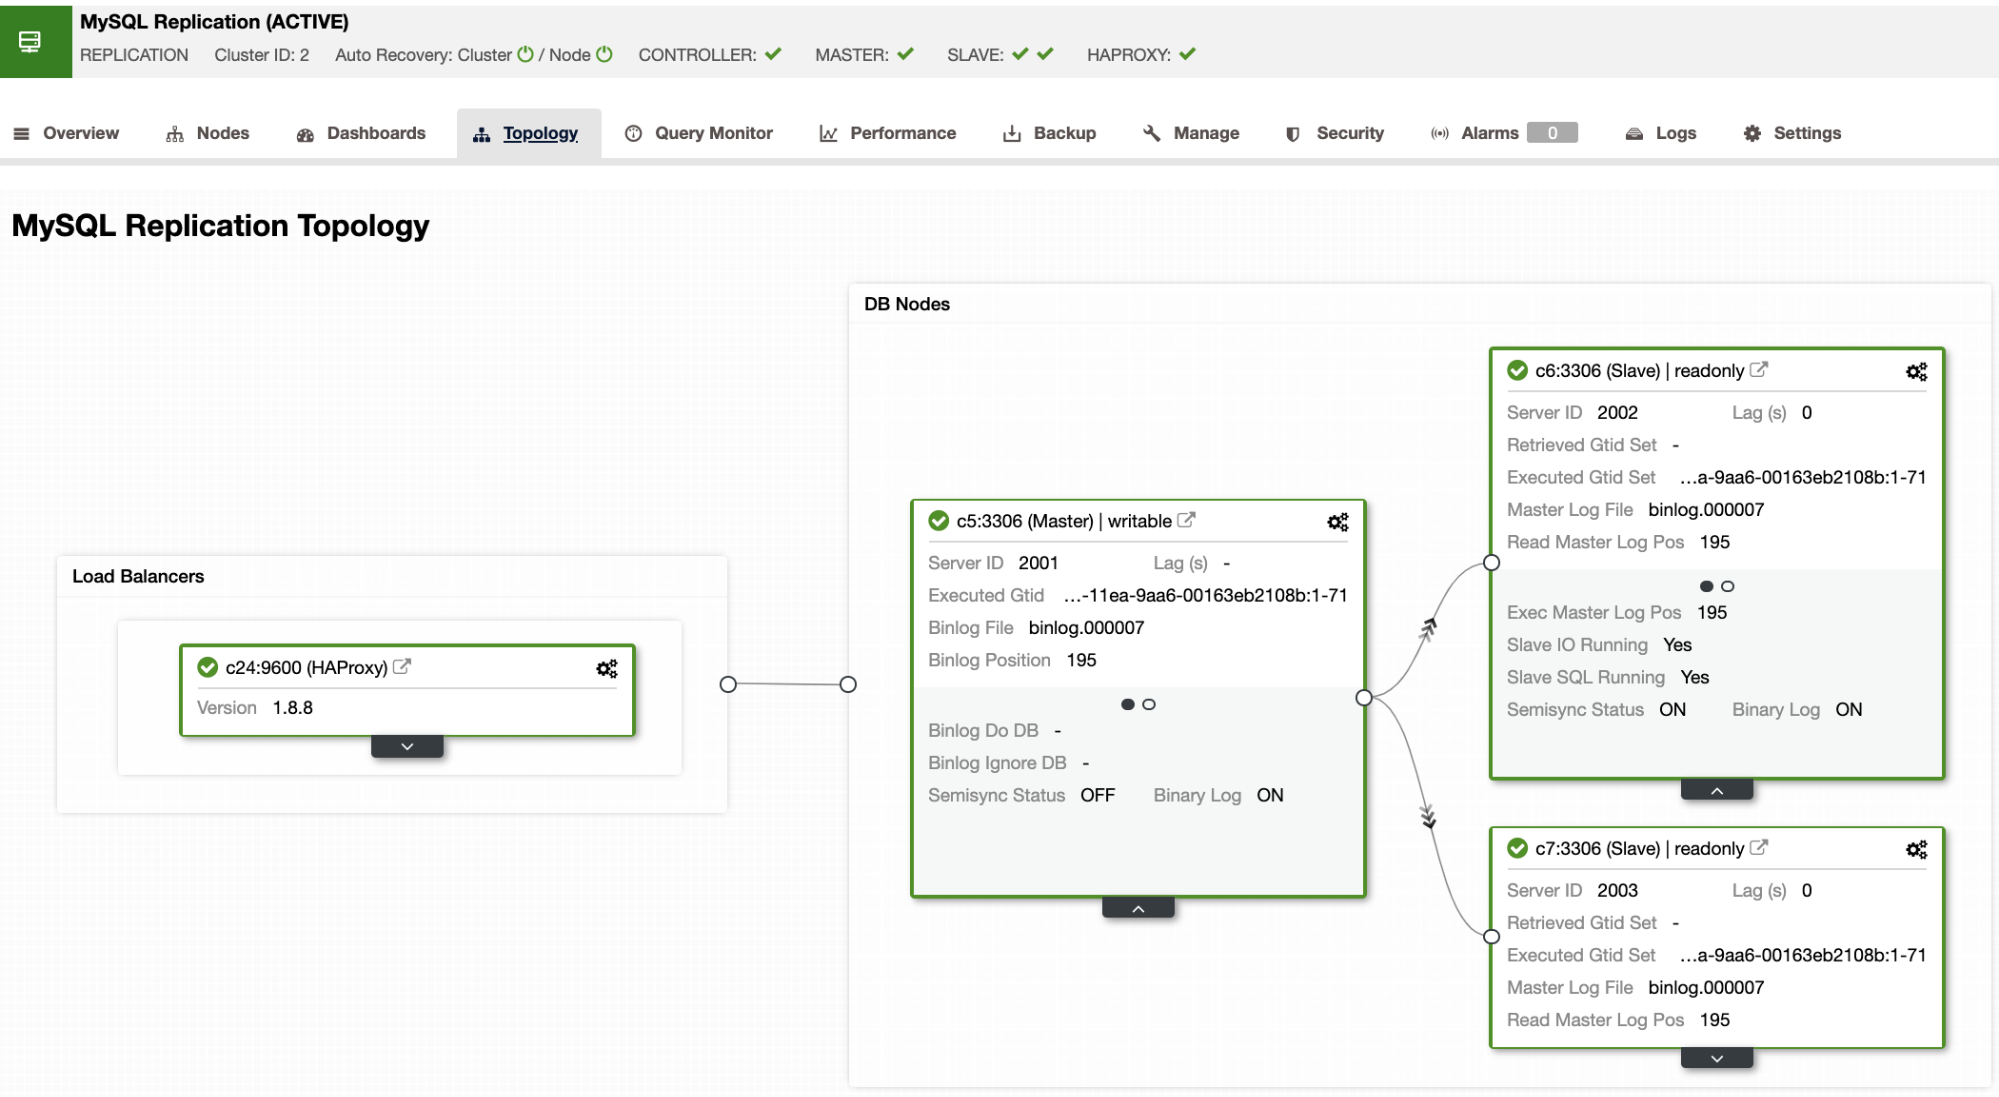
You can also check the “Topology View” section, where you can see the status of all the environment, or even perform actions over the nodes.
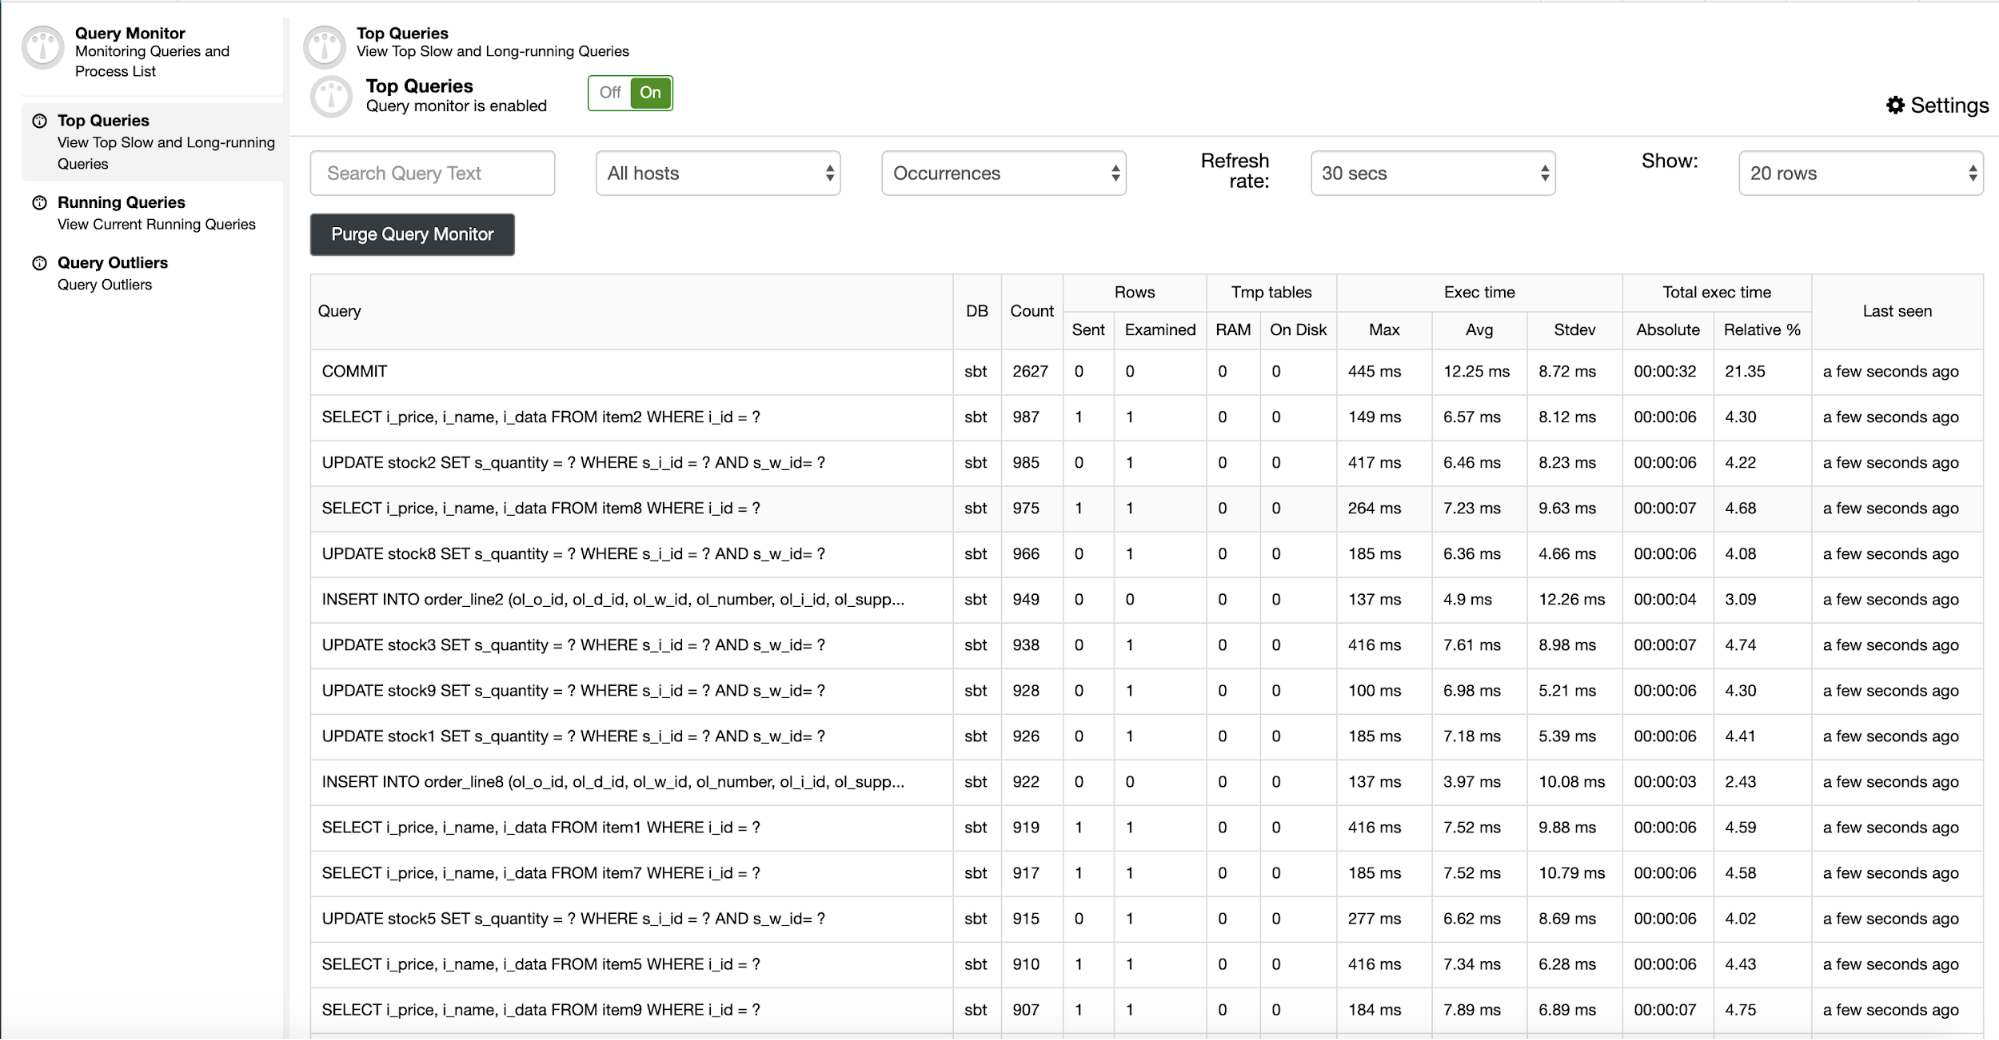
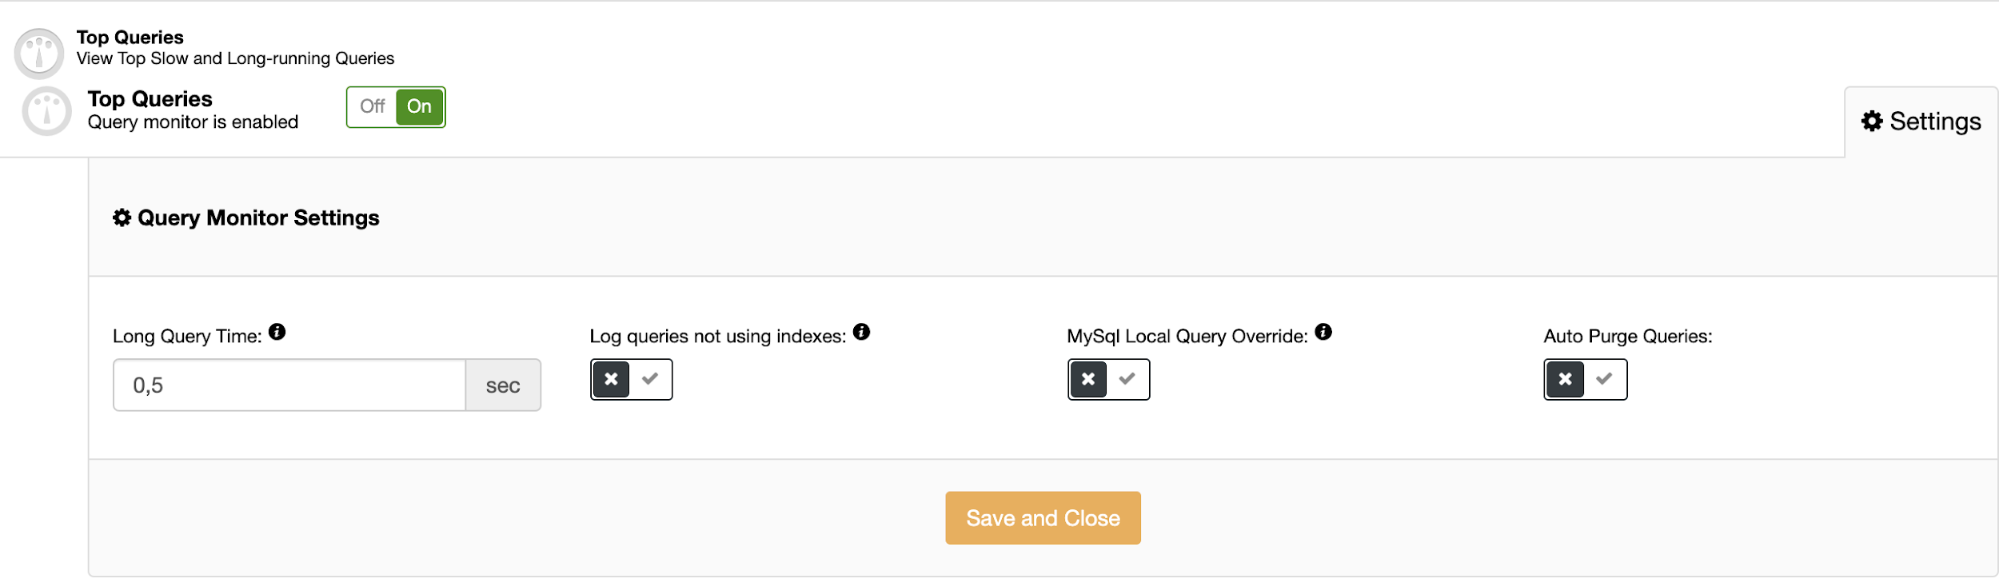
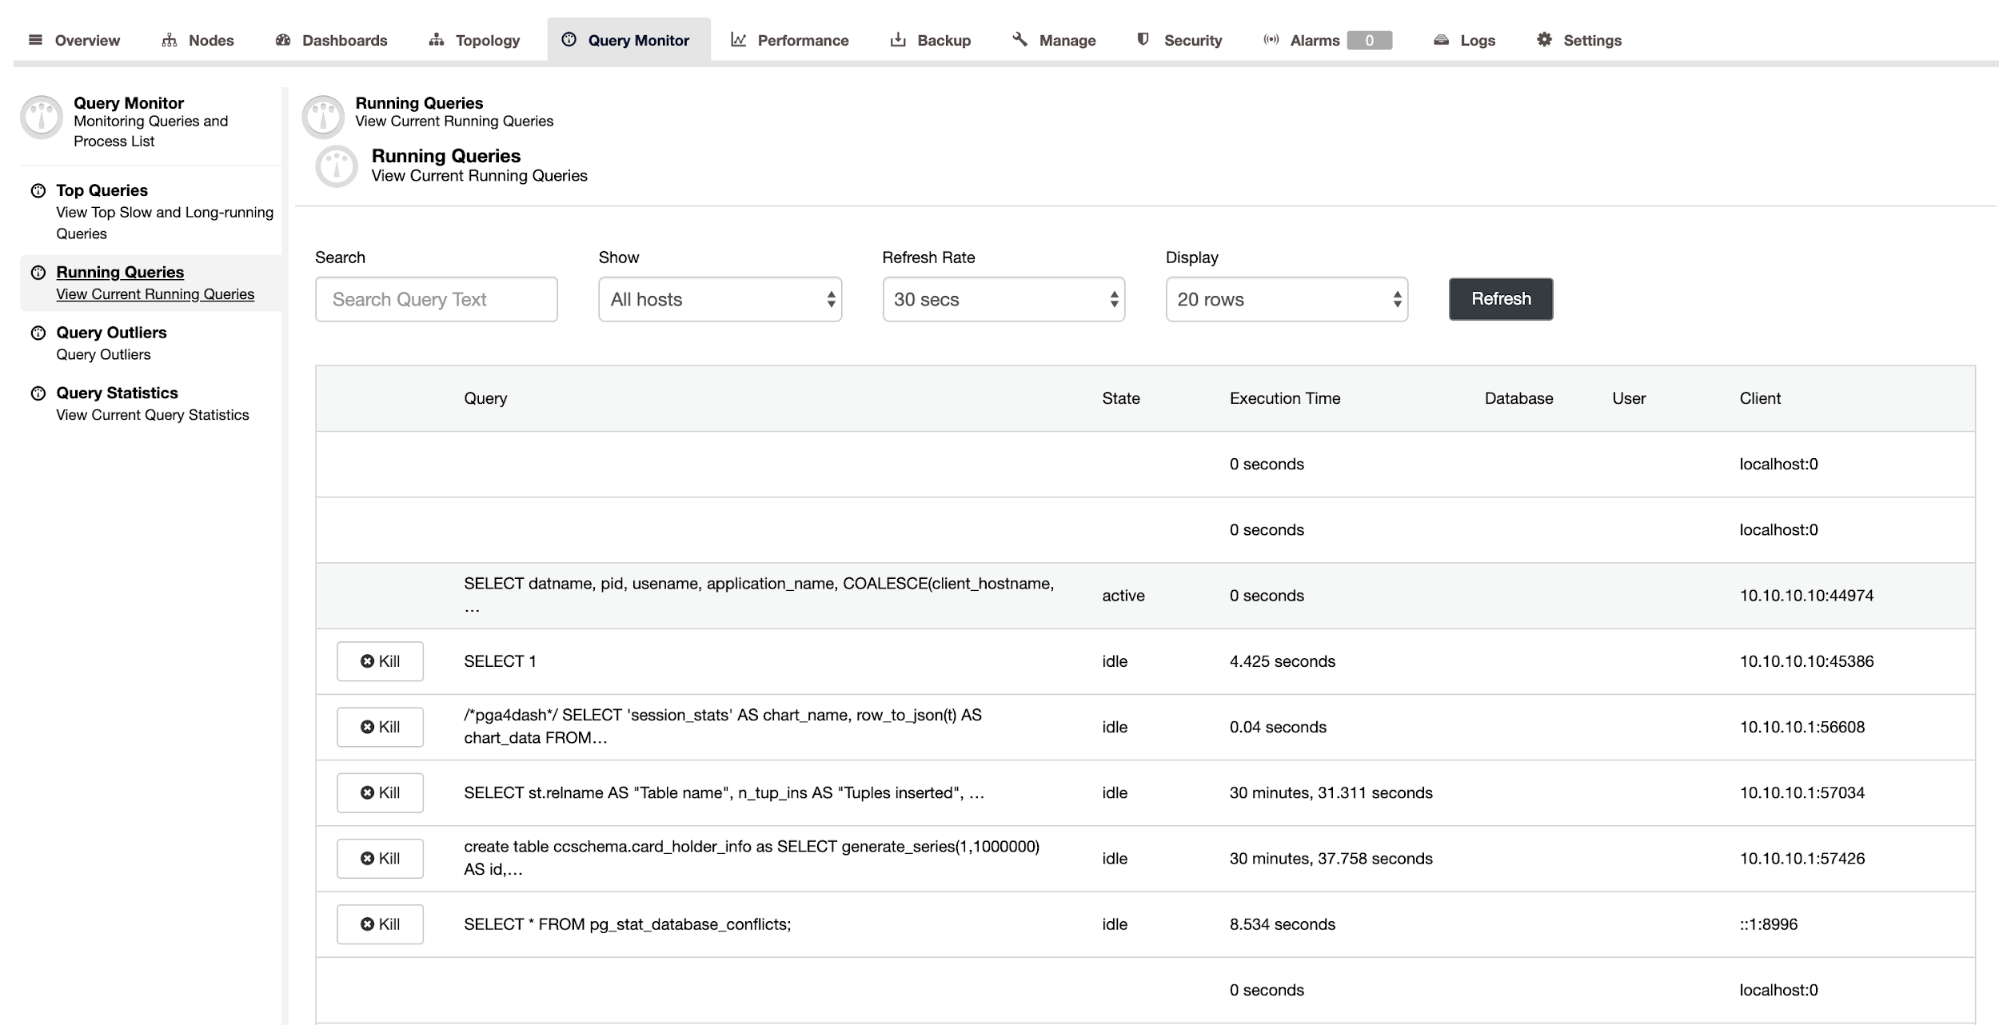
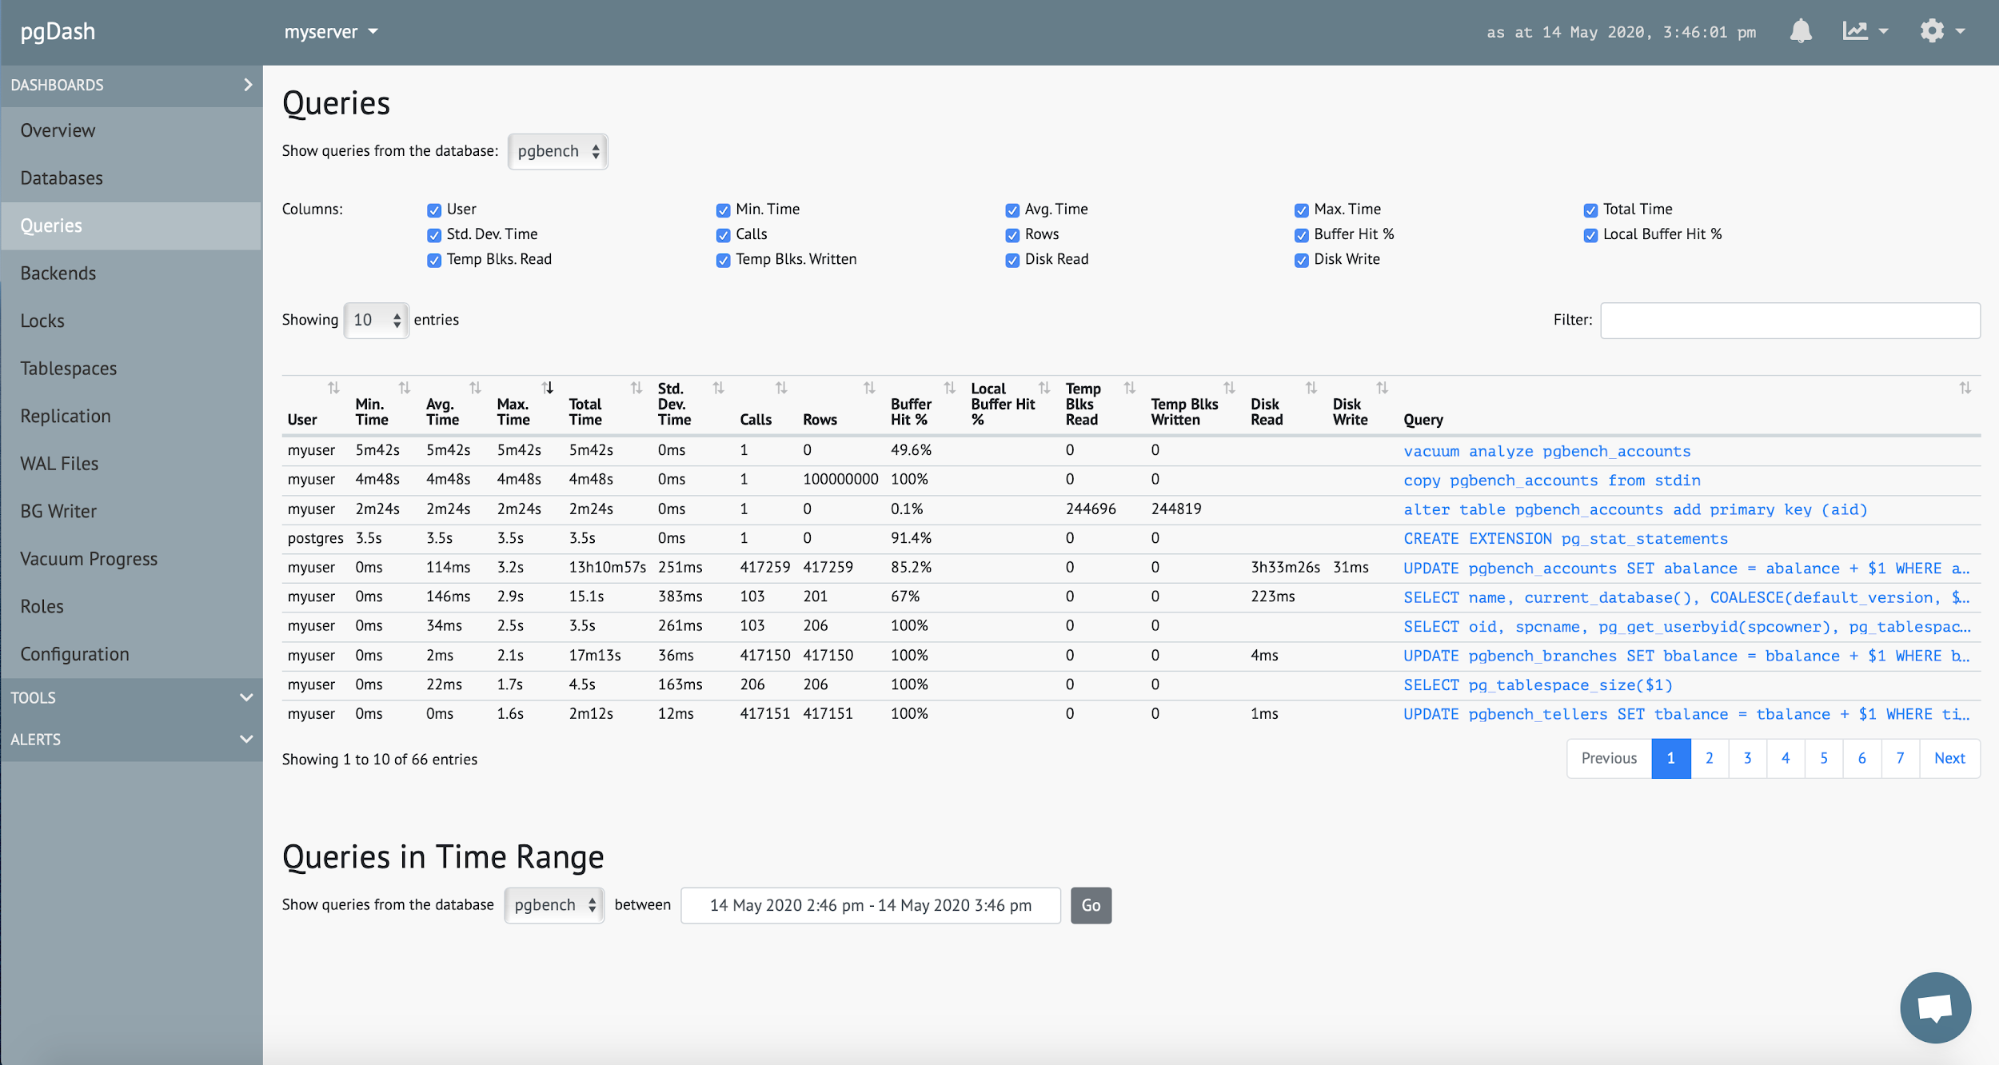
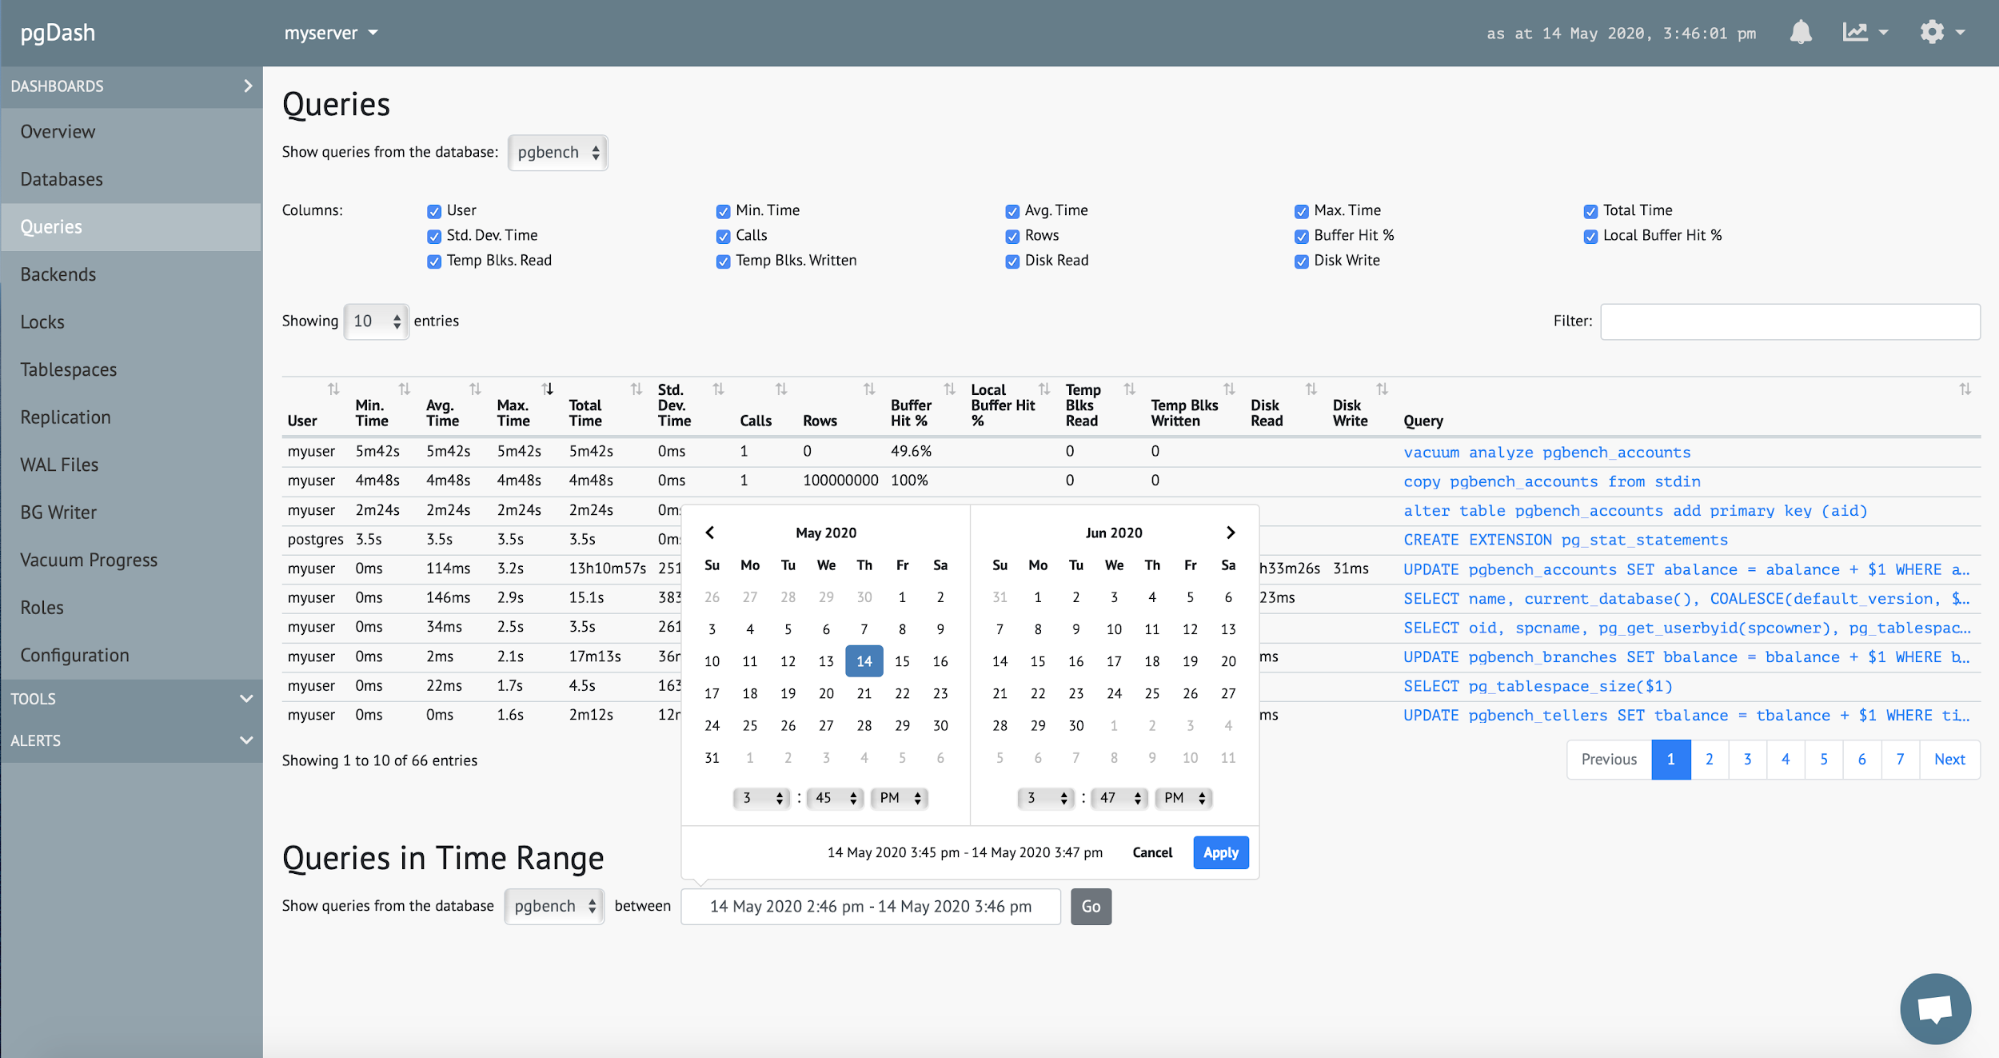
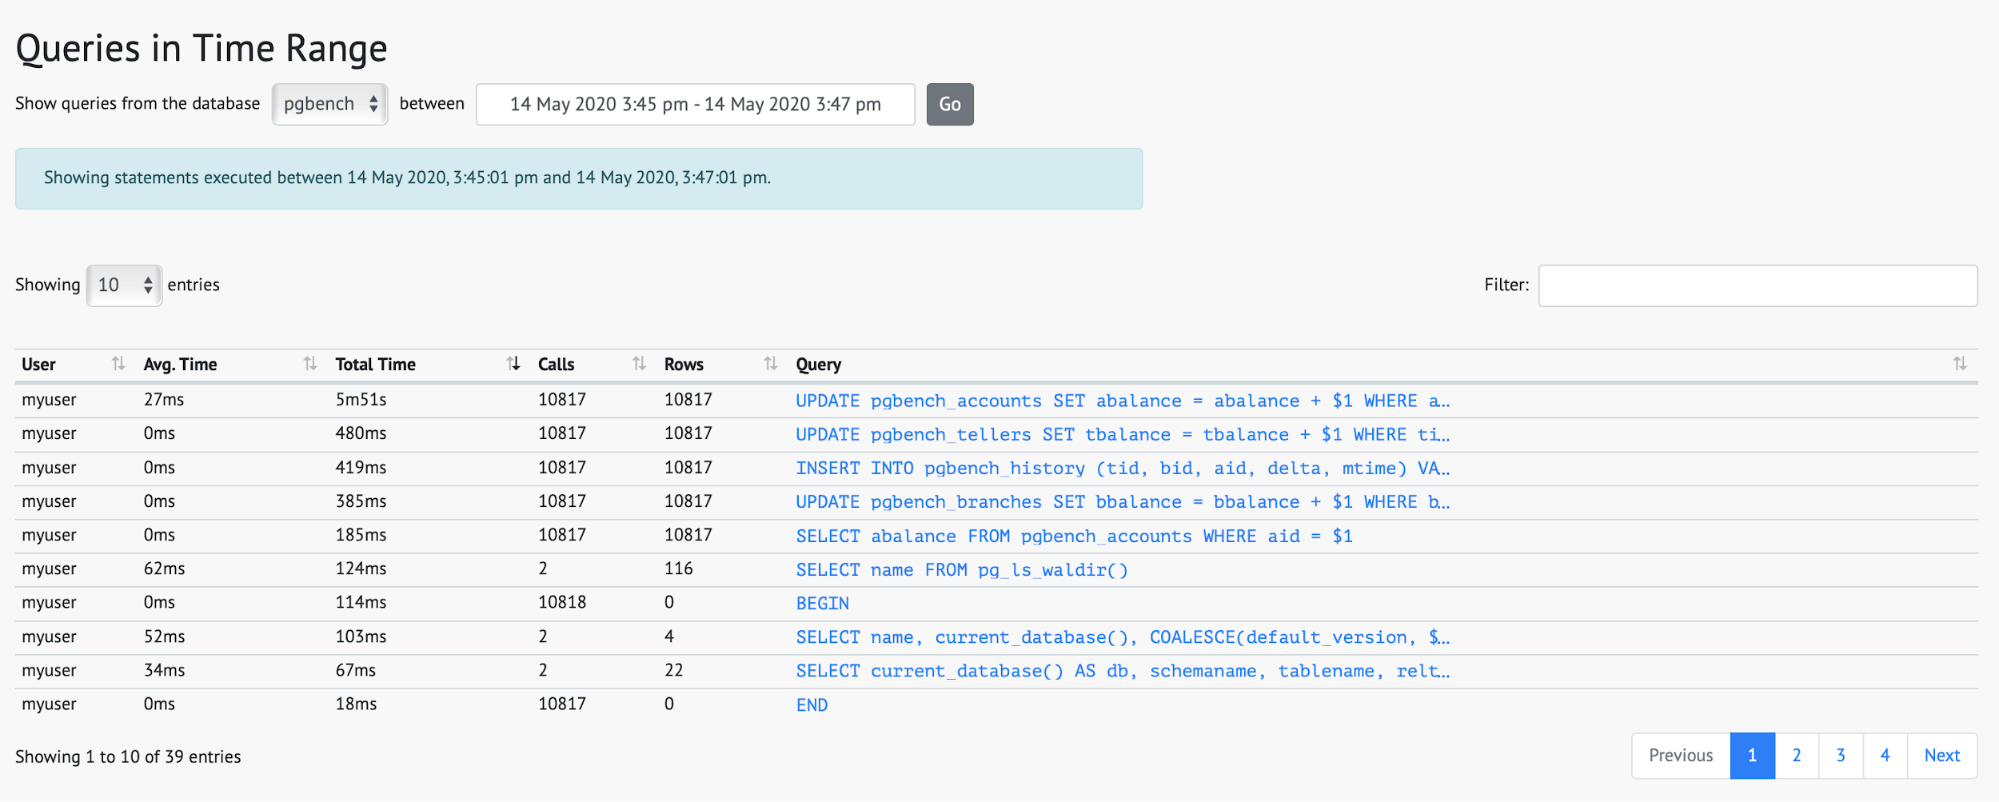
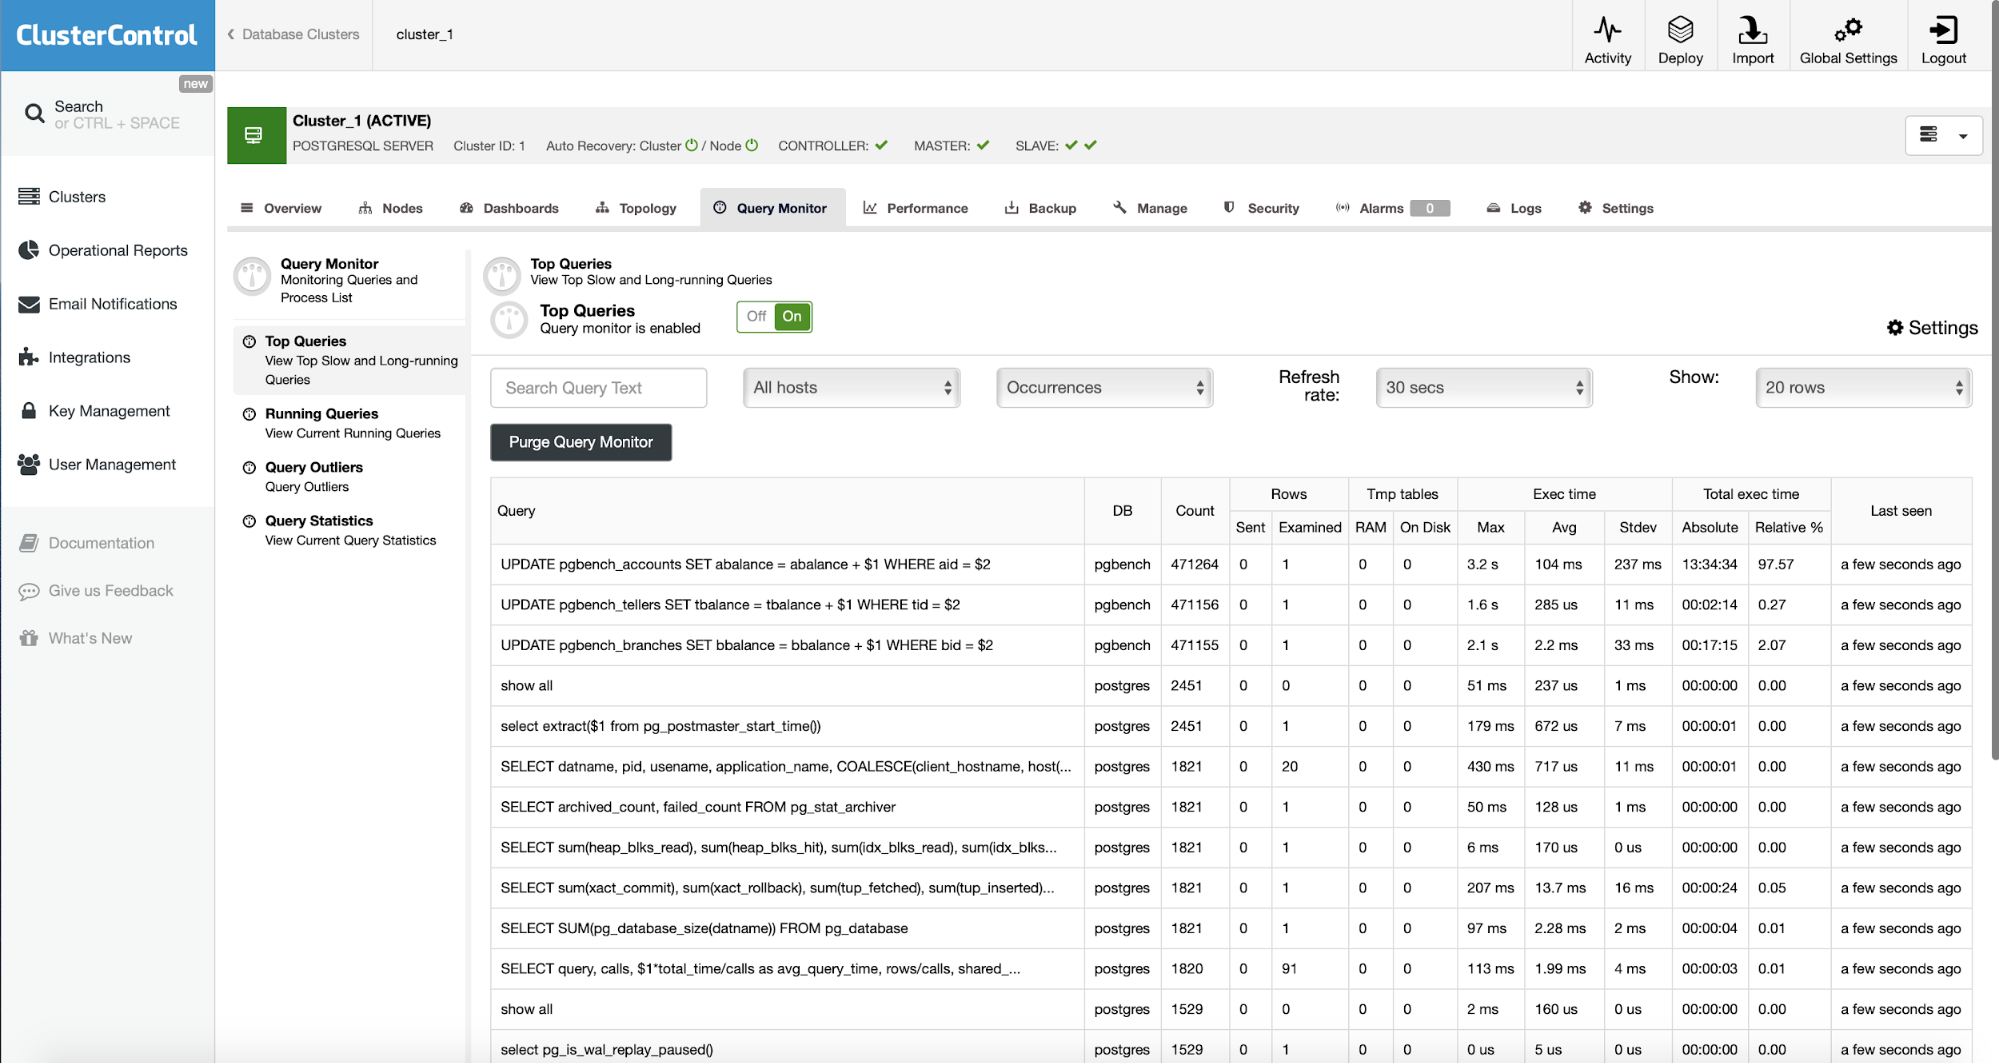
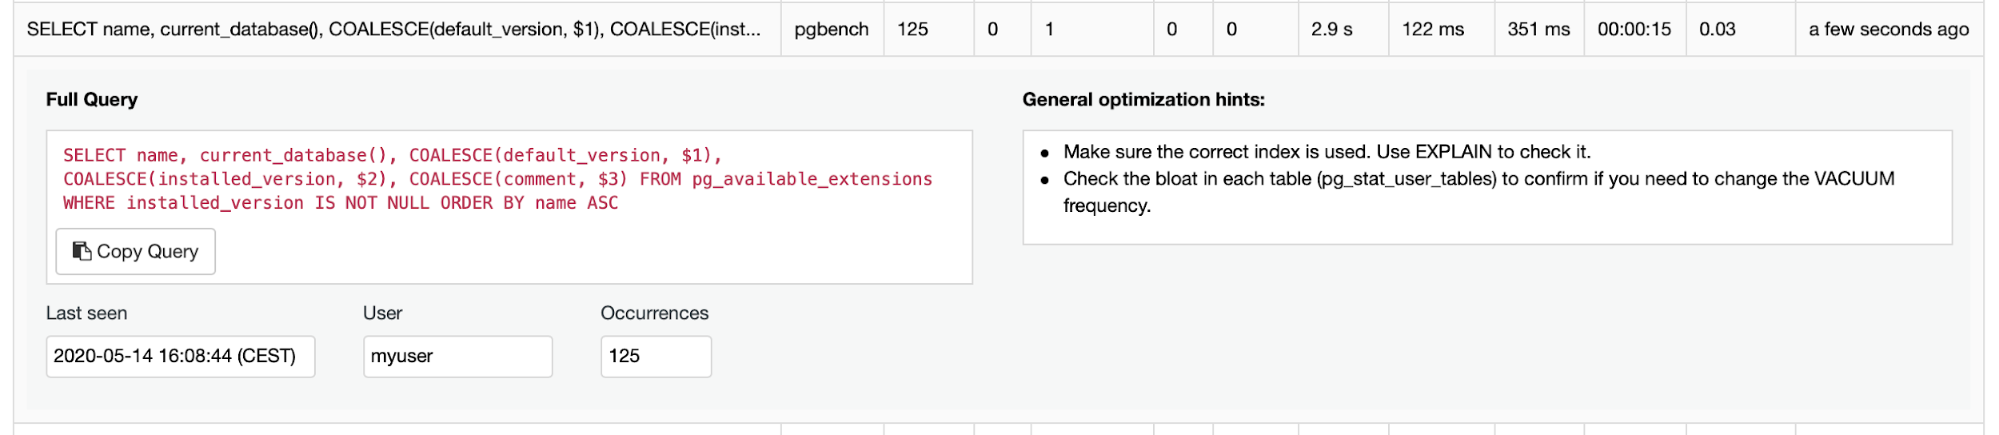
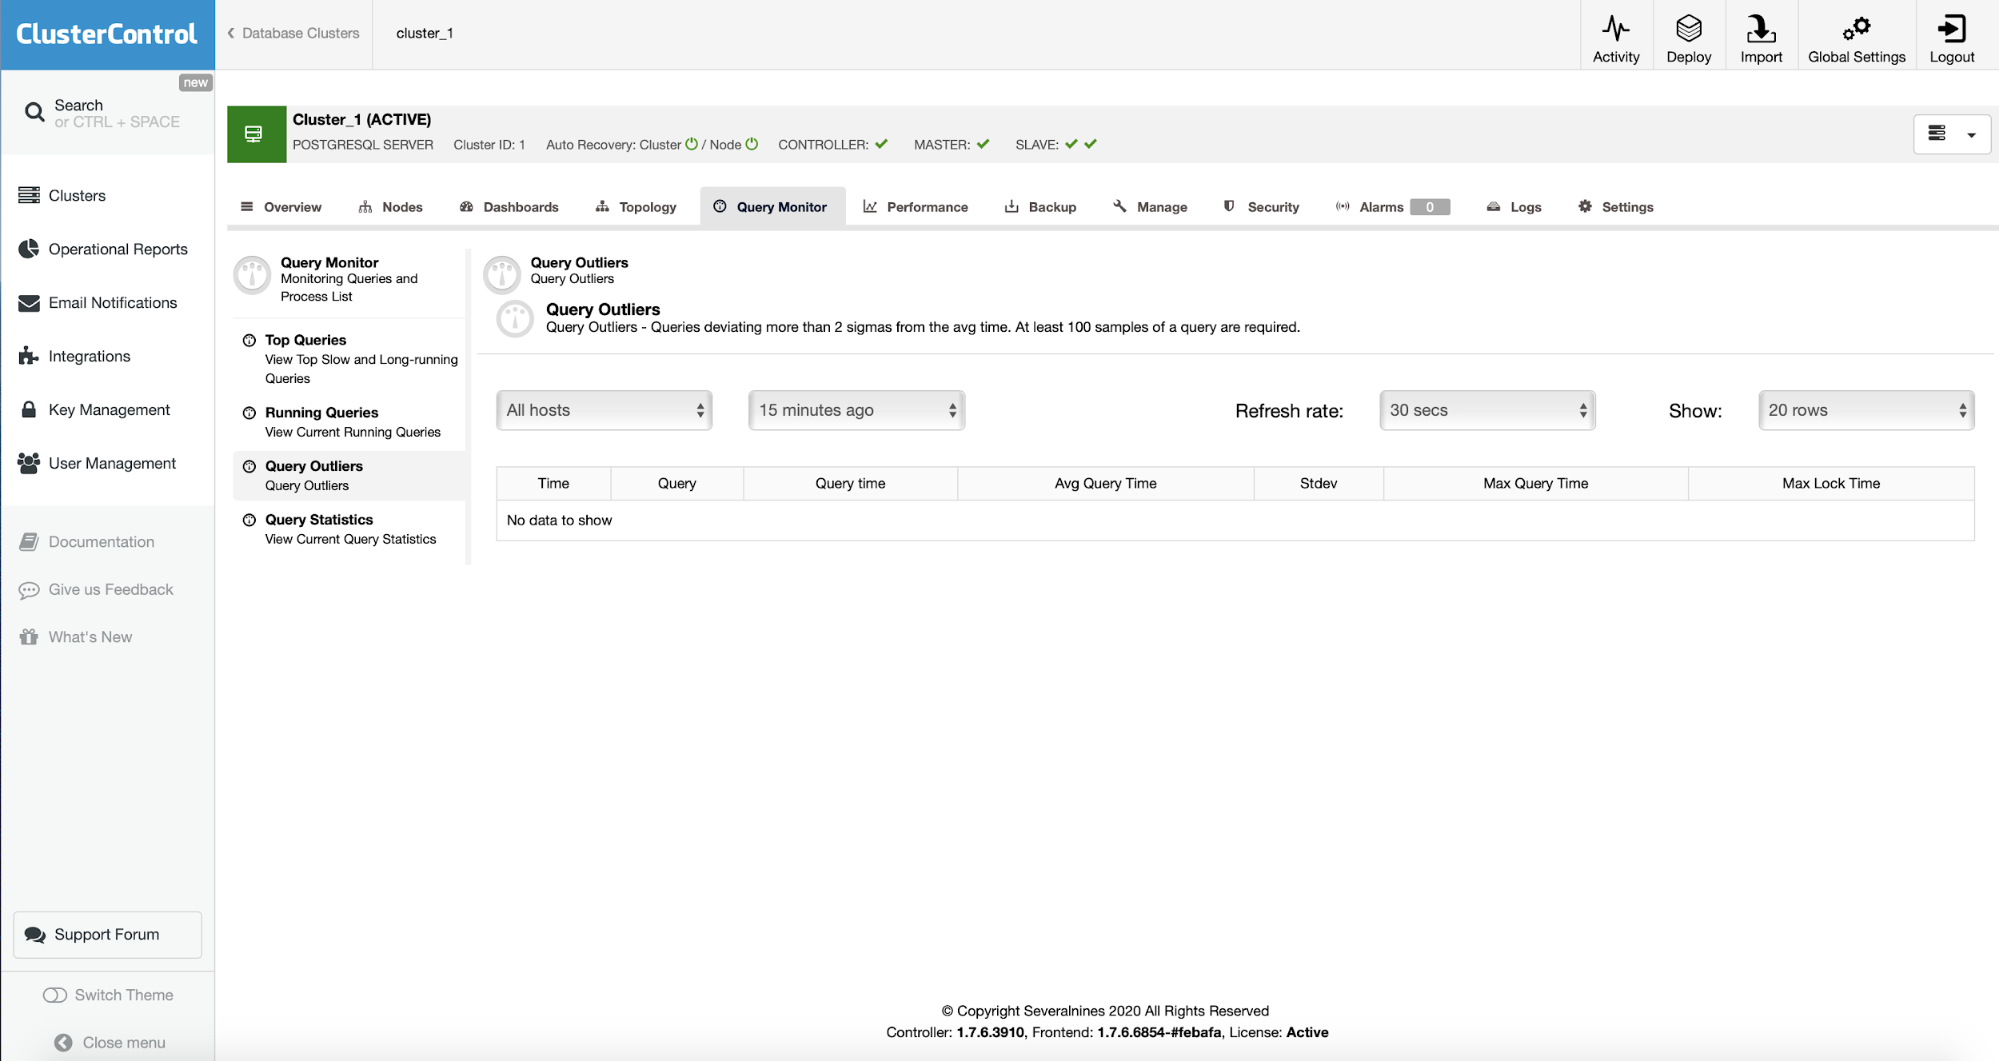
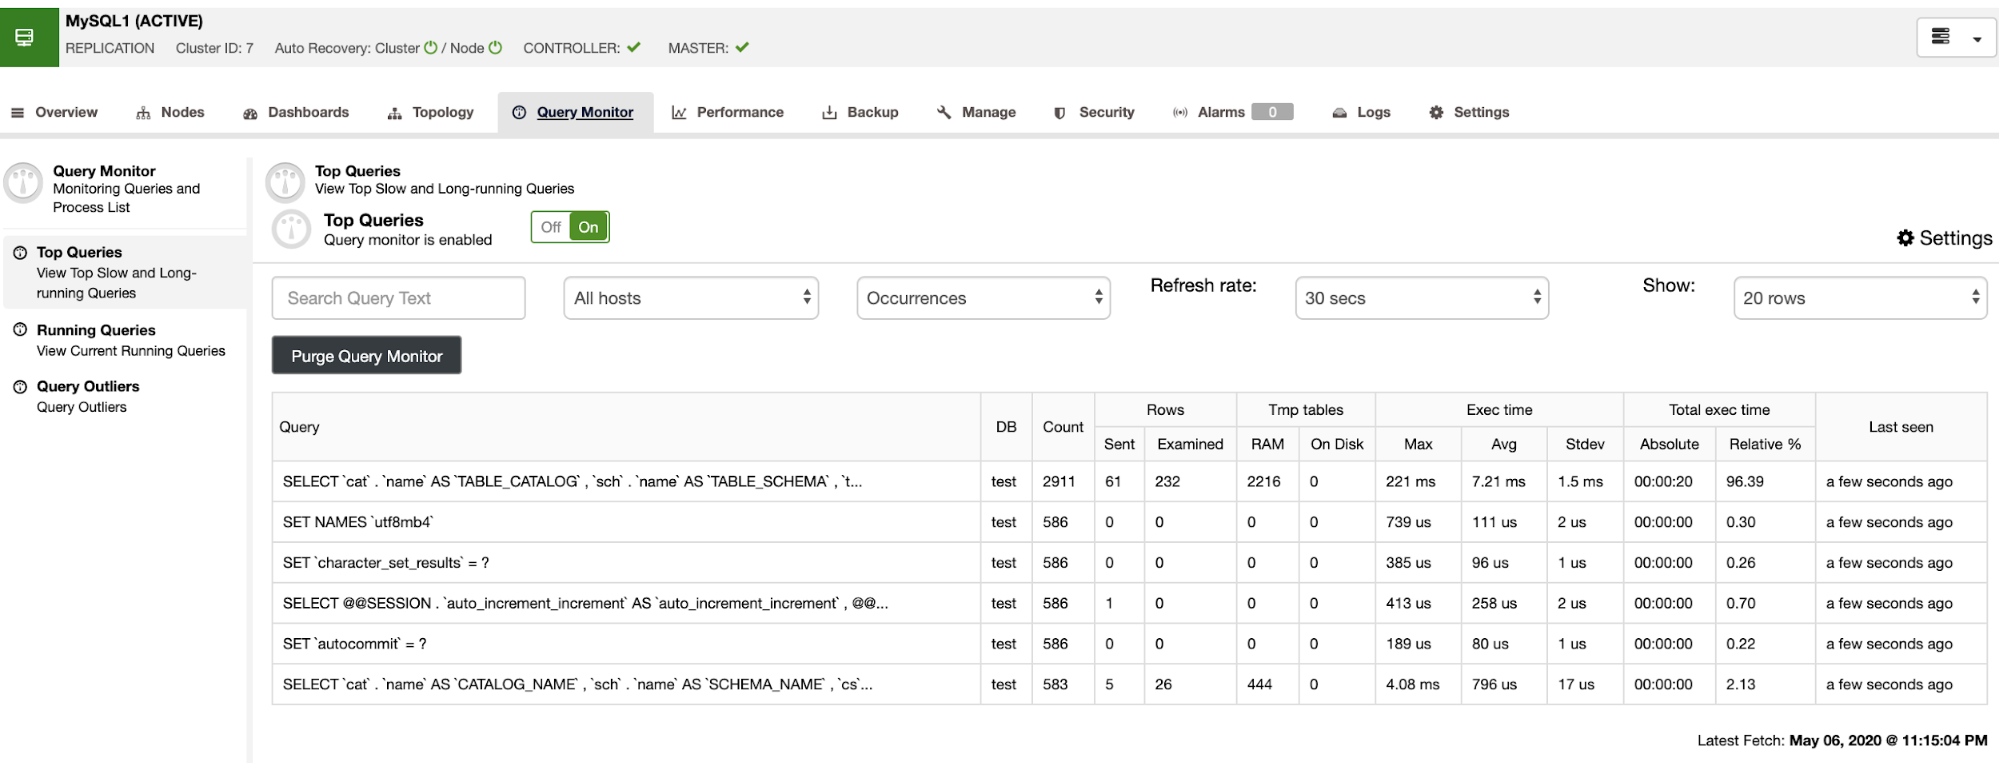
In the “Query Monitor” section, you can see the Top Queries, Running Queries, and Query Outliers.
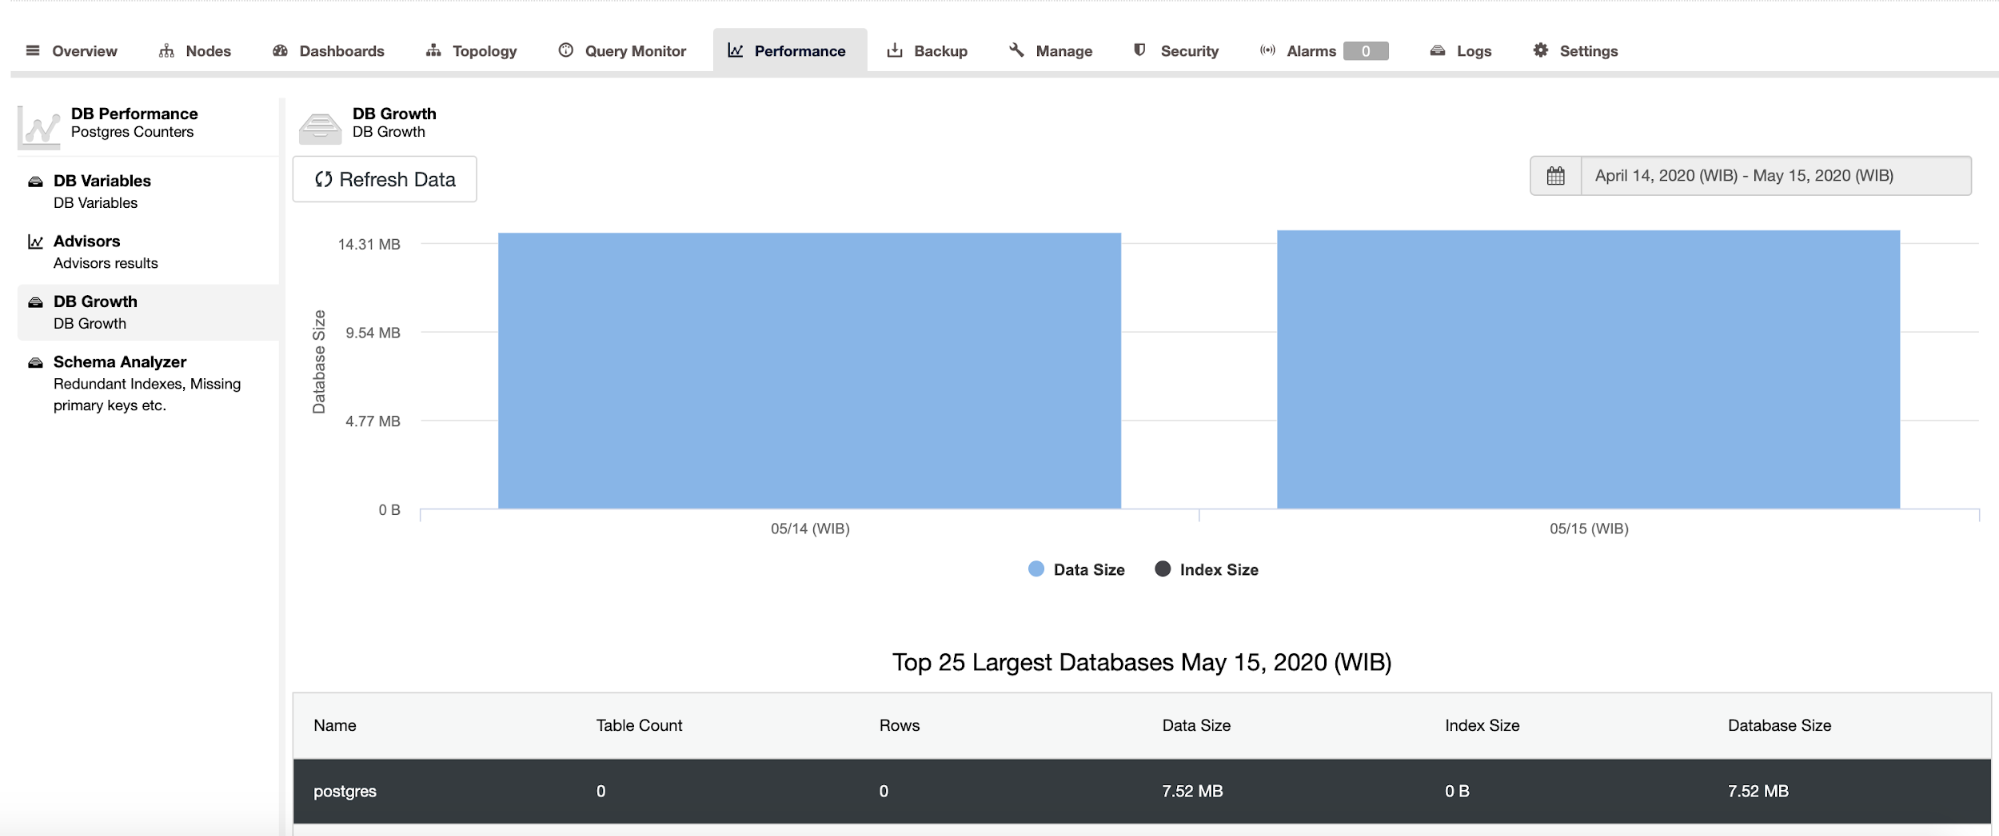
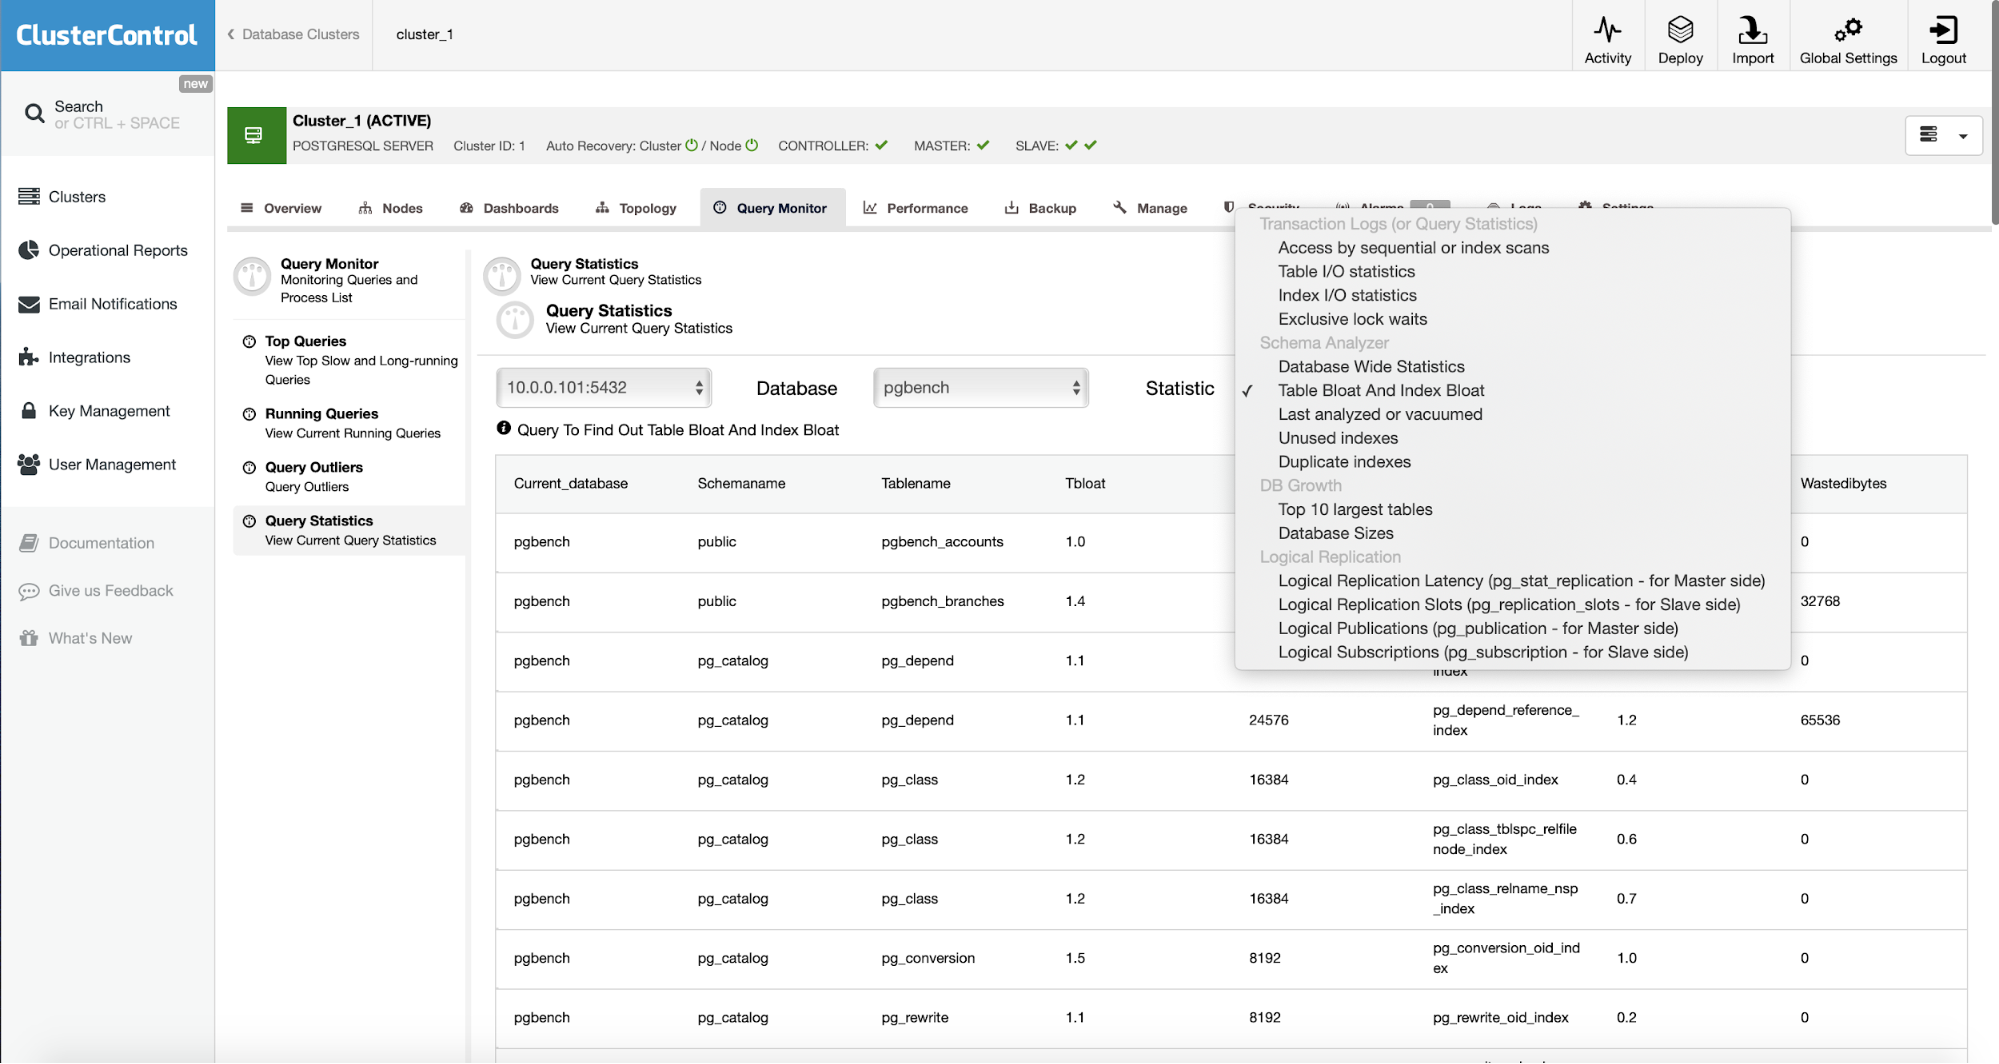
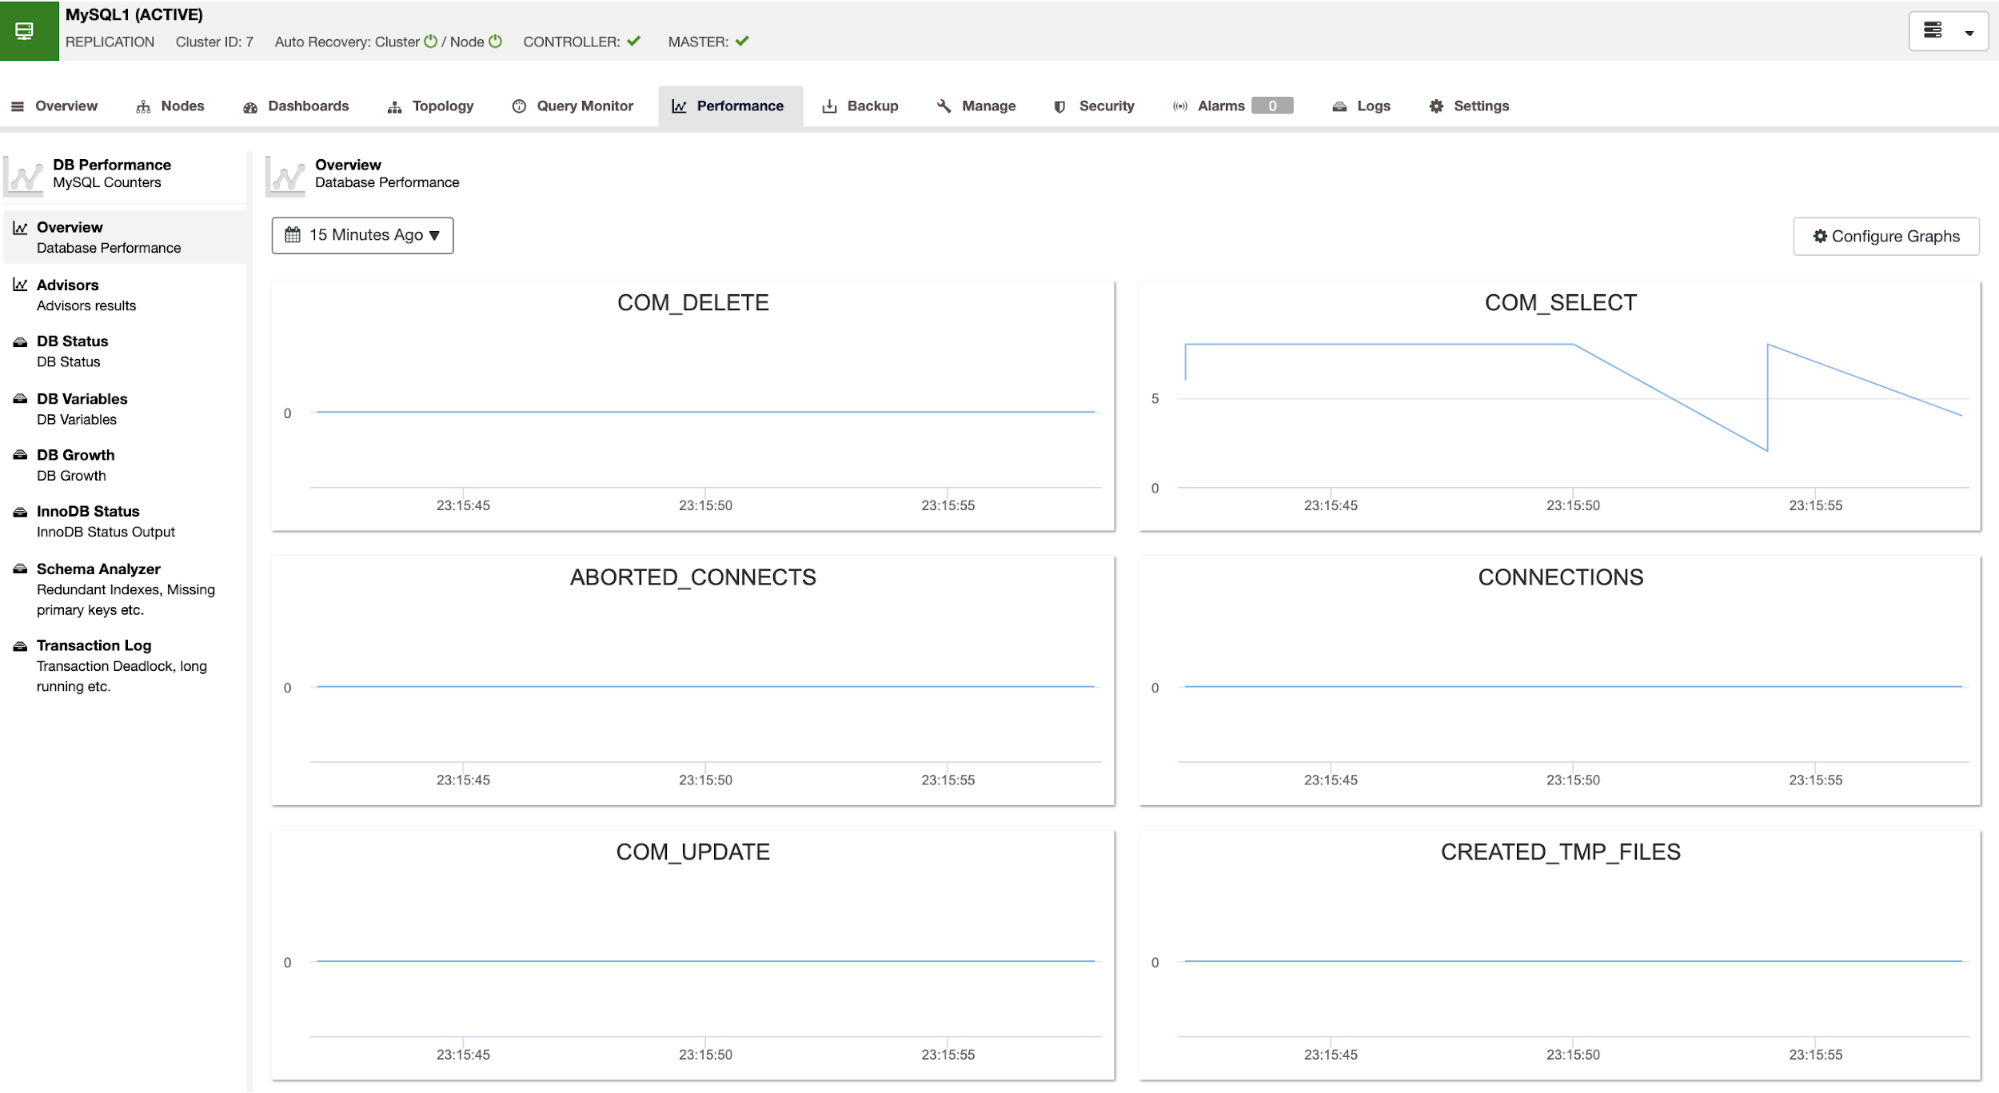
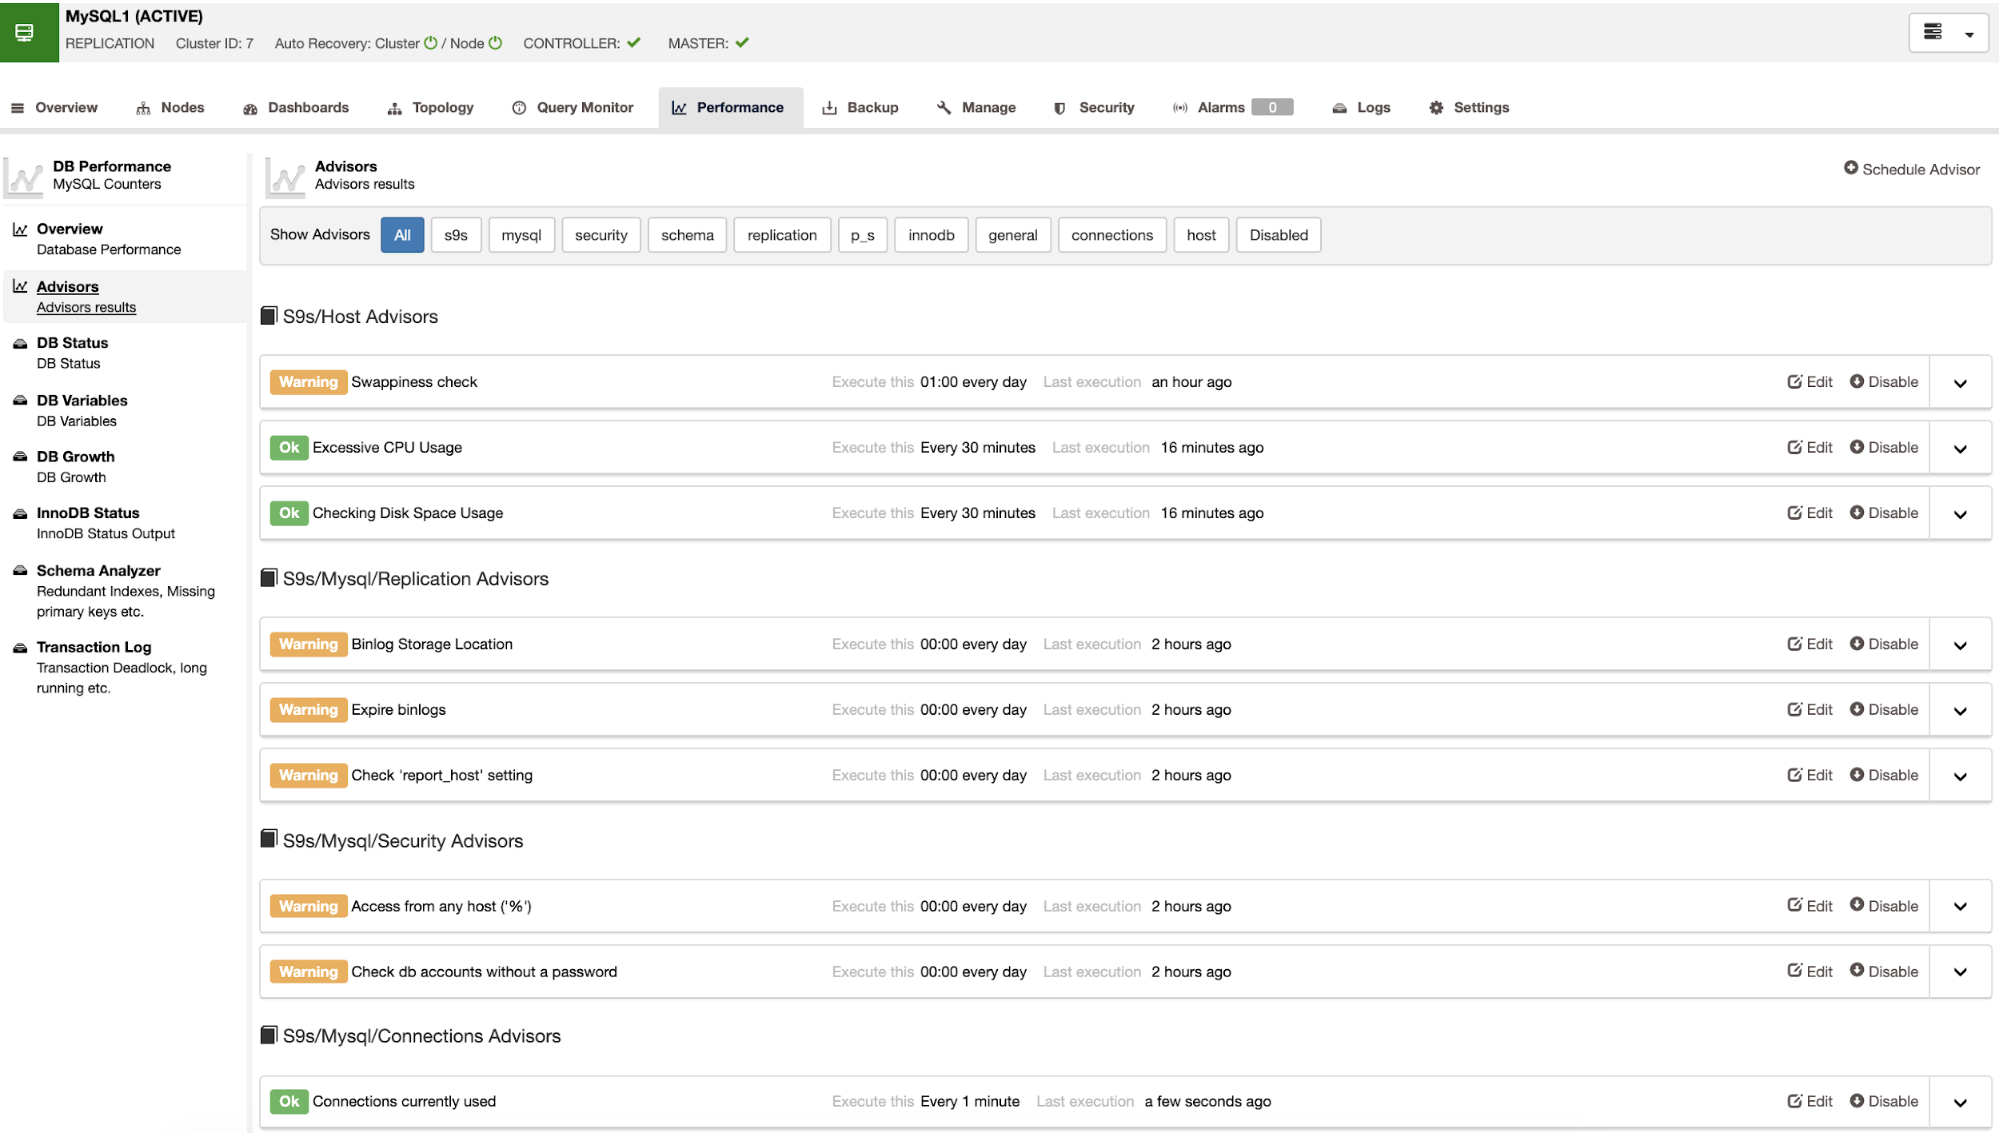
Then, in the “Performance” section, you have information about your database performance, configuration variables, schema analyzer, transaction log, and even more.
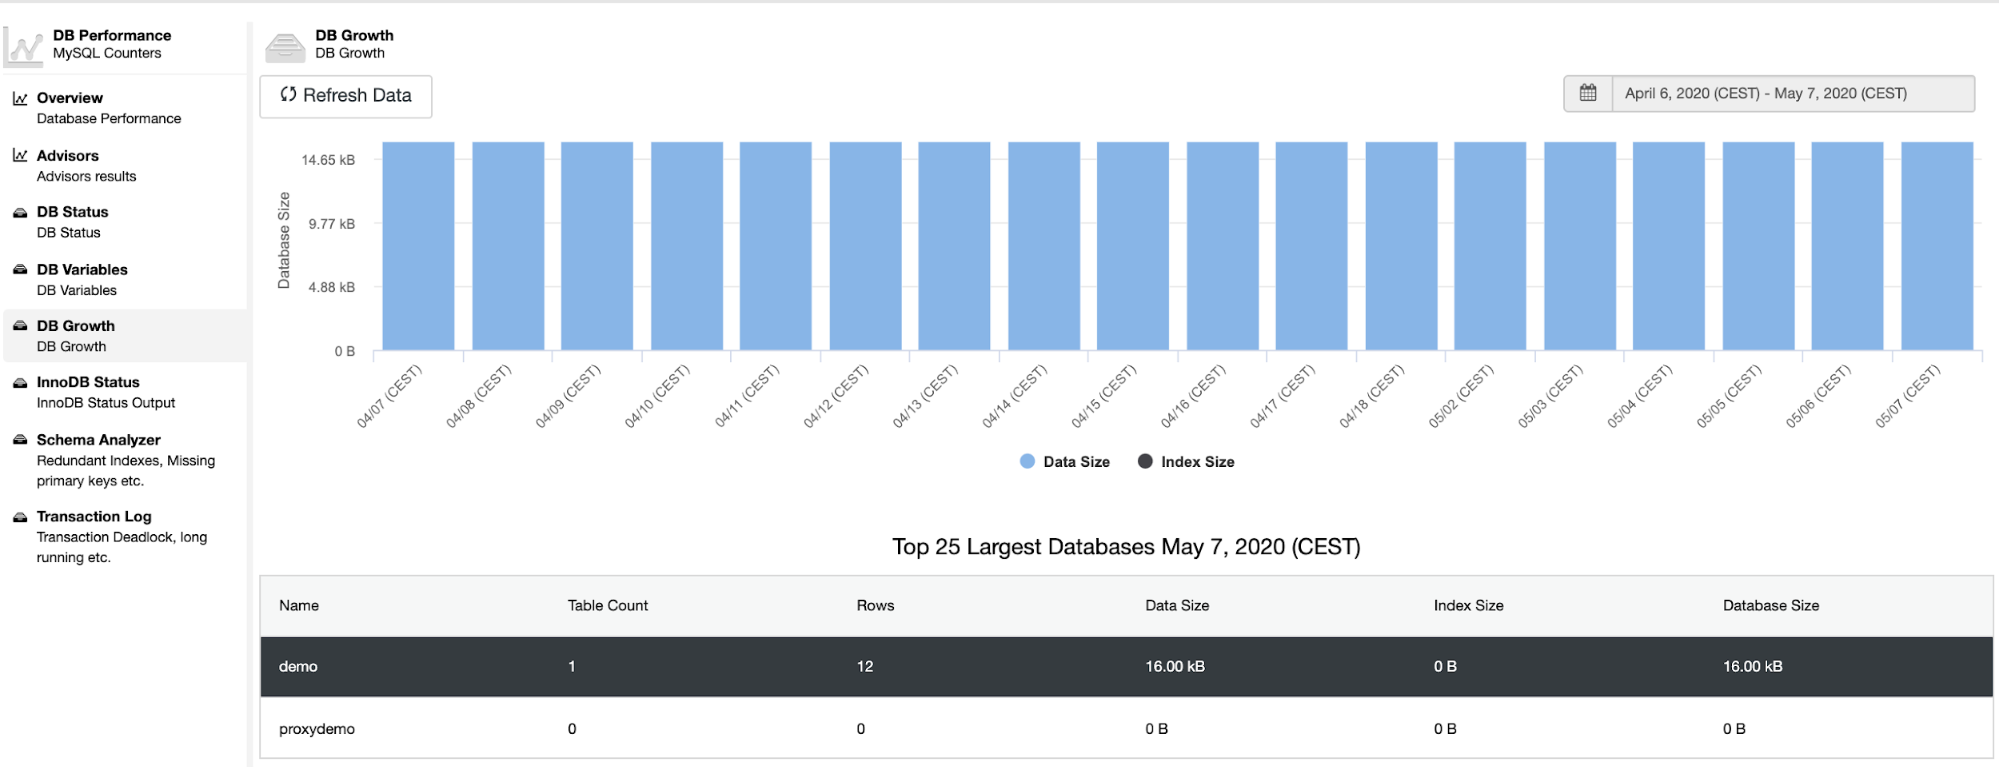
In the same section, you can check the database growth, that will show the Data Size and Index Size for each database.
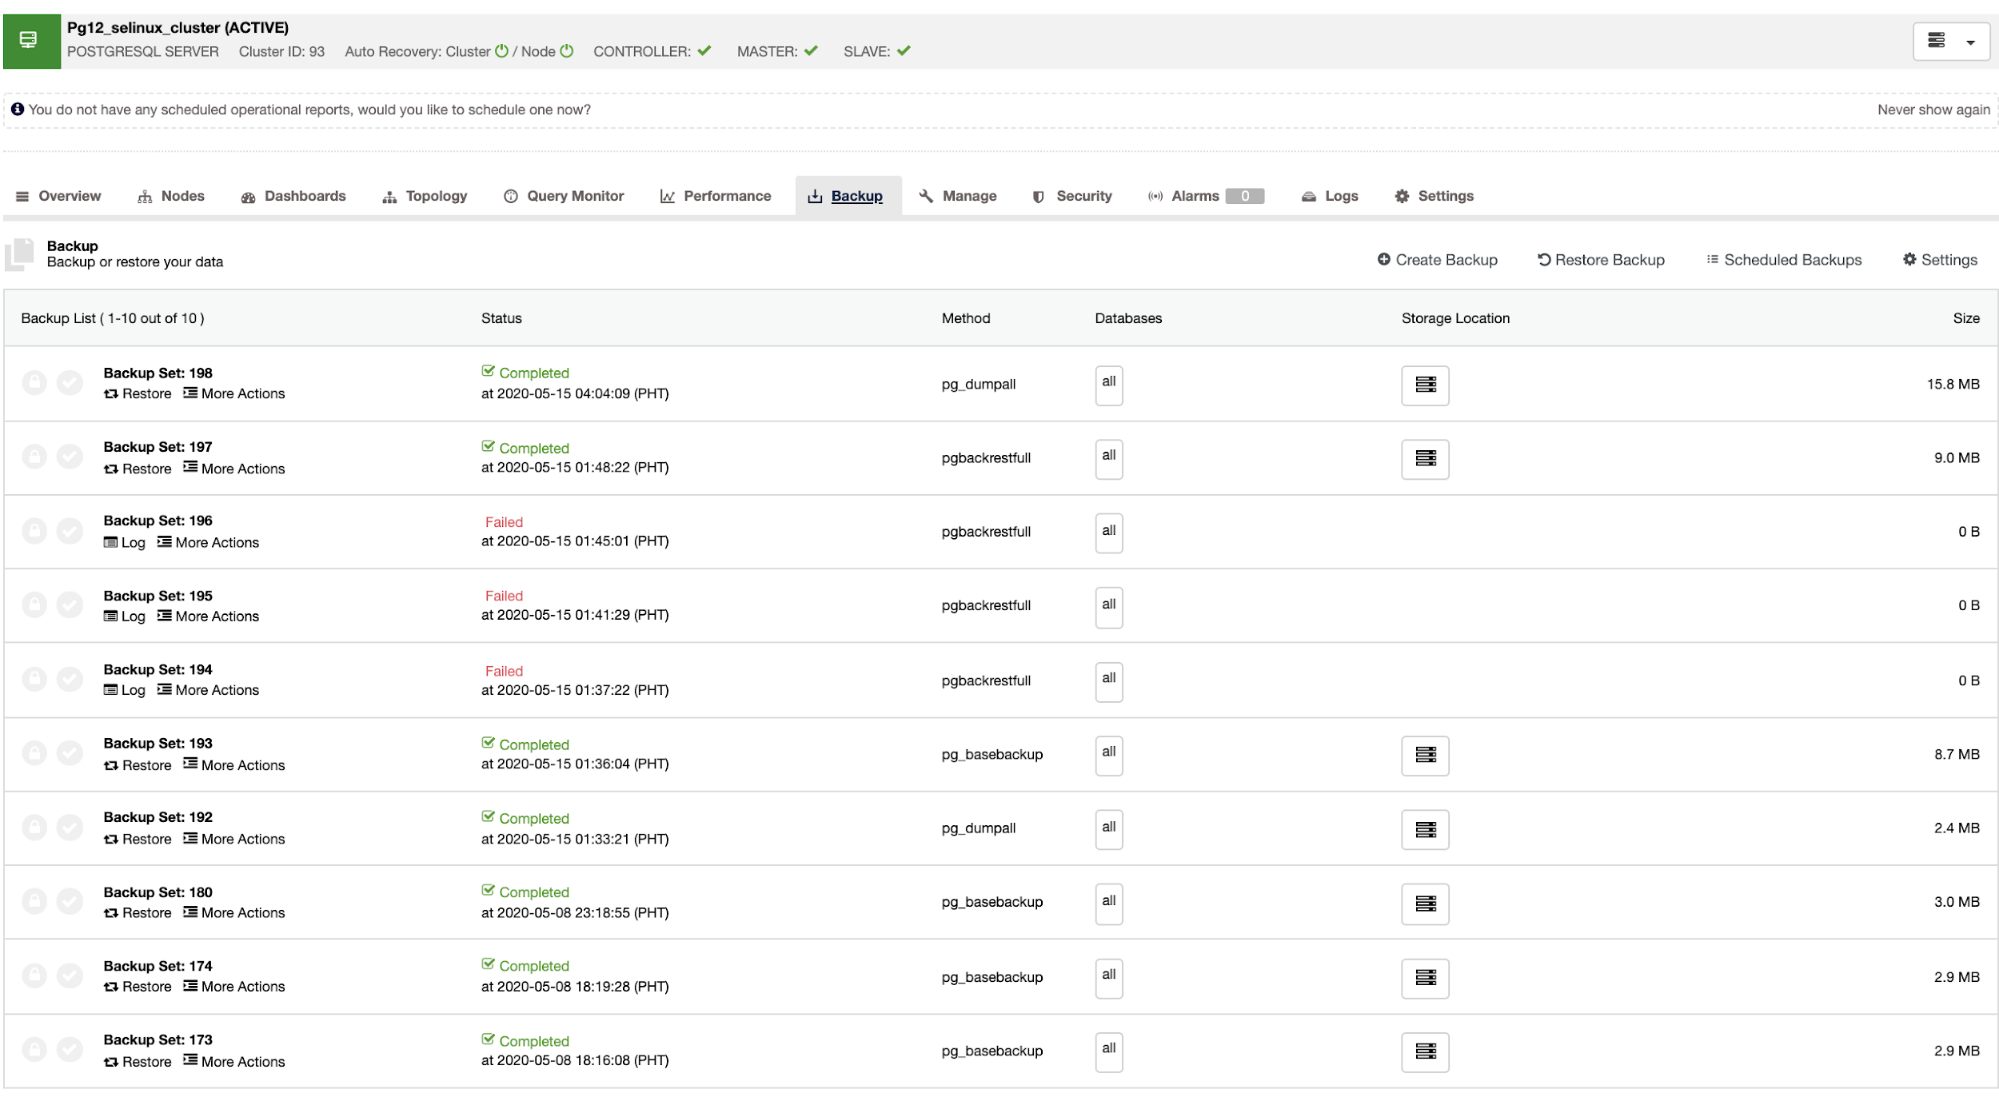
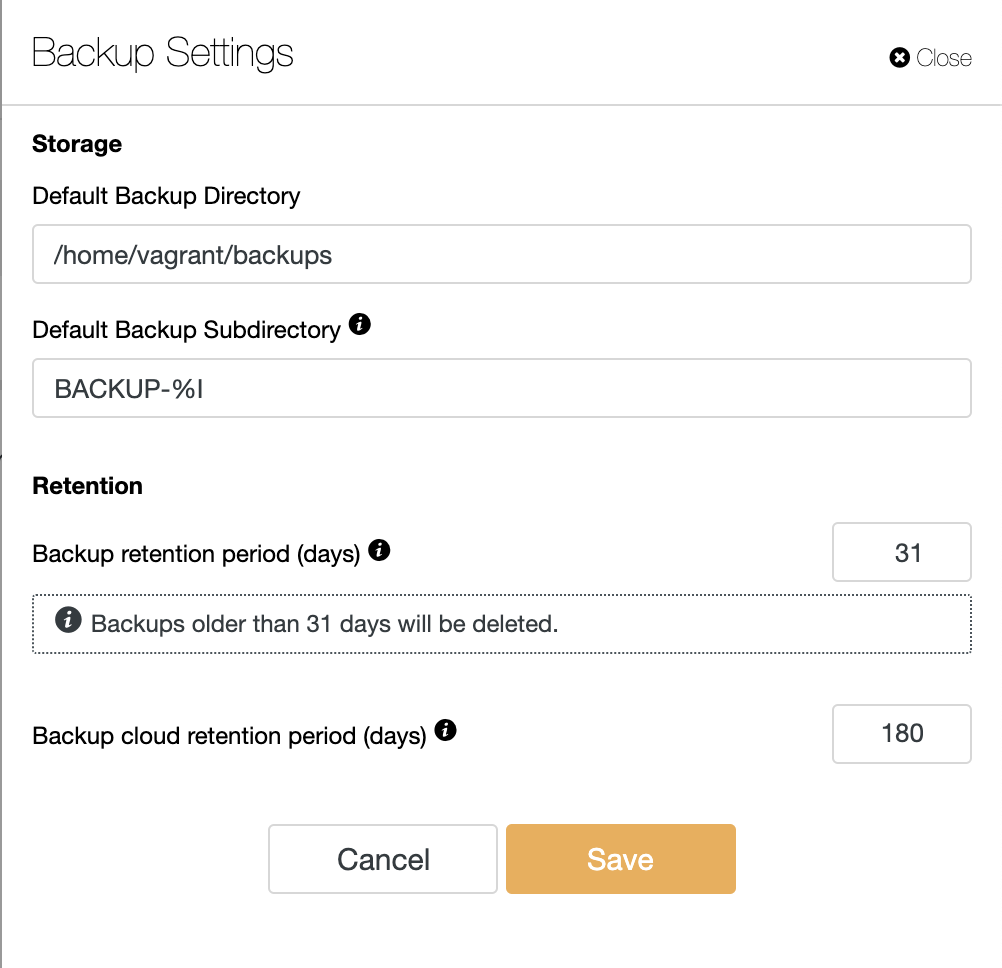
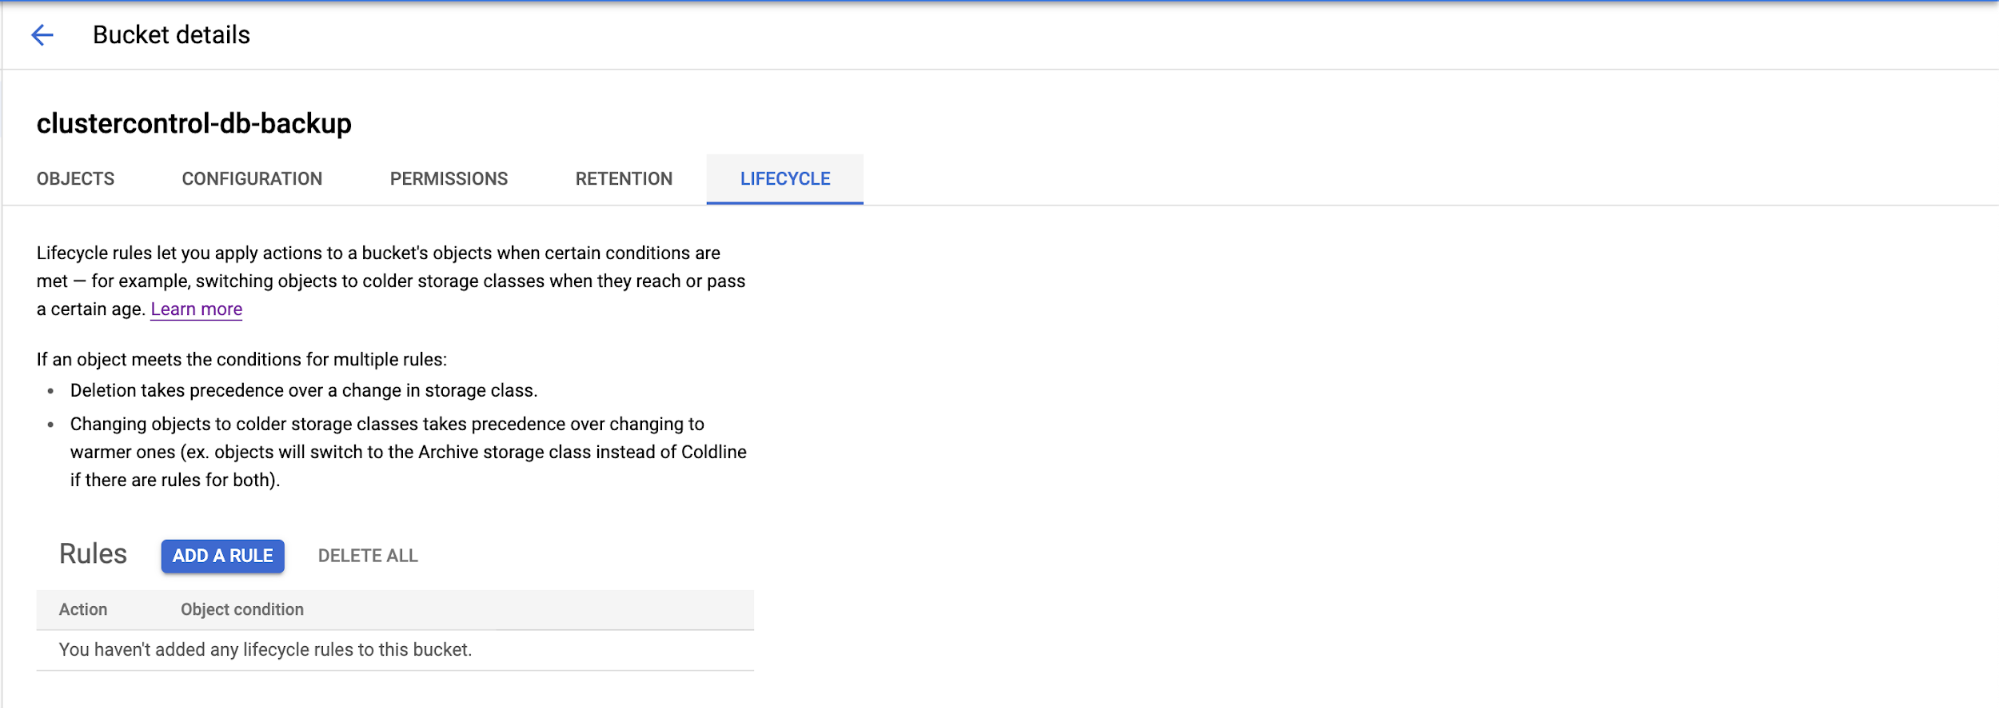
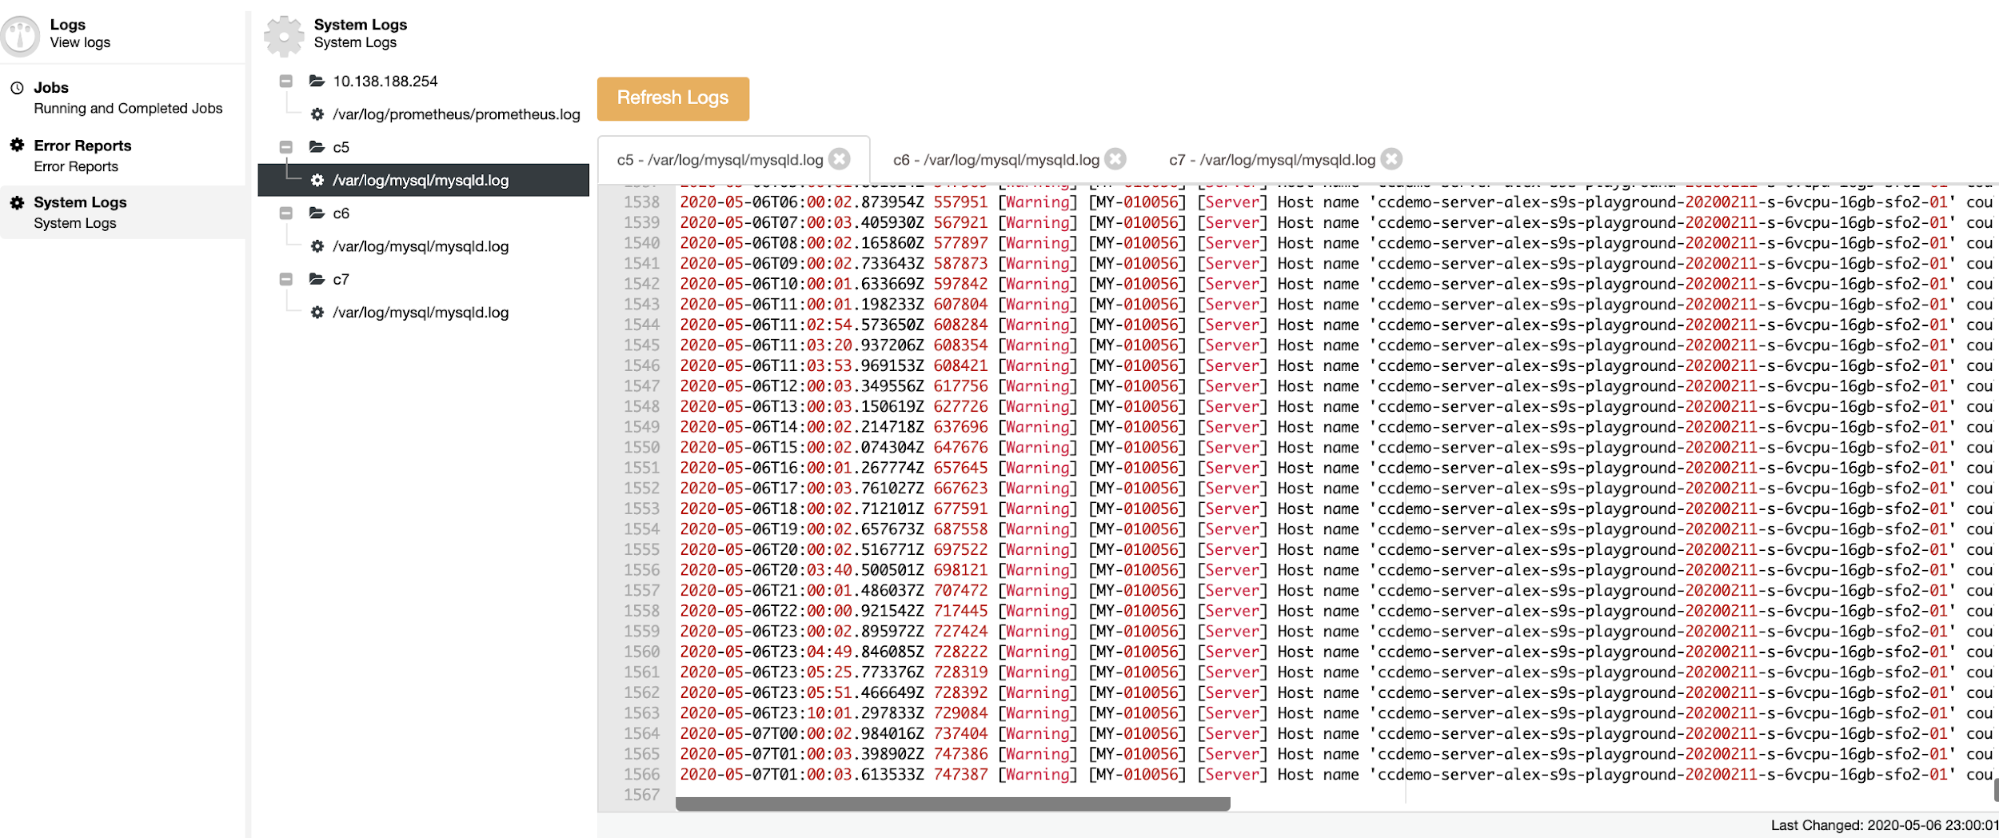
You can check the “Log” section, to monitor not only the ClusterControl log but also the Operating System and Database logs, so you don’t need to access the server to check this.
Database Alarms & Notifications
Manage Engine Applications Manager Notifications
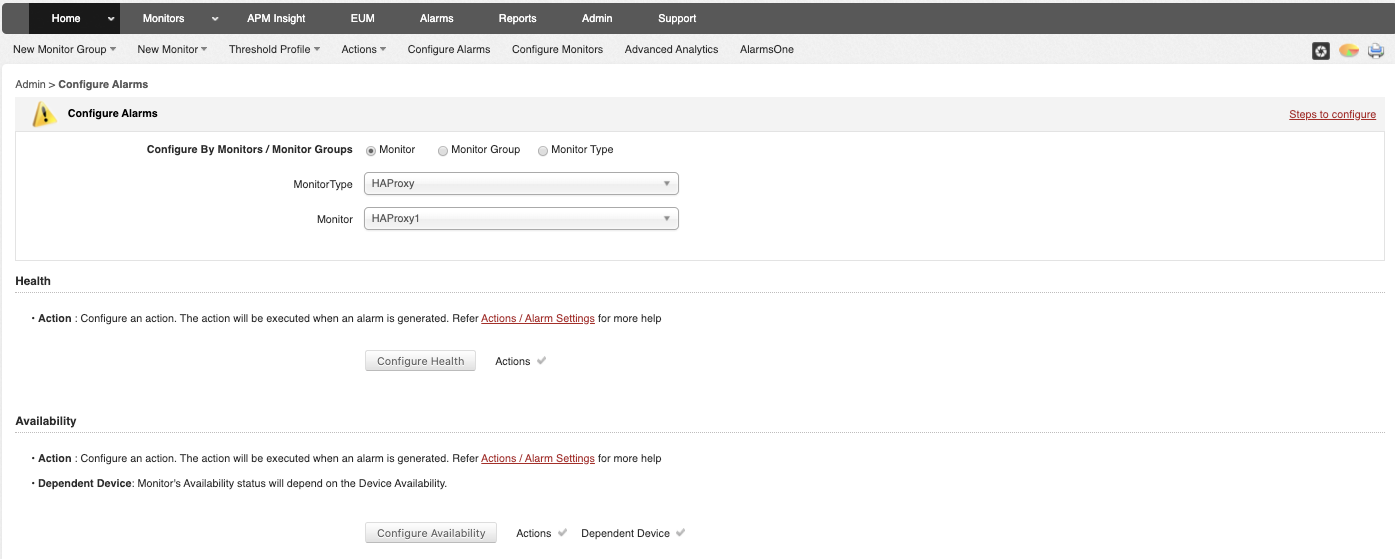
A good monitoring system requires alarms to alert you in case of failure. This system has its own alarm system where you must configure actions to be run when the alarm is generated.
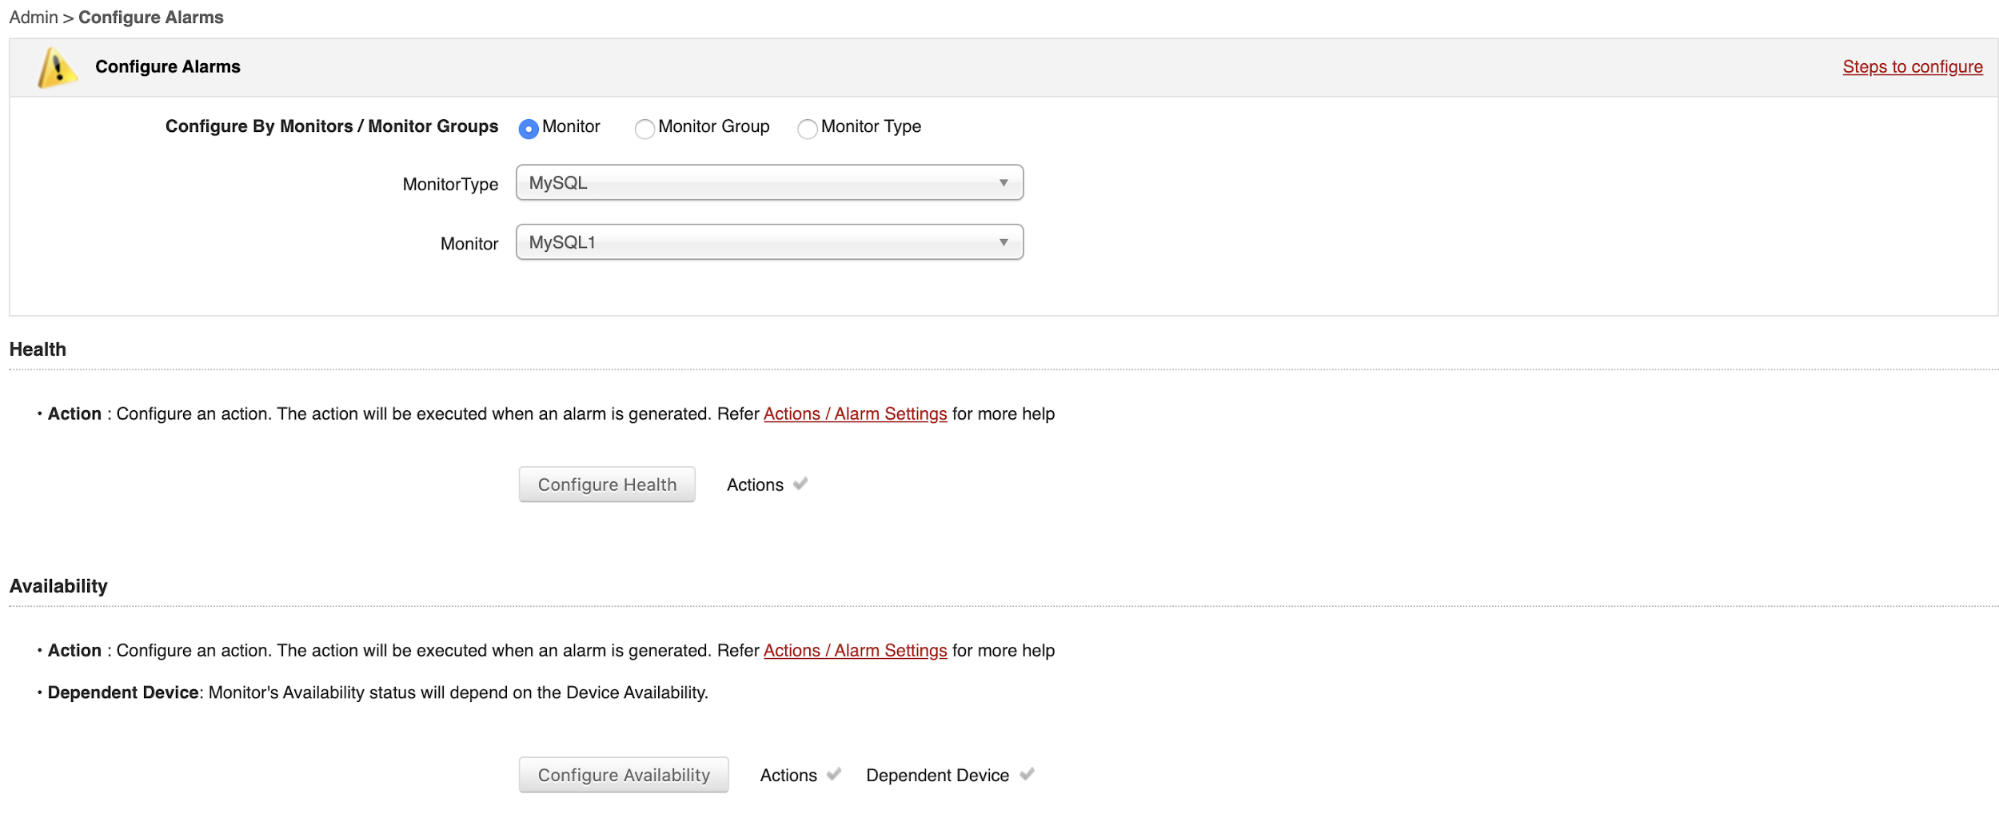
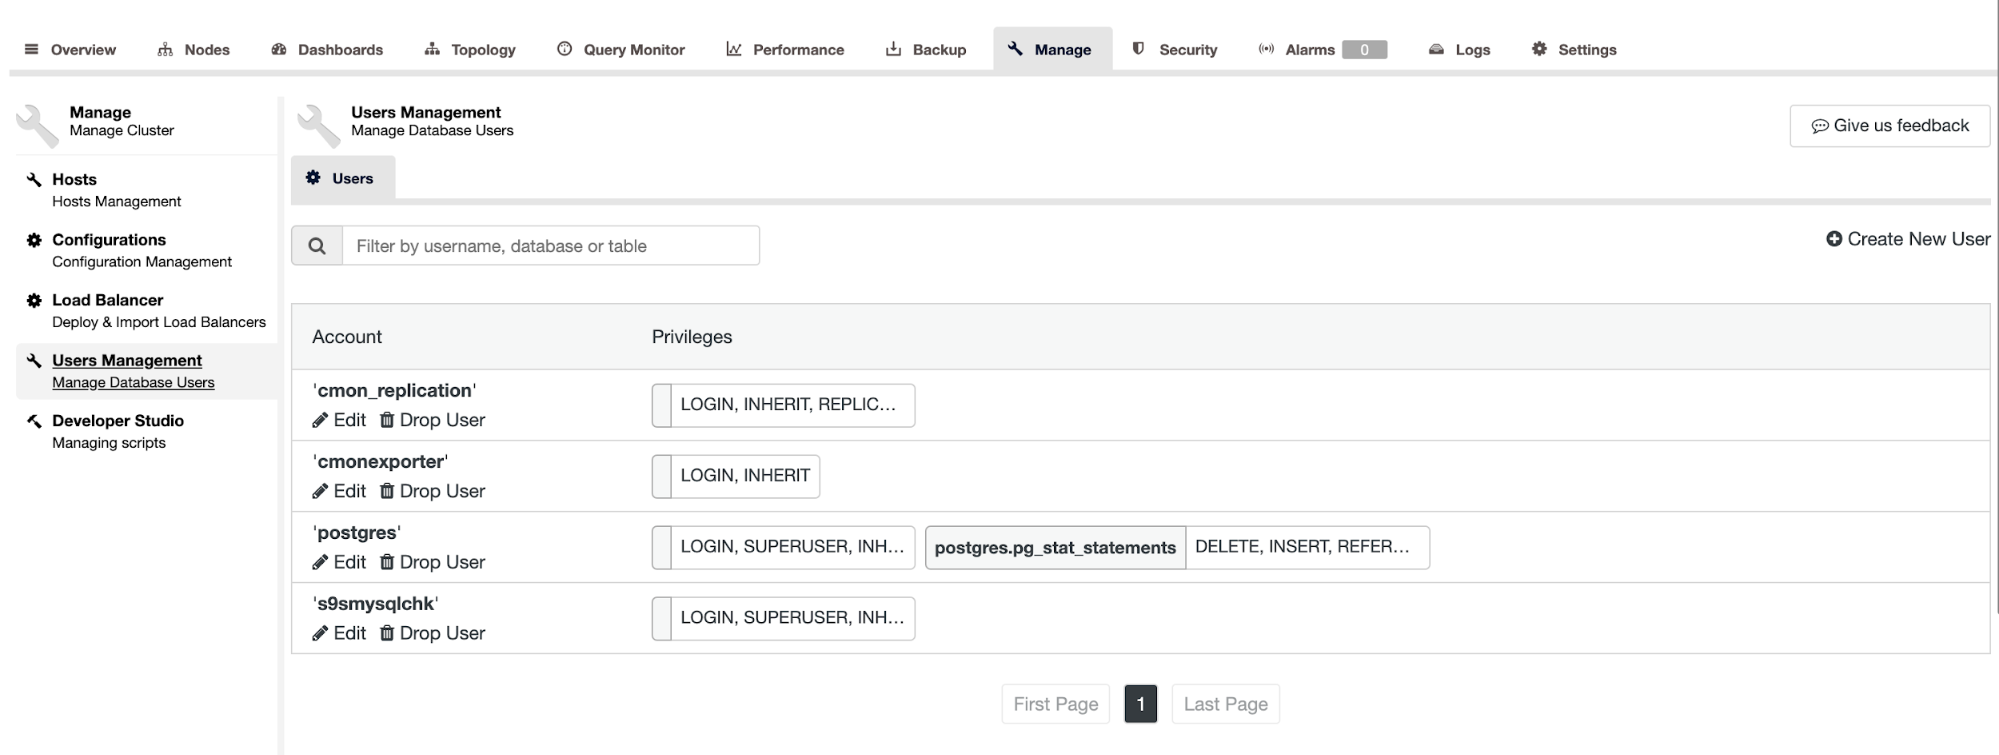
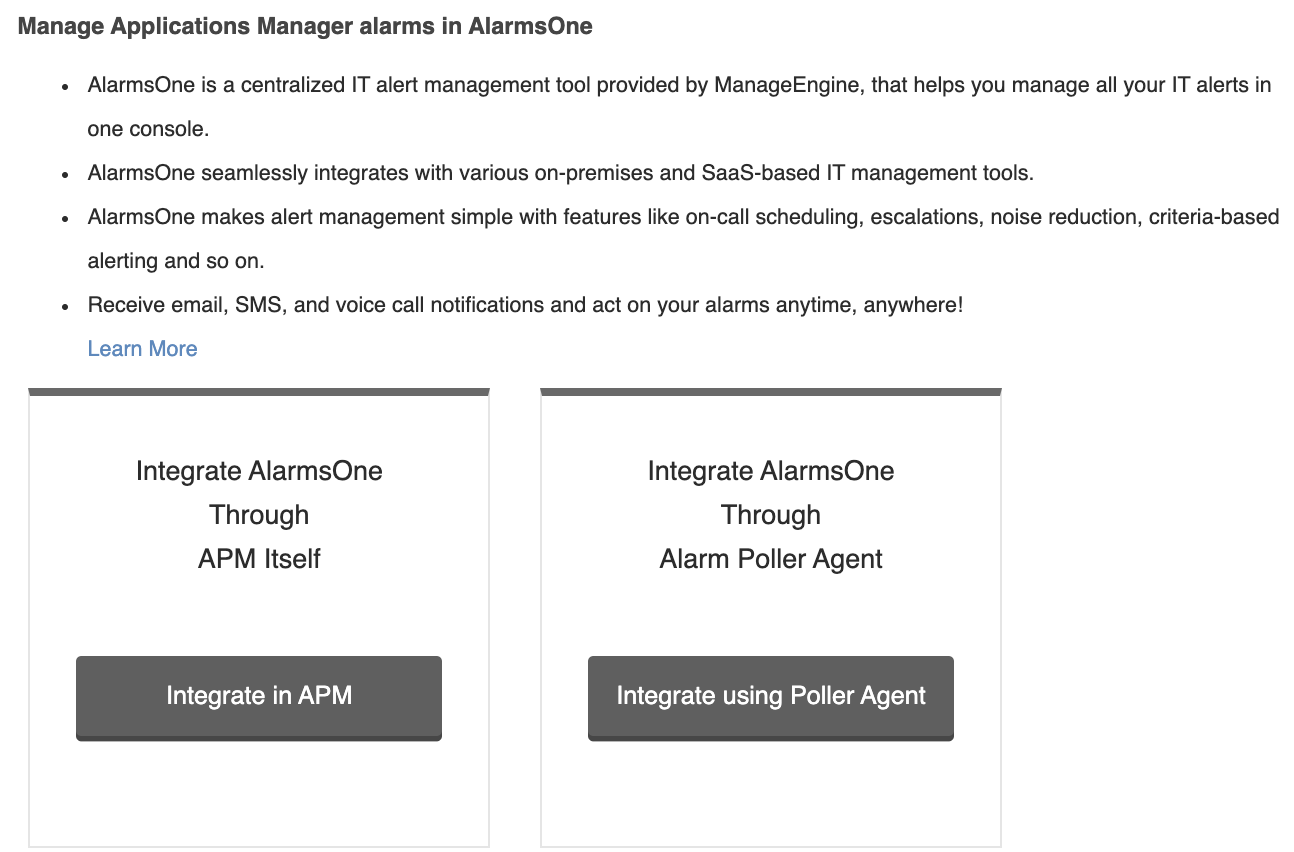
You can integrate it with another Manage Engine product called AlarmsOne, to centralize it. This is a separate product, so it has its own price/plan.
ClusterControl Notifications
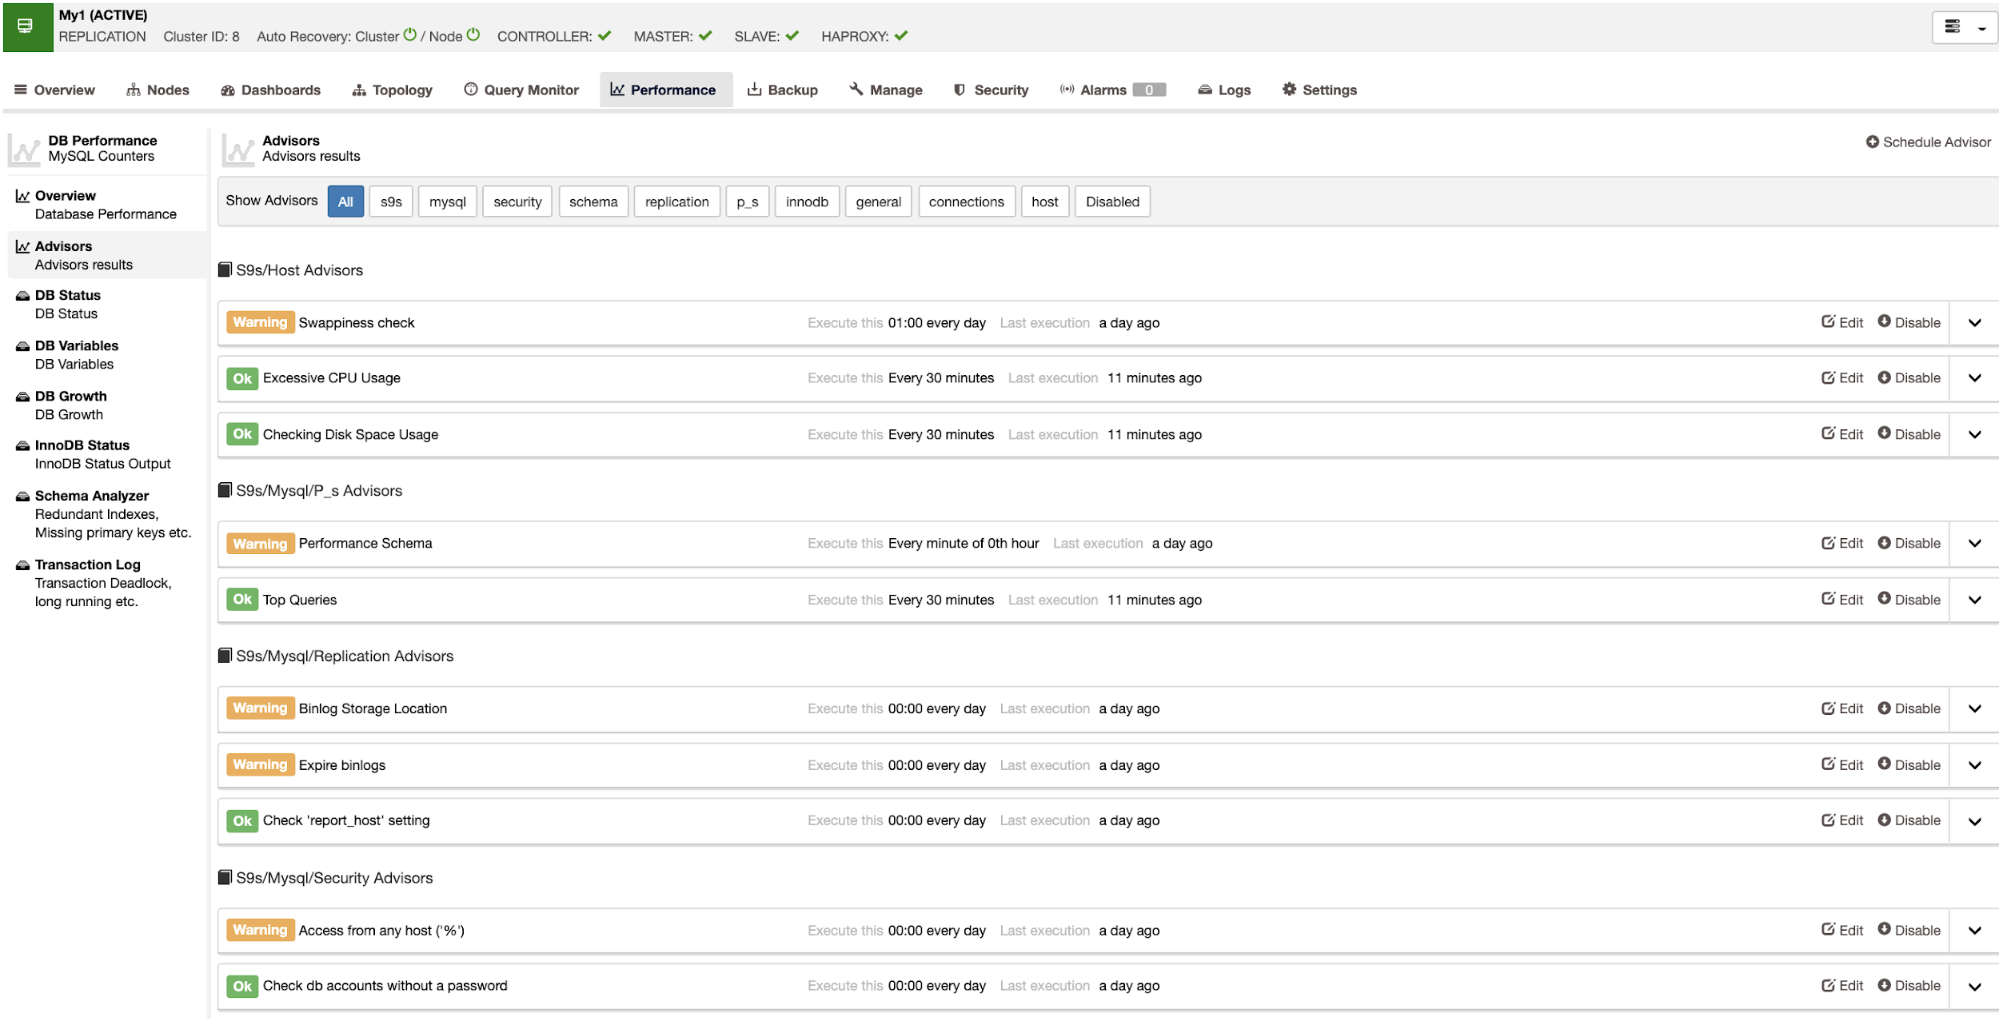
It also has an alarm system using Advisors. ClusterControl has some predefined advisors that could be modified if needed, but in general, it’s not necessary so you don’t need to do any manual task. You can also use the Developer Studio tool to manage or create a new script.
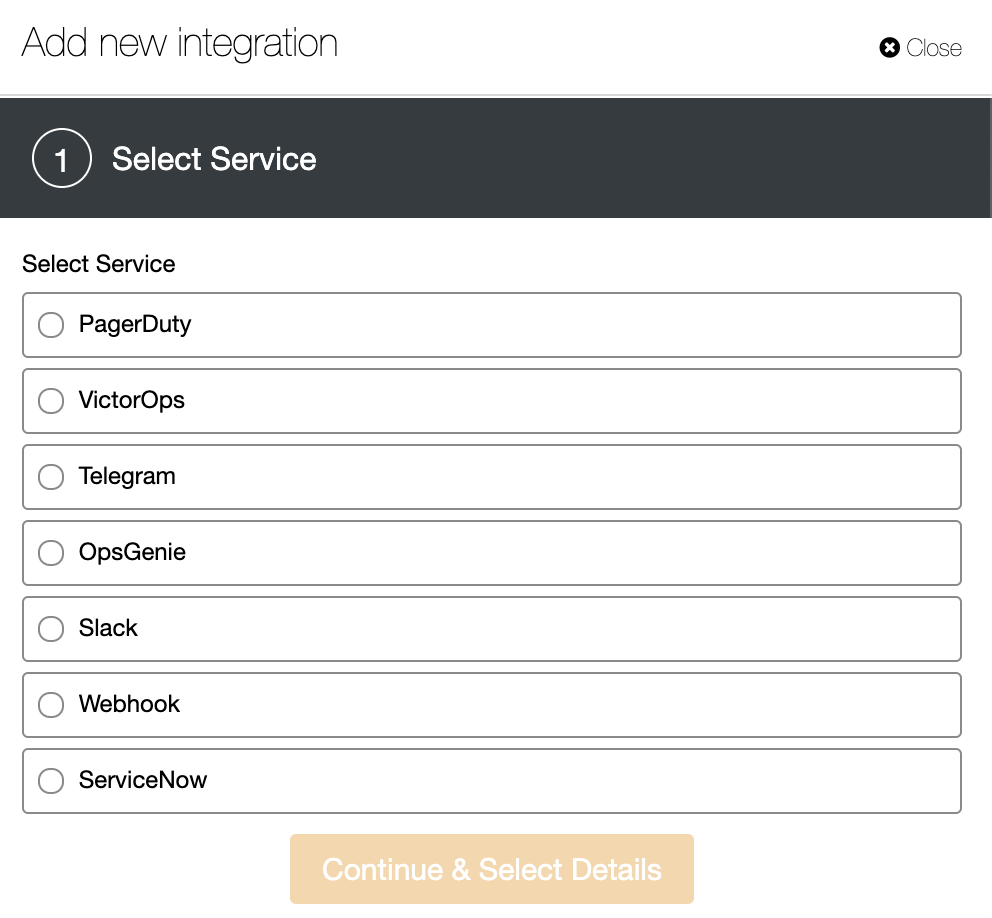
It has integration with 3rd party tools like Slack or PagerDuty, so you can receive notifications there too.
Conclusion
According to the features mentioned above, we can say Applications Manager is a good option to monitor both applications and databases in a basic way. It supports different languages, and it has also support not only for Linux but also for Windows as the Operating System. The installation process, however, can be very challenging for inexperienced users as it requires too many manual actions and configurations, the documentation is not well written and the monitoring options and metrics are basic.
On the other hand, we can say ClusterControl is an all-in-one management system with a lot of features, but only for databases and load balancer servers, and only available for Linux Operating System. In this case, the installation is really easy using the automatic installation script (it doesn’t require extra manual configuration or installation), the documentation has step-by-step guides, and it’s a complete monitoring system with dashboards and several metrics that could be useful for you.
You can perform not only monitoring tasks but also deployment, scale, management, and even more. The monitoring features of ClusterControl are also free and part of the Community Edition.